Annex
Other information: Corporate & Investment Banking
Highlights
- Lending stable over the quarter.
- Increase in deposits.
- Positive trend in earnings, strongly supported by good revenue performance, cost restraint and lower provisions.
- Stable risk indicators.
Business activity (1)
(Year-on-year change at constant exchange rate. Data as of 30-09-2017)
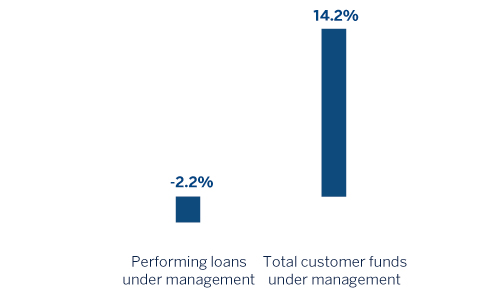
(1) Excluding repos.
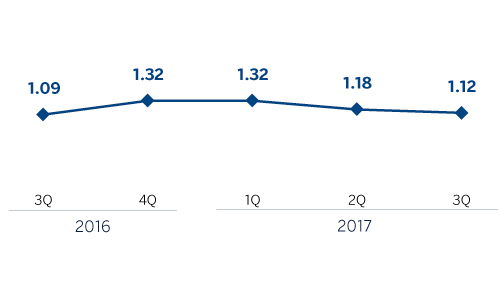
Gross income/ATAs
(Percentage. Constant exchange rate)
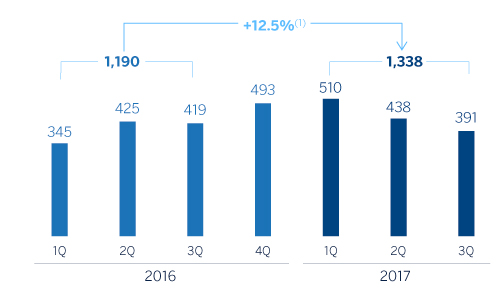
Operating income
(Million euros at constant exchange rate)
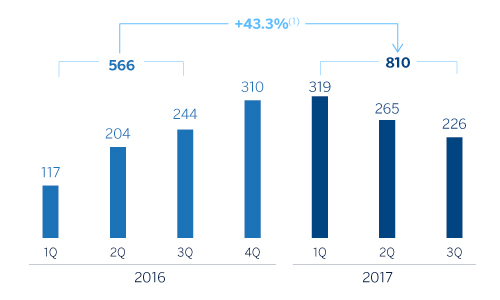
Net attributable profit
(Million euros at constant exchange rate)
(1) At current exchange rate: +9.5.
(1) At current exchange rate: +39.4%.
Breakdown of performing loans under management (1)
(30-09-2017)
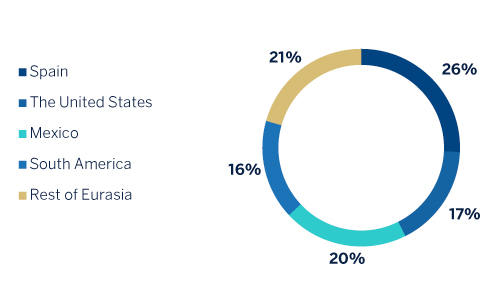
(1) Excluding repos.
Breakdown of customer funds under management (1)
(30-09-2017)
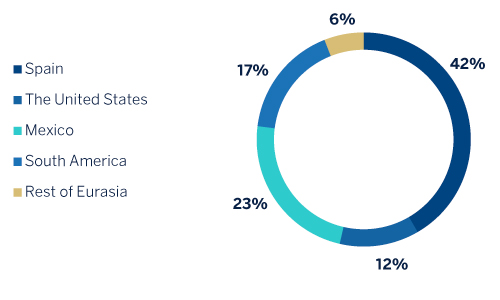
(1) Excluding repos.
Financial market trends
The third quarter of the year has featured a general rise in long-term interest rates, initially led by Europe, following a speech by Mario Draghi marked by optimism about the recovery. Subsequently other central banks fell in line when the United States made a further interest-rate hike in June.
These actions did not point to a radical change in monetary policy, but they did confirm a transition to a less accommodative environment. Thus the rise in long-term interest rates may be seen as a readjustment toward levels that are more in line with the fundamentals. It was only interrupted by one-off episodes related to policy risk in the United States (problems with raising the debt ceiling) and geopolitical risks that have, nevertheless, not generated either volatility or tension in the financial markets; in fact, they have coexisted with risk-taking strategies. Thus the uptick in interest rates was compatible with general rises in equity, the good performance of the banking sector, a reduction in the risk premium on the periphery and inflows into emerging markets.
In the Eurozone, the transition to less accommodative monetary policies has led to an appreciation of the euro to levels of USD 1.18 as of September 30, 2017 from USD 1.14 at the close of June. However, Janet Yellen's recent speech pointing to the Fed's intention of moving forward with its interest-rate hikes this year has moderated the trend for the appreciation of the euro.
Activity
All the comments below on rates of change, for both activity and earnings, will be given at constant exchange rates, unless expressly stated otherwise. These rates, together with changes at the current exchange rates, can be seen in the attached tables of financial statements and relevant business indicators.
The market context remains unchanged, with margins squeezed and surplus liquidity. Lending performing loans under management) has continued stable over the quarter, though it has declined by 2.7% since December 2016. Performance has varied by geographic area: outstanding growth in the rest of Europe, Mexico, Argentina, Chile and Colombia, and a decline in Spain, the United States and Peru.
Whit respect to asset quality indicators, the NPL ratio was 0.8% as of 30-Sep-2017, an improvement on the December 2016 figure (1.0%) and remains stable versus June 2017 (0.8%). The NPL coverage ratio, 100% at the same date, has improved on June 2017 (89%) and December 2016 (79%).
Customer funds increased by 6.4% since December 2016 and 5.1% over the quarter. Growth in Spain, Mexico and Colombia has offset a decline in Eurasia.
Results
CIB posted a net attributable profit of €810m in the first half of 2017, 43.3% up on the same period of 2016. This is mainly due to good revenue figures, contained expenses and a lower level of loan-loss provisions. The highlights of the income statement are summarized below:
-
Year-on-year increase in gross income (up 6.8%), thanks to the results of managing market volatility, above all in the rst quarter of 2017, and the positive performance of income from fees and commissions, basically in Spain.
The corporate finance business between January and September 2017 was characterized by a high level of activity and a signi cant marketing e ort, which has resulted in BBVA winning numerous mandates, some of which will be nalized in the coming months.
The Equity Capital Markets (ECM) unit has continued very active in the primary equity market in the third quarter of 2017. After August, a month with traditionally low activity, the market began to gain traction over the initial weeks of September. Currently work is being done on a number of mandates that will also be completed in the following months.
From the point of view of mergers & acquisitions (M&A), the third quarter continued in line with the good outlook of the rst quarter of the year, both in terms of number of deals closed and their volume. The interest of international investors in investing in Spain is still at high levels, despite some turmoil in the short term. The M&A market continues to take advantage of low short-term interest rates, abundant liquidity and the positive macroeconomic environment.
In addition, BBVA has demonstrated its leading position in green finance, as one of the most active nancial institutions in the green bond and green loan markets. BBVA believes and is committed to this growing nancing market, so it is opening up the range of “green and sustainable” nancing products for its customers (bonds, loans, credit facilities, project nance, etc.).
-
Cumulative operating expenses have declined by 2.2% versus the same period in 2016. The keys to this gure continue to be a slowdown in the growth of personnel and discretionary expenses, and the increase in costs associated with the investment plan in technology.
-
Lastly, it is worth noting the lower impairment losses on nancial assets with respect to the same period in 2016 (when there were increased provisions arising from the downgrades in the ratings of some oil & gas companies in the United States, above all during the rst three months of this year).
Financial statements and relevant business indicators (Million euros and percentage)
| Income statement | Jan.-Sep. 17 | ∆% | ∆%(1) | Jan.-Sep. 16 |
|---|---|---|---|---|
| Net interest income | 822 | (17.5) | (16.4) | 996 |
| Net fees and commissions | 525 | 9.4 | 10.3 | 480 |
| Net trading income | 621 | 56.0 | 64.9 | 398 |
| Other income/expenses | 104 | 0.7 | 0.1 | 103 |
| Gross income | 2,072 | 4.8 | 6.8 | 1,978 |
| Operating expenses | (734) | (2.8) | (2.2) | (756) |
| Personnel expenses | (359) | (6.5) | (6.1) | (384) |
| Other administrative expenses | (295) | (1.2) | (0.2) | (298) |
| Depreciation | (80) | 9.8 | 10.3 | (73) |
| Operating income | 1,338 | 9.5 | 12.5 | 1,222 |
| Impairment on financial assets (net) | (40) | (79.7) | (79.7) | (197) |
| Provisions (net) and other gains (losses) | (30) | (53.7) | (54.2) | (65) |
| Profit/(loss) before tax | 1,268 | 32.1 | 36.7 | 960 |
| Income tax | (360) | 23.6 | 28.7 | (291) |
| Profit/(loss) for the year | 908 | 35.7 | 40.2 | 669 |
| Non-controlling interests | (98) | 11.3 | 19.1 | (88) |
| Net attributable profit | 810 | 39.4 | 43.3 | 581 |
| Balance sheets | 30-09-17 | ∆% | ∆%(1) | 31-12-16 |
|---|---|---|---|---|
| Cash, cash balances at central banks and other demand deposits | 1,567 | (39.7) | (34.0) | 2,600 |
| Financial assets | 72,246 | (12.6) | (12.1) | 82,666 |
| Loans and receivables | 80,968 | (8.0) | (5.6) | 87,988 |
| of which loans and advances to customers | 56,532 | (6.4) | (3.5) | 60,428 |
| Inter-area positions | - | - | - | - |
| Tangible assets | 28 | (19.6) | (18.3) | 35 |
| Other assets | 3,557 | 42.7 | 48.0 | 2,492 |
| Total assets/liabilities and equity | 158,365 | (9.9) | (8.3) | 175,781 |
| Financial liabilities held for trading and designated at fair value through profit or loss | 47,346 | (13.6) | (12.9) | 54,785 |
| Deposits from central banks and credit institutions | 36,276 | (17.0) | (16.9) | 43,705 |
| Deposits from customers | 45,468 | 1.4 | 3.9 | 44,836 |
| Debt certificates | 491 | (14.3) | (13.3) | 574 |
| Inter-area positions | 21,391 | (10.7) | (5.7) | 23,957 |
| Other liabilities | 3,745 | (2.7) | (1.5) | 3,850 |
| Economic capital allocated | 3,646 | (10.5) | (8.1) | 4,074 |
| Relevant business indicators | 30-09-17 | ∆% | ∆%(1) | 31-12-16 |
|---|---|---|---|---|
| Loans and advances to customers (gross)(2) | 51,740 | (6.2) | (2.9) | 55,160 |
| Non-performing loans and guarantees given | 633 | (21.7) | (17.1) | 808 |
| Customer deposits under management (2) | 38,715 | 2.9 | 6.0 | 37,616 |
| Off-balance sheet funds (3) | 1,277 | 10.3 | 22.4 | 1,157 |
| Efficiency ratio (%) | 35.4 | 37.7 | ||
| NPL ratio (%) | 0.8 | 1.0 | ||
| NPL coverage ratio (%) | 100 | 79 | ||
| Cost of risk (%) | 0.11 | 0.12 |
- (1) Figures at constant exchange rates.
- (2) Excluding repos.
- (3) Includes mutual funds, pension funds and other off-balance sheet funds.