
| Income statement (Million euros) |
|
|
|
|---|---|---|---|
|
|
Spain | ||
|
|
January-Sep. 11 | ∆% | January-Sep. 10 |
| Net interest income | 3,308 | (11.4) | 3,734 |
| Net fees and commissions | 1,135 | (10.8) | 1,273 |
| Net trading income | 91 | (4.6) | 95 |
| Other income/expenses | 365 | 1.9 | 358 |
| Gross income | 4,900 | (10.3) | 5,461 |
| Operating costs | (2,093) | 1.0 | (2,072) |
| Personnel expenses | (1,274) | 1.2 | (1,259) |
| General and administrative expenses | (745) | 0.6 | (741) |
| Depreciation and amortization | (74) | 2.5 | (72) |
| Operating income | 2,806 | (17.2) | 3,389 |
| Impairment on financial assets (net) | (1,246) | 36.1 | (916) |
| Provisions (net) and other gains (losses) | 73 | (59.3) | 179 |
| Income before tax | 1,633 | (38.4) | 2,653 |
| Income tax | (472) | (38.8) | (770) |
| Net income | 1,162 | (38.3) | 1,883 |
| Non-controlling interests | - | n.s. | (2) |
| Net attributable profit | 1,162 | (38.2) | 1,881 |
| Balance sheet (Million euros) |
|
|
|
|---|---|---|---|
|
|
Spain | ||
|
|
30-09-11 | ∆% | 30-09-10 |
| Cash and balances with central banks | 9,142 | 74.2 | 5,249 |
| Financial assets | 73,128 | 5.6 | 69,232 |
| Loans and receivables | 222,449 | (2.1) | 227,204 |
| Loans and advances to customers | 207,980 | (2.2) | 212,693 |
| Loans and advances to credit institutions and other | 14,469 | (0.3) | 14,512 |
| Tangible assets | 932 | (4.8) | 979 |
| Other assets | 3,310 | 12.8 | 2,933 |
| Total assets/Liabilities and equity | 308,960 | 3.4 | 305,597 |
| Deposits from central banks and credit institutions | 37,664 | 14.0 | 33,047 |
| Deposits from customers | 120,530 | 7.1 | 112,564 |
| Debt certificates | - | n.s. | 1 |
| Subordinated liabilities | 5,880 | 2.7 | 5,727 |
| Inter-area positions | 71,376 | (13.6) | 82,645 |
| Financial liabilities held for trading | 45,442 | 3.4 | 43,929 |
| Other liabilities | 17,626 | 1.7 | 17,336 |
| Economic capital allocated | 10,443 | 0.9 | 10,349 |
| Significant ratios (Percentage) |
|
|
|
|---|---|---|---|
|
|
España | ||
|
|
30-09-11 | 30-06-11 | 30-09-10 |
| Efficiency ratio | 42.7 | 40.7 | 37.9 |
| NPA ratio | 4.9 | 4.7 | 4.8 |
| NPA coverage ratio | 42 | 43 | 47 |
| Risk premium | 0.77 | 0.79 | 0.40 |
Spain highlights in the third quarter
- Improved market shares and spreads.
- Stabilization of the net interest income.
- Expenses remain flat.
- Risk indicators kept in check.
The area of Spain includes all the segments of BBVA’s banking and non-banking business in the country.
In the third quarter of 2011, Spanish credit institutions have operated under a set of special circumstances affecting the sector: a bank restructuring process, gradual deleveraging, growing difficulties in international wholesale funding markets, moderate economic growth, and negative developments in the financial markets. Among the highlights of the bank restructuring process have been the IPOs of Bankia, CaixaBank and Banca Cívica, the announcement of mergers between medium-sized banks (such as Popular and Pastor), recent interventions in some savings banks, more branch closures in the sector since the onset of the crisis (1,768 fewer in the first half of the year, the latest available data), and the trend towards a return to normal in the asset and liability prices in the system. There will be opportunities for banks that are well positioned in this environment.
The gradual deleveraging process, which is necessary and positive for the Spanish economy, has led to a year-on-year fall of 3.5% in corporate and household lending (latest available figures for August). Individuals have continued to reduce their consumer spending, while new home mortgages have fallen by 46% in the same time frame (also August figures); at the same time, companies have steadily reduced their high levels of credit leverage. As a result, the stock of credit on the balance sheets of the commercial networks has fallen by €56,100m since the start of the year. The cost of new finance has increased by 75 basis points in this period, due to the more expensive interbank market conditions. However, the volume of new deposits and other on-balance-sheet funds is up by €12,264m since September 2010, thus reducing dependence on wholesale markets over the last 12 months. The rate of renewal of the most conservative deposit products under better conditions than last year has been high, thus increasing customer spreads in the sector.
BBVA has consolidated its leading position in both lending and customer funds in the household and corporate segments. It has also increased profitability, measured as the net interest income over ATA, from the minimum levels of the fourth quarter of 2010. This is largely the result of increasing market share in the products involving the biggest customer loyalty, adapting commercial product and services to the specific needs of each customer, and adequate risk control procedures.
Gross lending to customers in the area as of 30-Sep-2011 amounted to €212,639m, a fall of 2.4% year-on-year; however, yield on loans was up by 46 basis points on the fourth quarter of 2010.
Customer funds under management (deposits, mutual funds and pension funds) amounted to €150,182m. BBVA made a significant gain of 16 basis points in market share in household and corporate current and savings accounts to reach 9.6% (latest available data to August). In addition, the area has improved its positioning in time deposits and mutual funds by 76 basis points since the start of the year. More than 73% of funds correspond to household customers, who have increased their loyalty to the Bank.
In off-balance-sheet funds the Group has maintained its market share in mutual funds at 16.8% (September data), with assets under management in Spain of €20,220m. The amount fell by 3.6% in the third quarter as the value of assets under management deteriorated due to the market turmoil. It is worth pointing out that, according to the latest data from August 2011, the effect of this fall in BBVA is much less significant than in the rest of the system, give funds. Lastly, the pension funds managed by BBVA in Spain amount to €16,741m, in line with the figure as of 30-Jun-2011. This has allowed BBVA to maintain its position as the biggest pension fund manager in Spain, with a market share of 18.3% (latest available data as of June).
The most important aspects of earnings in the area over the nine months ended 30-Sep-2011 are given below.
BBVA has stabilized its quarterly net interest income at around €1,100m, in a quarter with growing funding costs and lower contribution from global business. This is partly due to the turmoil on the financial markets that has led to a loss in the asset values, and partly to reduced activity. The resilient net interest income has been a result of the repricing of loans, the increased volume of lower-cost current and savings account deposits, and the high proportion of time deposits renewed at significantly lower rates than those initially taken out 12 months previously. Over the nine months ended 30-Sep-2011, net interest income stood at €3,308m. Fees and commissions for the quarter, at €336m, were below the average for the year, for a number of reasons: the seasonal factor of the summer months; the negative impact of the markets on fees linked to mutual funds; the lower volume of M&A operations in the corporate segment; and fee reductions associated with greater customer loyalty. The good performance of the insurance business does not compensate the adverse performance of NTI in the quarter, which were hit by the economic situation, the low level of activity in Wholesale Banking and the fall in asset prices. Overall, the steady net interest income and positive performance of the insurance business, balanced against the negative performance of other income, have resulted in gross income for the nine months ended 30-Sep-2011 of €4,900m.
Operating costs in the area remain closely in check. In the nine months ended 30-Sep-2011 they totaled €2,093m, a year-on-year increase of 1.0%, below the rate of inflation (3.1%). As a result, the operating income for the nine months ended 30-Sep-2011 was €2,806m (€3,389m for the same period of 2010).
The main asset quality indicators show a slight increase in the NPA ratio, to 4.9% (4.7% as of 30-Jun-2011). This is basically because of the reduction in lending mentioned above, since the balance of NPA as of 30-Sep-2011 is stable compared with the figure for 30-Jun-2011. The figure for BBVA compares with an increasing NPA ratio in the market that stands at 7.2% according to the latest available figures (August). The 42% coverage ratio remains at similar levels to the previous quarter (43% as of 30-Jun-2011). Finally, the level of new NPA has fallen significantly and the ratio of recoveries over new NPA has also improved, closing the quarter at 72% (64% between April and June 2011).
In short, the most recurring revenue remained steady, thanks among other factors to adequate management of spreads, increased loyalty and gains in market share in the main segments. At the same time, there was a lower percentage of non-recurring earnings, cost restraint and stability in asset quality. As a result, the net attributable profit in the area was €1,162m (€1,881m in the same period in 2010).
| Spain. Operating income (Million euros) 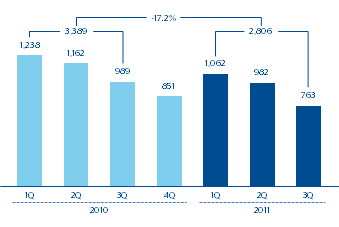 |
Spain. Net attributable profit (Million euros) 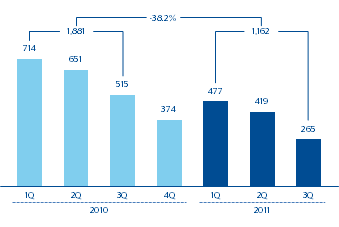 |
||||
|---|---|---|---|---|---|
| Detail of real estate developers lending (Million euros) |
|
|
|
|
|
|
|
30-09-11 | % Weighting | 31-12-10 | % Weighting | Absolute variation |
| With collateral | 14,118 | 92.5 | 15,249 | 91.8 | (1,131) |
| Finished properties | 7,344 | 48.1 | 7,403 | 44.6 | (59) |
| Construction in progress | 2,794 | 18.3 | 3,531 | 21.3 | (737) |
| Land | 3,980 | 26.1 | 4,315 | 26.0 | (335) |
| Without collateral and other | 1,138 | 7.5 | 1,359 | 8.2 | (221) |
| Total | 15,256 | 100.0 | 16,608 | 100.0 | (1,352) |
| Coverage of real estate developers exposure (Million euros at 30-09-11) |
|
|
|
|
|
|---|---|---|---|---|---|
|
|
Risk amount | Shortfall over Collateral (1) | Provision | % Coverage over shortfall | % Coverage over risk |
| NPL | 3,676 | 1,482 | 972 | 66 | 26 |
| Substandar | 2,348 | 1,048 | 304 | 29 | 13 |
| Generic provision |
|
|
263 |
|
|
| Total | 6,024 | 2,530 | 1,539 | 61 | 26 |
(1) Shortfall over updated collateral values and additional haircut established by the Bank of Spain regulation.
| Foreclosures and asset purchases Million euros at 30-09-11) |
|
|
|
|
|---|---|---|---|---|
|
|
Gross amount | Provision | % Coverage | Net amount |
| From real estate developers | 4,300 | 1,407 | 33 | 2,893 |
| From Dwellings | 1,306 | 333 | 25 | 973 |
| Other | 1,026 | 416 | 41 | 610 |
| Total | 6,632 | 2,156 | 33 | 4,476 |
Exposure in the developer sector in Spain as of 30-Sep-2011 stood at €15,256m, a steady fall and €1,352m below the figure at the close of 2010. Of this total, €6,024m are NPA or substandard, a similar figure to nine months earlier (€5,924m) but below that for the previous quarter (6,183m). It is also worth highlighting the great stability in the NPA coverage ratio, which is up from 25% at the close of December 2010 and June 2011, to 26% as of 30-Sep-2011. The value of the collateral covering developer risk, based on up-to-date appraisals, is €21,471m, which maintains the average LTV of 71% and easily covers the portfolio value. In addition, specific and generic provisions cover 26% of the most substandard impaired assets and 61% of the amount to be provisioned (the value in excess of the collateral after applying the regulatory criteria that entered into force with Bank of Spain Circular 3/2010). BBVA also maintains a total of €4,300m in real estate assets at gross book value from lending to companies. These assets have an average coverage ratio of 33% (above the figure of 32% in June 2011 and 31% in March 2011).