Own funds and Capital
Capital resources
The following are considered for the purpose of calculating the minimum capital requirements under the solvency regulations: the elements and instruments corresponding to Tier 1 capital, which is defined as the sum of Common Equity Tier 1 capital (CET1) and additional Tier 1 capital (AT1), as defined in Part Two, Title I, Chapters I to III of the CRR, as well as their corresponding deductions, in accordance with articles 36 and 56, respectively.
Also considered are the elements of Tier 2 capital defined in Part Two of Chapter IV, section I of the CRR. The deductions defined as such in section II of the same Chapter are also considered.
The table below shows the amount of total eligible capital, net of deductions, for the different items making up the capital base as of December 31, 2018 and December 31, 2017, in accordance with the disclosure requirements for information relating to temporary capital set out by Implementing Regulation (EU) No. 1423/2013 of the Commission dated December 20, 2013:
Amount of capital (CC1)
Million Euros
| Reference to template CC2 (1) | 12-31-2018 | 12-31-2017 |
|---|---|---|
| a) Capital and share premium | 27,259 | 27,259 |
| b) Retained earning, other reserves and other equity (2) | 23,857 | 25,511 |
| c) Other accumulated earnings | (7,285) | (8,717) |
| d) Minoruty interests | 3,809 | 5,446 |
| e) Net interim attributable profit | 3,246 | 1,436 |
| Common Equity Tier 1 Capital before other regulatory adjustments | 50,887 | 50,935 |
| f) Additional value adjustments | (356) | (332) |
| g) Intangible assets | (8,199) | (6,627) |
| h) Deferred tax assets | (1,260) | (755) |
| i) Fair value reserves related to gains o losses on cash flow hedges | 35 | (193) |
| j) Expected losses in equity | - | (20) |
| k) Profit or losses on liabilities measured at fair value | (116) | - |
| l) Direct and indirect holdings of own instruments | (432) | (278) |
| m) Securitisations tranches at 1250% | (34) | (39) |
| n) Transitional CET1 adjustments | (150) | (324) |
| o) Admisible CET1 deductions | (61) | (26) |
| Total Common Equity Tier 1 regulatory adjustments | (10,573) | (8,594) |
| Common Equity Tier 1 (CET1) | 40,313 | 42,341 |
| p) Equity instruments and share premium classified as liabilities | 4,863 | 5,751 |
| q) Items referred in Article 486 (4) of the CRR | 142 | 142 |
| r) Qualifying Tier 1 capital included in consolidated AT1 capital (including minority interests not included in row d) issued by subsidiaries and held by third parties) | 629 | 403 |
| Additional Tier 1 before regulatory adjustments | 5,634 | 6,296 |
| s) Transitional adjustments Tier 1 | - | (1,657) |
| Total regulatory adjustments of Additional Tier 1 | - | (1,657) |
| Additional Tier 1 (AT1) | 5,634 | 4,639 |
| Tier 1 (Common Equity Tier 1 + Additional Tier 1) | 45,947 | 46,980 |
| t) Equity instruments and share premium | 3,768 | 1,759 |
| u) Amount of the admissible items, pursuant to Article 486 | - | - |
| v) Admissible shareholders' funds instruments included in consolidated Tier 2 issued by subsidiaries and held by third parties | 4,409 | 6,438 |
| Of which: instruments issued by subsidiaries subject to ex-subsidiary stage | 37 | 317 |
| w) Credit risk adjustments | 579 | 601 |
| Tier 2 before regulatory adjustments | 8,756 | 8,798 |
| Tier 2 regulatory adjustments | - | - |
| Tier 2 | 8,756 | 8,798 |
| Total Capital (Total capital = Tier 1 + Tier 2) | 54,703 | 55,778 |
| Total RWA's | 348,264 | 362,875 |
| CET 1 (phased-in) | 11.6% | 11.7% |
| CET 1 (fully loaded) | 11.3% | 11.0% |
| TIER 1( phased in) | 13.2% | 12.9% |
| TIER 1( fully loaded) | 12.9% | 12.8% |
| Total Capital (phased in) | 15.7% | 15.4% |
| Total Capital (fully loaded) | 15.5% | 15.1% |
- (1) Reference to regulatory balance sheet headings (CC2), where the different entries were reflected
- (2) With the aim of enhance the robustness of the consolidated financial statements, as of December, 31, 2018, the Group has made an accounting policy change that consists in the record on a sole accounting entry of "Retained earnings", of both the booking entries for the reevaluation of monetary assets due to hyperinflation effects, and of the conversion differences generated in the translation of the public statements of the subsidiaries in hyperinflationary economies.
- Both impacts were being previously recorded in "Other Comprehensive Income". The Group has made this change on accounting policies since, according to NIC8, it provides more reliable and relevant information about the hyperinflationary economies. For more information, see note 1.3 of the Consolidated Financial Statements as of 2018.
As of December 31, 2018, the Tier 1 phased-in Capital (CET1) stood at 11.6% (the fully loaded ratio was 11.3%). Excluding the phasing calendar effect in the computability of minority interests and deductions –which increases from 80% in 2017 to 100% in the year 2018–, and including the positive impact of the sale of the BBVA Chile share (+50 basis points), the phased-in CET1 ratio increased by +48 basis points, marked by the generation of the net result of payment of dividends and instruments AT1 payments, and a contained evolution of risk-weighted assets.
Additionally, the phased-in CET1 ratio takes into account the impact of the first implementation of the IFRS 9 standard. In this context, the European Commission and Parliament have established temporary arrangements that are voluntary for the institutions, adapting the impact of IFRS 9 on capital adequacy ratios. The Group has informed the supervisory body of its adherence to these arrangements.
Additionally, transfer of BBVA’s real estate business in Spain to Cerberus had no material impact on the ratio (check section 1.1.4.).
At the Tier 1 level, the phased-in ratio is 13.2%, standing out the computation of two new issues of preferred shares, potentially convertible into ordinary shares (CoCos), rated as Additional Level 1 for an amount of 1 billion USD and 1 billion EUR, respectively. Likewise, 1.5 billion USD issue of AT1, which was cancelled early in May, and another for 1.5 billion euros, for which BBVA announced in January 2019 that it will exercise the early redemption option have been stopped from being computed. The net impact of these emissions on the phased-in Tier 1 capital ratio is -26 basis points.
At the Tier 2 level, the Group received authorization in the third quarter from the regulator for the calculation of a subordinated issue of 300 million dollars made in May and the cancellation of the issues made by BBVA Chile after the sale of the share in this entity. The total phased-in ratio is 15.7%, taking into account the effects mentioned above.
Additionally, the Group has continued with its program to fulfil with MREL requirements by closing two public issues of non-preferred senior debt, for a total of 2.5 billion EUR. In terms of MREL (minimum requirement for own funds and eligibility liabilities), as of January 1, 2020, the requirement that BBVA must reach shall be a volume of equity and eligible liabilities corresponding to 15.08% of the total liabilities and equity of its resolution group (BBVA S.A. and its subsidiaries, which belong to the same European resolution group), with data as of December 31, 2017 (28.04% expressed in RWA terms). The Group estimates that it is currently in line with this MREL requirement.
Capital ratio evolution during 2018
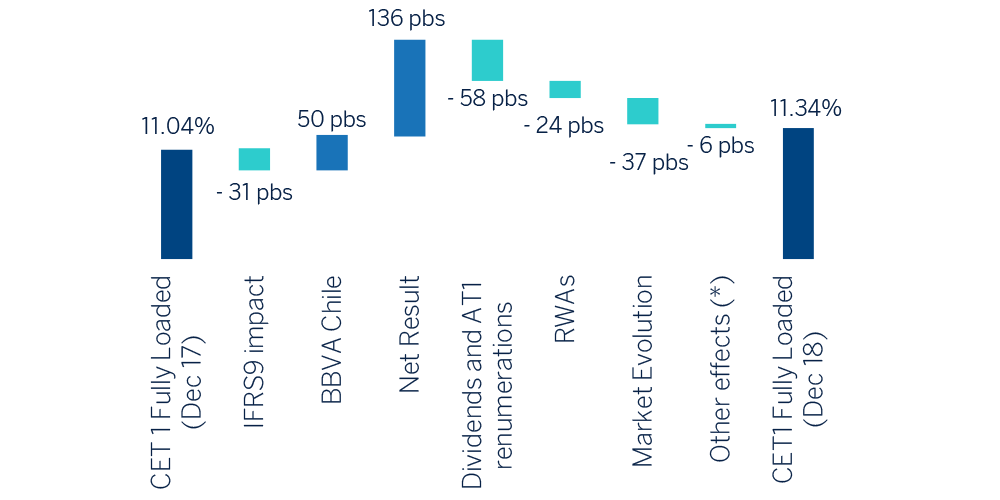
(1) Other effects mainly includes the variation on eligible minority interests and other regulatory deductions.
These capital levels are above the requirements established by the ECB in its SREP letter and the systemic buffers applicable to BBVA Group for the CET1 ratio in 2018.
On the other hand, risk-weighted assets (RWA) decreased during the year, mainly due to the sale of BBVA Chile and the depreciation of currencies against the euro. The Group has performed three securitisations during the year, including one traditional in June, of a portfolio of consumer finance automobiles loans for an amount of 800 million euros and two other synthetic ones in March and December, for which the European Investment Fund (EIF, a subsidiary of the European Investment Bank) granted a financial guarantee. The positive impact of the three securitisations on capital via the release of risk-weighted assets was 971 million euros. In addition, during the first semester, BBVA received authorisation from the European Central Bank (ECB) to update the calculation of the RWA for structural exchange rate risk under the standard model.
Annex III, available on the Group's website, shows the features of the main capital instruments, in accordance with Implementing Regulation (EU) No. 1423/2013 of the Commission dated December 20, 2013.
The process followed is shown below, the process following for, based on the shareholders' equity reported in the Group's Consolidated Annual Report and by applying the deductions and adjustments shown in the table below, the regulatory capital figure eligible for solvency purposes is arrived at:
Reconciliation of the Public Balance Sheet from the accounting perimeter to the regulatory perimeter
Million Euros
| Eligible capital resource | 12/31/2018 | 12/31/2017 |
|---|---|---|
| Capital | 3,267 | 3,267 |
| Share premium | 23,992 | 23,992 |
| Retained earnings, revaluation reserves and other reserves | 22,963 | 25,443 |
| Other equity instruments (net) | 50 | 54 |
| Treasury shares | (296) | (96) |
| Attributable to the parent company | 5,324 | 3,519 |
| Attributed dividend | (975) | (1,043) |
| Total Equity | 54,326 | 55,136 |
| Value adjustments | (7,215) | (8,792) |
| Minority interests | 5,764 | 6,979 |
| Shareholders' equity | 52,874 | 53,323 |
| Intangible assets | (8,199) | (6,627) |
| Fin. treasury shares | (27) | (48) |
| Indirect treasury shares | (109) | (134) |
| Deductions | (8,335) | (6,809) |
| Temporary CET 1 adjustments | - | (273) |
| Capital gains from the Available-for-sale debt instruments portfolio | - | (256) |
| Capital gains from the Available-for-sale equity portfolio | - | (17) |
| Differences from solvency and accounting level | (176) | (189) |
| Equity not eligible at solvency level | (176) | (462) |
| Other adjustments and deductions | (4,049) | (3,711) |
| Common Equity Tier 1 (CET 1) | 40,313 | 42,341 |
| Additional Tier 1 before Regulatory Adjustments | 5,634 | 6,296 |
| Total Regulatory Adjustments of Aditional Tier 1 | - | (1,657) |
| Tier 1 | 45,947 | 46,980 |
| Tier 2 | 8,756 | 8,798 |
| Total Capital (Tier 1 + Tier 2) | 54,703 | 55,778 |
| Total Minium equity required (1) | 41,619 | 40,370 |
- (1) Calculated over the minimum total capital applicable at each period.
Following the guidelines of the EBA (EBA/GL/2018/01), the following is a summary of own funds, principal capital ratios, leverage ratio with and without the application of the transitional provisions of IFRS 9 or ECL analogous.
IFRS9-FL: Summary of the own funds, main capital and leverage ratios with and without the application of IFRS9 transitional arrangements or similar Expected Credit Losses (ECL)
Million Euros
| Own funds | 12-31-2018 | 09-30-2018 (1) | 06-30-2018 | 03-31-2017 |
|---|---|---|---|---|
| CET1 Capital | 40,313 | 38,995 | 39,550 | 39,858 |
| CET1 Capital without IFRS9 transitional arrangement or similar ECL | 39,449 | 38,131 | 38,685 | 38,753 |
| Tier 1 Capital (T1) | 45,947 | 45,098 | 45,717 | 45,987 |
| Tier 1 Capital (T1) without IFRS9 transitional arragement or similar ECL | 45,083 | 44,233 | 44,852 | 44,882 |
| Total Capital | 54,703 | 53,933 | 54,958 | 54,384 |
| Total Capital without IFRS9 transitional arragement or similar ECL | 53,839 | 53,069 | 54,094 | 53,276 |
| Risk-weighted assets (million euros) | ||||
| Total Risk-weighted assets | 348,264 | 343,053 | 356,887 | 358,941 |
| Total Risk-weighted assets without IFRS9 transitional arrangement or similar ECL | 348,804 | 343,272 | 357,107 | 358,262 |
| Capital ratio | ||||
| CET1 Capital (as a percentage of total exposure to risk) | 11.6% | 11.4% | 11.1% | 11.1% |
| CET1 Capital (as a percentage of total exposure to risk) without IFRS9 transitional arrangement or similar ECL | 11.3% | 11.1% | 10.8% | 10.8% |
| Tier 1 Capital (T1) (as a percentage of total exposure to risk) without IFRS9 transitional arrangement or similar ECL | 13.2% | 13.1% | 12.8% | 12.8% |
| Tier 1 Capital (T1) (as a percentage of total exposure to risk) without IFRS9 transitional arrangement or similar ECL | 12.9% | 12.9% | 12.6% | 12.5% |
| Total Capital (as a percentage of total exposure to risk) | 15.7% | 15.7% | 15.4% | 15.2% |
| Total Capital (as a percentage of total exposure to risk) without IFRS9 transitional arrangement or similar ECL | 15.4% | 15.5% | 15.1% | 14.9% |
| Leverage Ratio | ||||
| Total exposure related to leverage ratio | 705,299 | 690,607 | 711,046 | 707,638 |
| Leverage Ratio | 6.5% | 6.5% | 6.4% | 6.5% |
| Leverage ratio without IFRS9 transitional arrangements or similar ECL | 6.4% | 6.4% | 6.3% | 6.3% |
- (1) The application of article 5 of Decision (EU) 2015/656 of the European Central Bank of 4 February, 2015, implies the inclusion of a dividend of €2,142 million which is the outcome of applying the pay-out ratio of 2017 to the interim profits of September 31, 2018, instead of €1,476 million that reflects the shareholders remuneration's policy announced by BBVA Group.
- Applying the pay-out announced by the Group, the phased-in CET1 ratio as of September 2018 comes to 11.6% (11.3% fully loaded)
Bank Risk Profile and Minimum Capital Requirements
The risks inherent in the business that make up the risk profile of BBVA Group are as follows:
- Credit and dilution risk: credit risk arises from the probability that one party to a financial instrument will fail to meet its contractual obligations for reasons of insolvency or inability to pay and cause a financial loss for the other party. This includes counterparty risk, issuer credit risk, liquidation risk and country risk.
- Counterparty risk: the credit risk corresponding to derivative instruments, repurchase and resale transactions, securities or commodities lending or borrowing transactions and deferred settlement transactions.
- Credit valuation adjustment (CVA) risk:. Its aim is to reflect the impact on the fair value of the counterparty's credit risk, resulting from OTC derivative instruments that are not credit derivatives recognized for the purpose of reducing the amount of credit exposures.
- Market risk: Market risk originates in the possibility that there may be losses in the value of positions held due to movements in the market variables that affect the valuation of financial products and assets in trading activity (trading portfolio). This includes risk with respect to the position in debt and equity instruments, exchange rate risk and commodity risk.
- Operational risk: the risk which can cause of losses due to human errors, inadequate or defective internal processes, inadequate conduct towards customers or markets, failures, interruptions or deficiencies of systems or communications, inadequate management of data, legal risks and, finally, as a consequence of external events, including cyberattacks, fraud committed by third parties, disasters and poor service provided by suppliers. This definition includes legal risk, but excludes strategic and/or business risk and reputational risk.
- Structural risks: these are divided into structural interest-rate risk (movements in interest rates that cause alterations in an entity's net interest income and equity value) and structural exchange-rate risk (exposure to variations in exchange rates originating in the Group's foreign companies and in the provision of funds to foreign branches financed in a different currency from that of the investment).
- Liquidity risk: risk of an entity having difficulties in duly meeting its payment commitments, and where it does not have to resort to funding under burdensome terms, which may harm the bank's image or reputation.
- Reputational risk: considered to be the potential loss in earnings as a result of events that may negatively affect the perception of the Group's different stakeholders.
The chart below shows the total risk-weighted assets broken down by type of risk (where the credit risk encompasses the counterparty risk) as of December 31, 2018 and December 31, 2017:
Distribution of RWAs by risk type eligible in Pillar I

(*) Credit Risk includes Risk by CVA adjustment
The total minimum capital requirements as per SREP notification as of December 31st, 2018, is up to €41,619 million (11.95% of total consolidated capital requirements in phased in terms); €41,370 million as of December 31st, 2017 (11.125% of total consolidated capital requirements in phased in terms).
These capital requirements are mainly composed of credit and dilution risk (includes counterparty and credit valuation adjustment risk), market risk, structural exchange rate risk and operational risk.
The chart below shows the risk-weighted assets broken down by risk and the capital requirements broken down by type of risk and categories of exposure, as of December 31 2018 and December 31 2017:
Capital requirements by risk type and exposure class
Million Euros
| Capital requirements (2) | RWA's (1) | |||
|---|---|---|---|---|
| Exposure Class and risk type | 12-31-2018 | 12-31-2017 | 12-31-2018 | 12-31-2017 |
| Credir Risk | 15,817 | 16,684 | 197,715 | 208,554 |
| Central goverments or central banks | 2,445 | 2,381 | 30,560 | 29,759 |
| Regional goverments or local authorities | 113 | 100 | 1,416 | 1,252 |
| Public sector entities | 57 | 52 | 714 | 654 |
| Multilateral development banks | 1 | 1 | 10 | 14 |
| International organisations | - | - | - | - |
| Institutions | 496 | 463 | 6,203 | 5,793 |
| Corporates | 7,159 | 7,328 | 89,481 | 91,600 |
| Retail | 2,941 | 3,134 | 36,768 | 39,177 |
| Secured by mortgages on immovable property | 1,237 | 1,569 | 15,466 | 19,609 |
| Exposures in default | 333 | 420 | 4,159 | 5,248 |
| Exposures associated with particularly high risk | 132 | 296 | 1,652 | 3,694 |
| Covered bonds | - | - | - | - |
| Claims on institutions and corporates with a short-term credit assesment | 0 | 0 | 2 | 5 |
| Collective investments undertakings | 5 | 2 | 57 | 24 |
| Other exposures | 898 | 938 | 11,229 | 11,725 |
| Securitisation exposures | 76 | 74 | 950 | 924 |
| Securitisation exposures | 76 | 74 | 950 | 924 |
| Total credit risk by standardised approach | 15,893 | 16,758 | 198,665 | 209,478 |
| Credit Risk | 6,498 | 6,673 | 81,222 | 83,408 |
| Central goverments or central banks | 54 | 94 | 677 | 1,172 |
| Institutions | 429 | 474 | 5,366 | 5,931 |
| Corporates | 4,441 | 4,531 | 55,513 | 56,643 |
| Of which: Specialised lending | 950 | 804 | 11,877 | 10,056 |
| Of which: SMEs | 506 | 646 | 6.330 | 8.077 |
| Of which: Others | 2,984 | 3,081 | 37,305 | 38,510 |
| Retail | 1,573 | 1,573 | 19,667 | 19,661 |
| Of which: Secured by real estate property | 591 | 661 | 7,385 | 8,268 |
| Of which: Qualifying revolving | 555 | 541 | 6,938 | 6,764 |
| Of which: Other SMEs | 140 | 129 | 1,752 | 1,612 |
| Of which: Non-SMEs | 287 | 241 | 3,592 | 3,017 |
| Equity | 1,220 | 1,342 | 15,246 | 16,775 |
| On the basis of method: | ||||
| Of which: Simple approach | 647 | 765 | 8,085 | 9,562 |
| Of which: PD/LGD approach | 479 | 396 | 5,989 | 4,953 |
| Of which: Intern models | 94 | 181 | 1,172 | 2,261 |
| On the basis of nature: | ||||
| Of which: Listed instruments | 439 | 433 | 5,493 | 5,412 |
| Of which: Not listed instruments in sufficiently diversified portfolios | 780 | 909 | 9,753 | 11,363 |
| Securitisation exposures | 134 | 66 | 1,673 | 827 |
| Securitisation exposures | 134 | 66 | 1,673 | 827 |
| Total credit risk by irb approach | 7,851 | 8,081 | 98,141 | 101,009 |
| Total contributions to the default fund of a ccp | 3 | 4 | 41 | 49 |
| Total credit risk | 23,748 | 24,843 | 296,846 | 310,536 |
| Settlement risk | - | - | - | - |
| Standardised approach: | 222 | 226 | 2,776 | 2,829 |
| Of which: Price Risk by fixed income exposures | 155 | 197 | 1,940 | 2,461 |
| Of which: Price Risk by Securitisation exposures | 1 | 2 | 13 | 20 |
| Of which: Price Risk by correlation | 54 | 11 | 670 | 142 |
| Of which: Price Risk by stocks and shares | 11 | 16 | 136 | 197 |
| Of which: Commodities Risk | 1 | 1 | 18 | 9 |
| IRB: Market Risk | 661 | 689 | 8,268 | 8,611 |
| Total trading book risk | 884 | 915 | 11,044 | 11,439 |
| Foreing exchange risk (standardised approach) | 182 | 366 | 2,271 | 4,579 |
| CVA risk | 110 | 125 | 1,377 | 1,566 |
| Operational risk | 2,938 | 2,780 | 36,725 | 34,755 |
| Capital requirements | 27,861 | 29,030 | 348,264 | 362,875 |
- (1) Risk-weighted assets according to the transitional period (phased-in).
- (2) Calculated on the total capital requirements of 8% (Article 92 CRR).
For more detail, see section 2 of the report.