Annex
Other information: Corporate & Investment Banking
Highlights
- Decline in lending volume, and slight increase in deposits.
- Positive trend in earnings, strongly supported by stable revenues, cost control and restriction on loan-loss provisions.
- Positive trend in risk indicators.
Business activity (1)
(Year-on-year change at constant exchange rates. Data as of 31-12-2017)

(1) Excluding repos.
Gross income/ATAs
(Percentage. Constant exchange rates)

Operating income
(Million euros at constant exchange rates)

Net attributable profit
(Million euros at constant exchange rates)
(1) At current exchange rates: -1.2.
(1) At current exchange rates: +12.8%.
Breakdown of performing loans under management (1)
(31-12-2017)

(1) Excluding repos.
Breakdown of customer funds under management (1)
(31-12-2017)

(1) Excluding repos.
Financial market trends
The last quarter of the year was marked by new steps in the process of normalizing monetary policies in the United States and the Eurozone, approval of the tax reform in the United States, and improved global activity figures. The Fed began to reduce its balance sheet in October and resumed interest-rate hikes in December. In Europe, the ECB announced the extension of the asset purchase program until September 2018, but starting in January it will reduce the level of monthly purchases by half (€30 billion). To prevent sharp movements on the financial markets, the central banks have made it clear that the exit will be very gradual. Long-term interest rates have thus remained anchored at low levels for most of the fourth quarter of 2017, above all in Europe. In the United States, the slope of the curve has leveled off significantly, due to the rise in two-year bond yields, which are beginning to adapt to expectations of further rises, while the ten-year yield has barely increased.
The dollar was not able to capitalize fully on the approval of the tax reform in the United States and the rise in short-term rates. In contrast, the euro began to reflect the withdrawal of monetary stimulus. Emerging currencies depreciated due to global factors, which combined with idiosyncratic factors in the case of the Mexican peso and the Turkish lira.
The stock market in the United States continued to hit new highs, buoyed by the effects of the tax reform and low long-term interest rates. In contrast, the European stock markets closed the quarter with a slight fall, after hitting a new high in October. In the case of Spain, the crisis in Catalonia has had a moderate impact on the markets. Spain's country risk premium has stabilized at around 114 basis points, although it reached a spread of 130 at the time of greatest uncertainty.
Activity
All the comments below on rates of change, for both activity and earnings, will be given at constant exchange rate, unless expressly stated otherwise. These rates, together with changes at the current exchange rate, can be seen in the attached tables of financial statements and relevant business indicators.
The market context remains unchanged, with margins squeezed and surplus liquidity. Lending (performing loans under management) fell year-on-year by 5.3%. Performance has varied by geographic area: outstanding growth in the Mexico, Argentina, Chile and Colombia; and a decline in Spain, the Rest of Eurasia, the United States and Peru.
Whth respect to asset quality, the trend in risk indicators was positive. The NPL ratio stood at 0.7% as of December 2017, a decline in comparison to the 1.0% as of December 2016. The NPL coverage ratio improved to 103%, up from the figure recorded at the close of December 2016 (79%).
Customer funds increased by 3.2% since December 2016. The increases in the United States, Mexico, Argentina and Colombia offset the fall in Spain, the Rest of Eurasia and Chile.
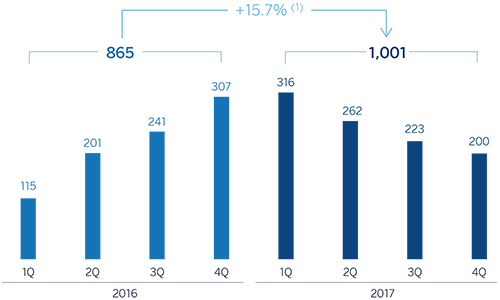
Results
CIB registered a net attributable profit of €1,001m in 2017, up 15.7% on 2016. This was mainly due to stable revenues, contained expenses and a lower level of loan-loss provisions. The highlights of the income statement are summarized below:
-
Slight year-on-year decline of 0.3% in gross income. The fall in net interest income (which was due to lower lending volumes than in 2016, as customer spreads performed positively) was offset thanks to the earnings from management of market volatility, above all in the first quarter of 2017, and the good performance of income from fees and commissions (up 7.7%), basically in Spain.
The corporate finance business in 2017 was characterized by a high level of activity and a significant marketing effort, which has resulted in BBVA winning numerous mandates, strengthening its market position in this business.
The Equity Capital Markets (ECM) unit was very active in the primary equity market throughout the year, with numerous market operations such as block trades and major IPOs, in which BBVA played a key role.
In mergers and acquisitions (M&A), the close of the year demonstrated the consolidation of the growth that began in Spain in 2015, driven by an improving economic situation, greater investment by foreign funds and an improved corporate financial situation. The number of operations in 2017 grew significantly (up 6% on 2016), giving rise to a large volume of both domestic and foreign investment. In particular, the market was very active, especially in the infrastructure and energy sector, despite uncertainties in the short and medium term.
BBVA also continued to demonstrate its leading position in green finance, as one of the most active financial institutions in the green bond and green loan markets. BBVA believes and is committed to this growing financing market, so it is opening up the range of "green and sustainable" financing products for its customers (bonds, loans, credit facilities, project finance, etc.).
-
Cumulative operating expenses declined by 2.2% compared to the same period in 2016. The keys to this figure continued to be a slowdown in the growth of personnel and discretionary expenses, and the increase in costs associated with the investment plan in technology.
-
Lastly, it is worth noting the lower impairment losses on financial assets with respect to 2016 (when there were increased provisions arising from the downgrades in the ratings of some oil & gas companies in the United States, above all during the first three months of the year).
Financial statements and relevant business indicators (Million euros and percentage)
| Income statement | 2017 | ∆% | ∆%(1) | 2016 |
|---|---|---|---|---|
| Net interest income | 1,092 | (17.0) | (15.0) | 1,315 |
| Net fees and commissions | 675 | 5.5 | 7.7 | 640 |
| Net trading income | 793 | 20.2 | 22.2 | 660 |
| Other income/expenses | 112 | (3.8) | (5.3) | 117 |
| Gross income | 2,672 | (2.2) | (0.3) | 2,731 |
| Operating expenses | (992) | (3.7) | (2.2) | (1.031) |
| Personnel expenses | (495) | (6.7) | (5.5) | (530) |
| Other administrative expenses | (390) | (2.7) | (0.6) | (401) |
| Depreciation | (108) | 7.9 | 8.7 | (100) |
| Operating income | 1,680 | (1.2) | 0.9 | 1,701 |
| Impairment on financial assets (net) | (93) | (59.9) | (59.6) | (231) |
| Provisions (net) and other gains (losses) | (42) | (35.0) | (34.4) | (65) |
| Profit/(loss) before tax | 1,545 | 10.0 | 12.8 | 1,405 |
| Income tax | (424) | 4.4 | 7.0 | (406) |
| Profit/(loss) for the year | 1,121 | 12.2 | 15.1 | 999 |
| Non-controlling interests | (120) | 7.8 | 10.3 | (112) |
| Net attributable profit | 1,001 | 12.8 | 15.7 | 888 |
| Balance sheets | 31-12-17 | ∆% | ∆%(1) | 31-12-16 |
|---|---|---|---|---|
| Cash, cash balances at central banks and other demand deposits | 4,193 | 61.3 | 79.0 | 2,600 |
| Financial assets | 72,804 | (11.9) | (10.0) | 82,666 |
| Loans and receivables | 85,061 | (3.3) | 0.6 | 87,988 |
| of which loans and advances to customers | 59,376 | (1.7) | 3.3 | 60,428 |
| Inter-area positions | - | - | - | - |
| Tangible assets | 26 | (26.1) | (20.3) | 35 |
| Other assets | 2,078 | (16.6) | (13.8) | 2,492 |
| Total assets/liabilities and equity | 164,161 | (6.6) | (3.6) | 175,781 |
| Financial liabilities held for trading and designated at fair value through profit or loss | 49,059 | (10.5) | (9.4) | 54,785 |
| Deposits from central banks and credit institutions | 45,400 | 3.9 | 6.2 | 43,705 |
| Deposits from customers | 41,989 | (6.3) | (2.4) | 44,836 |
| Debt certificates | 523 | (8.9) | (7.6) | 574 |
| Inter-area positions | 19,687 | (17.8) | (10.8) | 23,957 |
| Other liabilities | 3,743 | (2.8) | 0.4 | 3,850 |
| Economic capital allocated | 3,760 | (7.7) | (3.0) | 4,074 |
| Relevant business indicators | 31-12-17 | ∆% | ∆%(1) | 31-12-16 |
|---|---|---|---|---|
| Loans and advances to customers (gross)(2) | 49.219 | (10.8) | (5.7) | 55,160 |
| Non-performing loans and contingent liabilities | 582 | (27.9) | (23.0) | 808 |
| Customer deposits under management (2) | 36,729 | (2.4) | 2.3 | 37,616 |
| Off-balance sheet funds (3) | 1,357 | 17.3 | 34.1 | 1,157 |
| Efficiency ratio (%) | 37.1 | 37.7 | ||
| NPL ratio (%) | 0.7 | 1.0 | ||
| NPL coverage ratio (%) | 103 | 79 | ||
| Cost of risk (%) | 0.16 | 0.12 |
- (1) Figures at constant exchange rates.
- (2) Excluding repos.
- (3) Includes mutual funds, pension funds and other off-balance-sheet funds.