
Other information: Corporate & Investment Banking
Highlights
- Slowdown in lending activity and growth in customer funds in the quarter
- Favorable evolution of recurrent revenues and excellent NTI performance
- Improvement in efficiency
- Outstanding performance of net attributable profit
Business activity (1)
(VARIATION AT CONSTANT EXCHANGE RATES COMPARED TO
31-12-22)
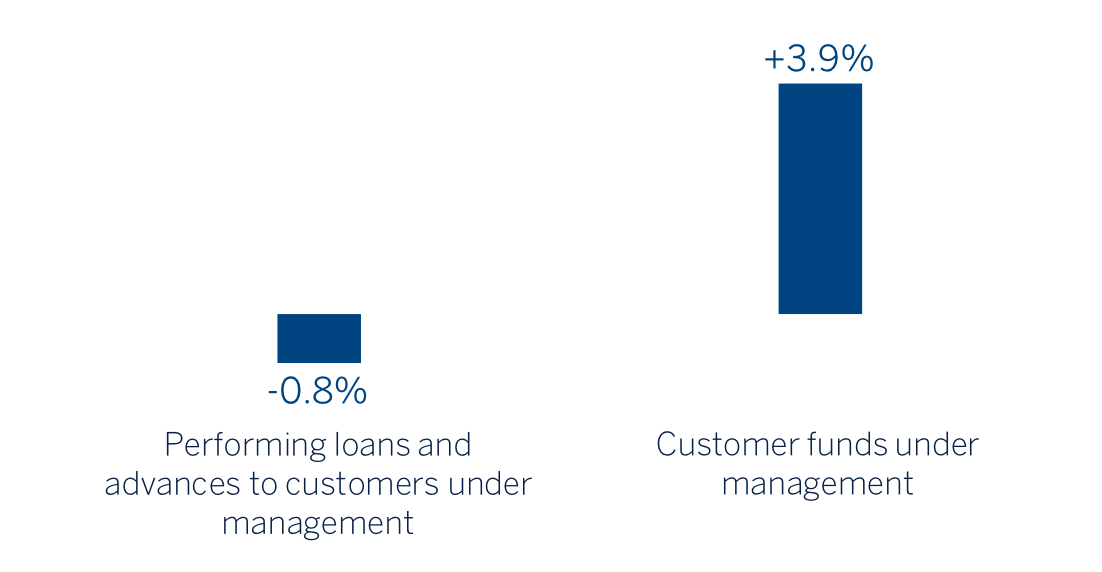
(1) Excluding repos.
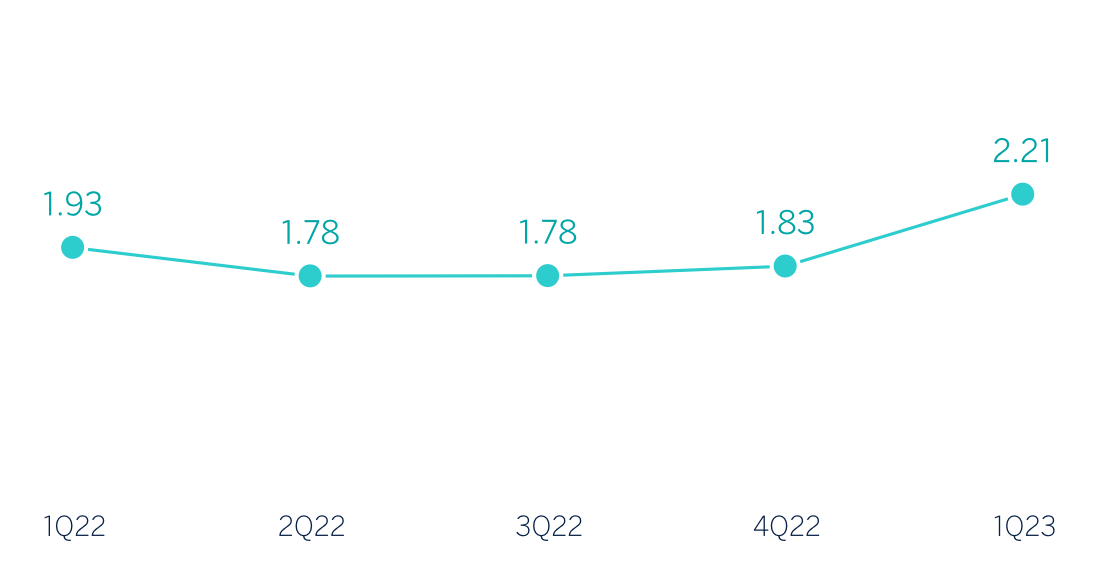
Gross income / AVERAGE TOTAL ASSETS
(Percentage. Constant exchange rates)
Operating income
(Millions of euros at constant exchange rates)
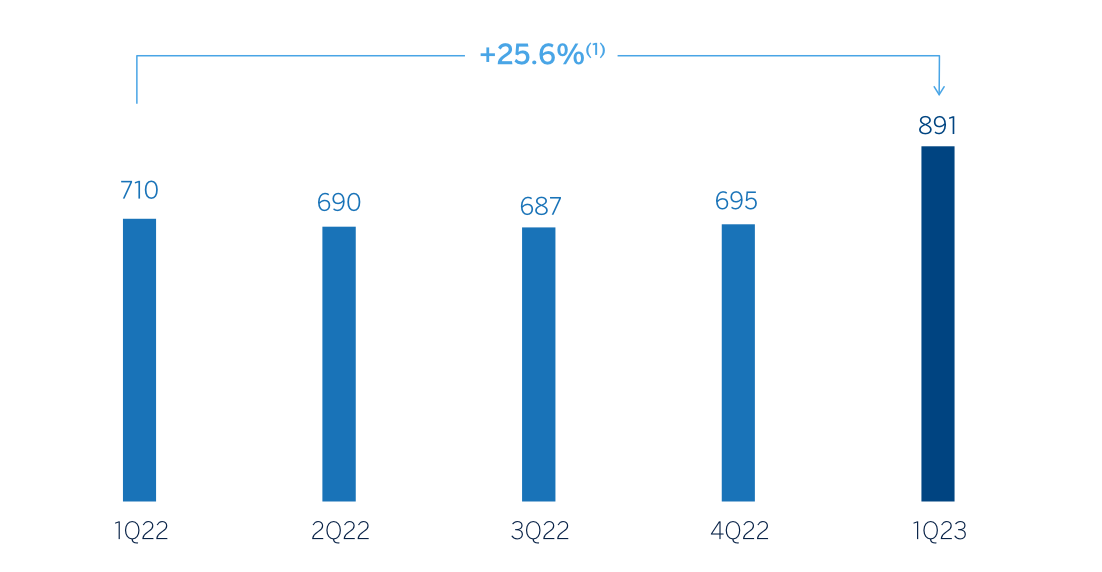
(1) At current exchange rates: +20.6%.
Net attributable profit (LOSS)
(Millions of euros at constant exchange rates)
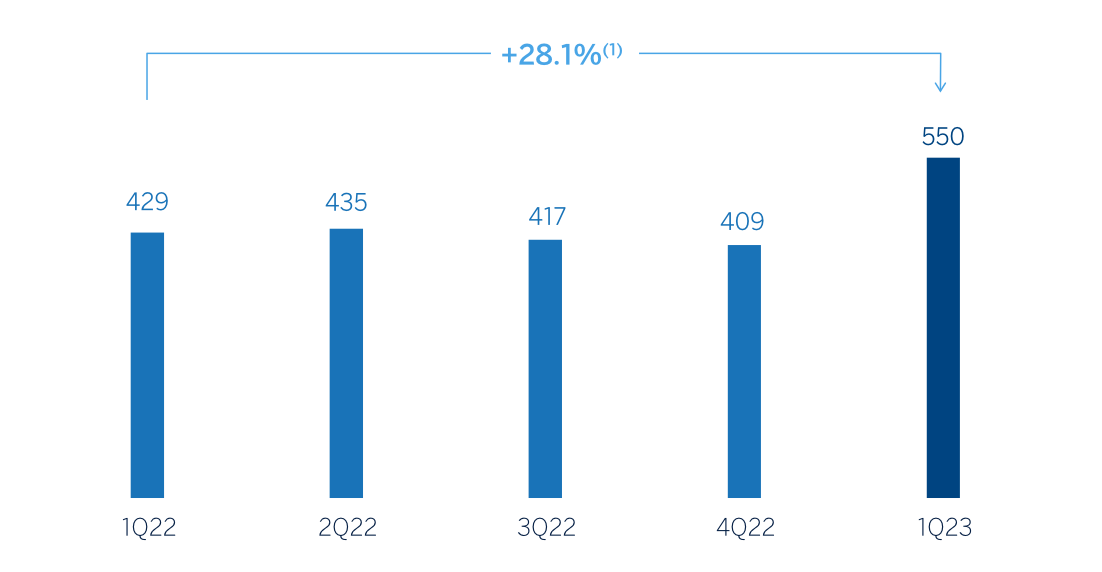
(1) At current exchange rates: +26.4%.
Financial statements and relevant business indicators (Millions of euros and percentage)
| Income statement | 1Q23 (1) | ∆% | ∆% (2) | 1Q22 |
|---|---|---|---|---|
| Net interest income | 516 | 11.6 | 13.2 | 463 |
| Net fees and commissions | 276 | 39.3 | 40.4 | 198 |
| Net trading income | 431 | 25.3 | 34.4 | 344 |
| Other operating income and expenses | (28) | 250.0 | 245.8 | (8) |
| Gross income | 1.195 | 19.9 | 23.8 | 997 |
| Operating expenses | (304) | 17.9 | 19.0 | (258) |
| Personnel expenses | (143) | 19.4 | 19.3 | (120) |
| Other administrative expenses | (136) | 20.4 | 23.5 | (113) |
| Depreciation | (26) | — | (1.8) | (26) |
| Operating income | 891 | 20.6 | 25.6 | 739 |
| Impairment on financial assets not measured at fair value through profit or loss | (44) | 113.7 | 99.5 | (20) |
| Provisions or reversal of provisions and other results | 15 | (19.7) | (19.8) | 19 |
| Profit (loss) before tax | 862 | 17.0 | 22.1 | 737 |
| Income tax | (239) | 14.8 | 20.0 | (208) |
| Profit (loss) for the period | 623 | 17.8 | 22.9 | 528 |
| Non-controlling interests | (73) | (21.8) | (5.9) | (94) |
| Net attributable profit (loss) | 550 | 26.4 | 28.1 | 435 |
| Balance sheets | 31-03-23 | ∆% | ∆% (2) | 31-12-22 |
|---|---|---|---|---|
| Cash, cash balances at central banks and other demand deposits | 4,820 | (12.7) | (11.9) | 5,524 |
| Financial assets designated at fair value | 130,792 | 10.9 | 10.3 | 117,958 |
| Of which: Loans and advances | 53,662 | 18.3 | 18.4 | 45,360 |
| Financial assets at amortized cost | 90,375 | 1.0 | 0.7 | 89,440 |
| Of which: Loans and advances to customers | 76,859 | (0.5) | (0.8) | 77,208 |
| Inter-area positions | — | — | — | — |
| Tangible assets | 54 | 4.8 | 3.9 | 52 |
| Other assets | 1,919 | 122.6 | 157.8 | 862 |
| Total assets/liabilities and equity | 227,960 | 6.6 | 6.2 | 213,836 |
| Financial liabilities held for trading and designated at fair value through profit or loss | 105,432 | 6.7 | 6.2 | 98,790 |
| Deposits from central banks and credit institutions | 25,158 | 19.9 | 19.6 | 20,987 |
| Deposits from customers | 53,258 | 10.5 | 10.0 | 48,180 |
| Debt certificates | 5,831 | 10.2 | 9.5 | 5,292 |
| Inter-area positions | 21,979 | (14.2) | (14.4) | 25,609 |
| Other liabilities | 5,539 | 34.3 | 30.5 | 4,124 |
| Regulatory capital allocated | 10,762 | (0.9) | 0.6 | 10,855 |
| Relevant business indicators | 31-03-23 | ∆% | ∆% (2) | 31-12-22 |
|---|---|---|---|---|
| Performing loans and advances to customers under management (3) | 76,884 | (0.5) | (0.8) | 77,291 |
| Non-performing loans | 817 | 8.4 | 11.6 | 753 |
| Customer deposits under management (3) | 48.069 | 1.7 | 1.2 | 47,270 |
| Off-balance sheet funds (4) | 3.009 | 71.9 | 84.0 | 1,750 |
| Efficiency ratio (%) | 25.5 | 28,5 |
- (1) For the translation of the income statement in those countries where hyperinflation accounting is applied, the punctual exchange rate as of March 31, 2023 is used.
- (2) At constant exchange rates.
- (3) Excluding repos.
- (4) Includes mutual funds, customer portfolios and other off-balance sheet funds.
Unless expressly stated otherwise, all the comments below on rates of change, for both activity and results, will be given at constant exchange rates. For the conversion of these figures in those countries in which accounting for hyperinflation is applied, the punctual exchange rate as of March 31, 2023 is used. These rates, together with changes at current exchange rates, can be found in the attached tables of financial statements and relevant business indicators.
Activity
The most relevant aspects related to the area's activity in the first quarter of 2023 were:
- Lending activity (performing loans under management) slowed down by -0.8% since December 2022, as a result of the volume of new operations and renewals which did not offset the quarter's maturities, due to an environment of excess liquidity that makes it difficult to maintain the volumes of previous quarters, especially in transactional banking (Global Transactional Banking). Of note by products was the evolution of Investment Banking & Finance and by geographic areas, particularly the increase in the New York branch's operations.
- Customer funds continued to grow compared to December (+3.9%) but in a less dynamic way compared to previous quarters as a result of lower lending activity, maintaining the positive trend in price management.
Results
CIB generated a net attributable profit of €550m in the first quarter of 2023. These results, which do not include the application of hyperinflation accounting, represent an increase of 28.1% on a year-on-year basis, due to the growth in recurring income and NTI, which comfortably offset the higher expenses and provisions for impairment on financial assets, highlighting the contribution of Global Transactional Banking.
The contribution by business areas, excluding the Corporate Center, to CIB's accumulated net attributable profit at the end of March 2023 was as follows: 19% Spain, 26% Mexico, 25% Turkey, 16% South America and 15% Rest of Business.
The most relevant aspects of the year-on-year evolution in the income statement of this aggregate are summarized below:
- Net interest income was 13.2% higher than in the same period last year, due to the good year-on-year performance of the business, mainly in Global Transactional Banking and the positive trend in price management.
- Net fees and commissions grew by 40.4%, with positive evolution of all business lines, especially in Global Markets, benefited from an increase in operations in the primary debt market and Global Transactional Banking, particularly in Mexico due to commissions linked to collections, payments and liquidity. By geographical areas, all had a favorable evolution with double-digit growth. By geographic area, all had a favorable evolution with double-digit growth.
- Excellent NTI performance (+34.4%), mainly due to the performance of the Global Markets unit driven by the income generated by the volatility of the markets, as well as the intraday trading of currency positions. As for the geographical areas, all except Spain grew at double digits.
- Operating expenses increased by 19.0%, with higher personnel expenses, partly due to measures taken by the Group to compensate for the loss in purchasing power of the workforce. For its part, general expenses continued to be affected by the current inflationary environment. Despite the aforementioned, the efficiency ratio stood at 25.5%, which is an improvement over the same period last year.
- Higher level of provisions for impairment on financial assets, with higher loan loss-provisions in Turkey and, to a lesser extent, in Europe.