Group information
Relevant events
Results
- Good performance of gross income, thanks to a positive trend in more recurring revenue (particularly income from fees and commissions) and net trading income (NTI).
- Operating expenses under control.
- This has led to a further improvement in the efficiency ratio.
- Impairment losses on financial assets slightly below the figure for the first quarter of 2016.
- Inclusion of €177m restructuring costs inprovisions.
- As a result, the net attributable profit in the first quarter of 2017 was €1,199m, 69.0% higher than in the same quarter last year and 76.8% higher than posted in the fourth quarter of 2016.
Net attributable profit (Million euros)

Net attributable profit breakdown (1) (Percentage. 1Q 2017)

(1) Excludes the Corporate Center.
(2) Includes the areas Banking activity in Spain and Non Core Real Estate.
Balance sheet and business activity
- Loans and advances to customers (gross) remain strong in emerging economies but have declined in Spain and the United States.
- Non-performing loans continue to improve, particularly in the areas of Non Core Real Estate and the United States.
- Deposits from customers have performed particularly well in the more liquid and lower-cost items.
- Finally, renewed growth over the quarter of off-balance sheet customer funds.
Solvency
- The capital position is above regulatory requirements, with a fully-loaded CET1 ratio of 11.0% as of 31-Mar-2017. Recurring generation of earnings and the positive effect of the evolution of the markets in the period have offset the combined impact of a negative 13 basis points stemming from operations carried-out in the quarter (increased stake in Garanti and sale of the 1.7% stake in China Citic Bank -CNCB-).
- The fully-loaded leverage ratio of 6.6% still compares very favorably with the rest of the peer group.
Capital and leverage ratios (Percentage as of 31-03-17)

Risk management
- Positive trends also of the metrics related to credit-risk management. As of 31-Mar-2017, the NPL ratio has declined and the coverage ratio has increased slightly on the figures for the close of 2016. The cost of risk is stable.
NPL and coverage ratios (Percentage)

Other matters of interest
- In March 2017, BBVA completed the acquisition of an additional 9.95% stake in the share capital of Turkiye Garanti Bankasi, A.S. (hereinafter Garanti), increasing BBVA’s current total stake in Garanti to 49.85%.
- There was a new bonus share issue in April to implement what will be the last “dividend option”. On this occasion, the holders of 83.28% of free allotment rights opted to receive new shares.
Transformation
- The Group’s digital and mobile customer base continues to increase (up 20% and 41% year-on-year, respectively, according to the latest available data as of February 2017). Digital sales are also up in all the geographic areas where BBVA operates.
Digital and mobile costumers (Millions)

Results
In the first quarter of 2017, BBVA has generated a net attributable profit of €1,199m, a significant increase in both year-on-year and quarterly terms. This positive trend is explained by the continued good performance of more recurring revenue, particularly income from fees and commissions, and NTI; as well as the reduction in operating expenses and containment of impairment losses on financial assets, although €177m for restructuring costs have been allocated under the heading of provisions.
Consolidated income statement: quarterly evolution (Million euros)
| 2017 | 2016 | ||||
|---|---|---|---|---|---|
| 1Q | 4Q | 3Q | 2Q | 1Q | |
| Net interest income | 4,322 | 4,385 | 4,310 | 4,213 | 4,152 |
| Net fees and commissions | 1,223 | 1,161 | 1,207 | 1,189 | 1,161 |
| Net trading income | 691 | 379 | 577 | 819 | 357 |
| Dividend income | 43 | 131 | 35 | 257 | 45 |
| Share of profit or loss of entities accounted for using the equity method | (5) | 7 | 17 | (6) | 7 |
| Other operating income and expenses | 108 | 159 | 52 | (26) | 66 |
| Gross income | 6,383 | 6,222 | 6,198 | 6,445 | 5,788 |
| Operating expenses | (3,137) | (3,243) | (3,216) | (3,159) | (3,174) |
| Personnel expenses | (1,647) | (1,698) | (1,700) | (1,655) | (1,669) |
| Other administrative expenses | (1,136) | (1,180) | (1,144) | (1,158) | (1,161) |
| Depreciation | (354) | (365) | (372) | (345) | (344) |
| Operating income | 3,246 | 2,980 | 2,982 | 3,287 | 2,614 |
| Impairment on financial assets (net) | (945) | (687) | (1,004) | (1,077) | (1,033) |
| Provisions (net) | (170) | (723) | (201) | (81) | (181) |
| Other gains (losses) | (66) | (284) | (61) | (75) | (62) |
| Profit/(loss) before tax | 2,065 | 1,285 | 1,716 | 2,053 | 1,338 |
| Income tax | (573) | (314) | (465) | (557) | (362) |
| Profit/(loss) for the year | 1,492 | 971 | 1,251 | 1,496 | 976 |
| Non-controlling interests | (293) | (293) | (286) | (373) | (266) |
| Net attributable profit | 1,199 | 678 | 965 | 1,123 | 709 |
| Earning per share (euros) (1) | 0.17 | 0.09 | 0.13 | 0.16 | 0.10 |
- (1) Adjusted by additional Tier 1 instrument remuneration.
Unless expressly indicated otherwise, to better understand the changes in the main headings of the Group’s income statement, the year-on-year percentage changes given below refer to constant exchange rates.
Consolidated income statement (Million euros)
| 1Q17 | ∆% | ∆% at constant exchange rates | 1Q16 | |
|---|---|---|---|---|
| Net interest income | 4,322 | 4.1 | 9.2 | 4,152 |
| Net fees and commissions | 1,223 | 5.4 | 9.4 | 1,161 |
| Net trading income | 691 | 93.5 | 110.2 | 357 |
| Dividend income | 43 | (3.5) | (3.6) | 45 |
| Share of profit or loss of entities accounted for using the equity method | (5) | n.m. | n.m. | 7 |
| Other operating income and expenses | 108 | 62.3 | 14.7 | 66 |
| Gross income | 6,383 | 10.3 | 15.0 | 5,788 |
| Operating expenses | (3,137) | (1.2) | 1.8 | (3,174) |
| Personnel expenses | (1,647) | (1.3) | 1.1 | (1,669) |
| Other administrative expenses | (1,136) | (2.2) | 1.3 | (1.,61) |
| Depreciation | (354) | 2.9 | 6.4 | (344) |
| Operating income | 3,246 | 24.2 | 31.5 | 2,614 |
| Impairment on financial assets (net) | (945) | (8.6) | (5.1) | (1,033) |
| Provisions (net) | (170) | (6.0) | (3.6) | (181) |
| Other gains (losses) | (66) | 6.9 | 3.0 | (62) |
| Profit/(loss) before tax | 2,065 | 54.3 | 67.6 | 1,338 |
| Income tax | (573) | 58.2 | 77.7 | (362) |
| Profit/(loss) for the year | 1,492 | 52.9 | 64.0 | 976 |
| Non-controlling interests | (293) | 9.8 | 21.5 | (266) |
| Net attributable profit | 1,199 | 69.0 | 79.2 | 709 |
| Earning per share (euros) (1) | 0.17 | 0.10 |
- (1) Adjusted by additional Tier 1 instrument remuneration.
Gross income
Cumulative gross income has grown at a double-digit rate in year-on-year terms, thanks to the positive figures from practically all the revenue headings, basically the more recurring items and NTI.
Gross income (Million euros)

(1) At constant exchange rates: +15.0%.
Net interest income has posted a very similar figure to the fourth quarter of 2016 (up 0.1%), so in year-on-year terms growth has been 9.2%. Once more this quarter, the trend can be explained by the growth in activity in emerging economies and good management of customer spreads. By business areas, it is worth noting the outstanding performance of Turkey (up 27.0% year-on-year) and the positive trends in Mexico (up 8.4%), the United States (up 8.2%), South America (up 8.3%) and the Rest of Eurasia (up 10.5%). Banking activity in Spain has declined for the reasons explained in the fourth quarter of 2016, as a result of the current environment of very low interest rates and lower business volumes.
Net interest income/ATA (Percentage)

Income from fees and commissions has performed very favorably, both in the last twelve months and over the quarter, largely due to the recovery in the Group’s wholesale business activity.
As a result, more recurring revenue (net interest income plus fees and commissions) has increased year-on-year by 9.2%, or 1.4% over the quarter.
Net interest income plus fees and commissions (Million euros)

(1) At constant exchange rates: +9.2%.
The contribution from NTI has been very positive. The performance of the Global Markets unit was outstanding, thanks to the good management of market volatility and the positive trend in activity with customers. Also worth noting are capital gains of €204m before tax (€174m after tax) from the sale on the market of 1.7% of CNCB.
The dividends line item has grown in line with the first quarter of 2016 (the fourth quarter included the dividend payment from Telefónica).
Finally, the other operating income and expenses have risen by 14.7% in year-on-year terms and 10.0% over the quarter. The insurance business performed outstandingly (up 6.7% year-on-year). Although compared with fourth quarter, earnings from this activity have declined by 19.7%, the fall is mainly due to the positive effect of the release of reserves in Mexico in the fourth quarter of 2016 as a result of the regulatory change governing the sector with respect to their calculation, as both new contract and claims rates have clearly improved in the first three months of 2017.
Operating income
Operating expenses slowed their increase to 1.8% year-on-year, falling over the quarter by 2.2%. The above is due to the cost discipline implemented in all the areas of the Group through efficiency plans that are beginning to deliver results, and the materialization of some synergies (such as for example those resulting from the integration of Catalunya Banc –CX-).
Operating expenses (Million euros)

(1) At constant exchange rates: +1.8%.
Breakdown of operating expenses and efficiency calculation (Million euros)
| 1Q17 | ∆% | 1Q16 | |
|---|---|---|---|
| Personnel expenses | 1,647 | (1.3) | 1,669 |
| Wages and salaries | 1,282 | (0.8) | 1,293 |
| Employee welfare expenses | 243 | (0.7) | 245 |
| Training expenses and other | 122 | (7.3) | 131 |
| Other administrative expenses | 1,136 | (2.2) | 1,161 |
| Property. fixtures and materials | 265 | (3.9) | 276 |
| IT | 242 | 3.8 | 233 |
| Communications | 75 | (3.7) | 78 |
| Advertising and publicity | 90 | (6.7) | 97 |
| Corporate expenses | 22 | (8.2) | 24 |
| Other expenses | 315 | (2.4) | 323 |
| Levies and taxes | 126 | (3.1) | 130 |
| Administration costs | 2,783 | (1.7) | 2,830 |
| Depreciation | 354 | 2.9 | 344 |
| Operating expenses | 3,137 | (1.2) | 3,174 |
| Gross income | 6,383 | 10.3 | 5,788 |
| Efficiency ratio (operating expenses/gross income; %) | 49.1 | 54.8 |
The Group’s workforce decreased over the last twelve months by 3.2%, with reductions across practically all the geographical areas, particularly in Spain and to a lesser extent the United States and Mexico. There has also been a fall in the number of branches, focused again in Spain (around 130 branches were closed in February 2017). However, there has been a slight increase in ATMs, particularly in emerging geographical areas.
Number of employees

Number of ATMs

Number of branches

As a result of the above, the efficiency ratio has improved, both on the first quarter of last year and 2016 as a whole. Operating income has grown by 31.5% in the last twelve months and 9.9% on the fourth quarter of 2016.
Efficiency (Million euros) and efficiency ratio (Percentage)

Operating income (Million euros)

(1) At constant exchange rates: +31.5%.
Provisions and others
Impairment losses on financial assets amounted to €945m, below the figure for the first three months of last year. By areas, there was a year-on-year decline in Spain, where loan provisioning requirements reduced, and the United States, as the same period last year included extraordinary provisions following the rating downgrades of some companies in the energy and metals & mining sectors. In contrast, Turkey, Mexico and South America have seen increases over the last twelve months, largely linked to the increase in lending activity, and to a lesser extent, to regulatory changes in some geographical areas (Colombia) and the impact of increased requirements for insolvency provisions asociated with some customers.
Impairment on financial assests (net) (Million euros)

(1) At constant exchange rates: -5.1%.
Provisions (net) and other gains (losses) have fallen by 1.8% in year-on-year terms and 76.2% over the quarter. They include a charge of €177m for restructuring costs in the first quarter of 2017, basically affecting banking activity in Spain, the area where increasing efficiency is a priority focus. The fourth quarter of 2016 included €577m (€404m after tax) to cover the contingency linked to judgment by the Court of Justice of the European Union (CJEU) on “mortgage floor clauses”.
Profit
As a result of the above, the growth of the Group’s net attributable profit has been very positive, both over the quarter (up 81.4%) and in the last twelve months (up 79.2%). It is important to note that since March 2017 this figure has included the additional stake of 9.95% in the capital of Garanti, which has made a positive impact of €11m on non-controlling interests.
By business area, banking activity in Spain has generated €375m, Non Core Real Estate generated a loss of €109m, United States contributed €134m, Turkey €160m, Mexico €536m, South America €185m and the Rest of Eurasia €40m.
Net attributable profit (Million euros)

(1) At constant exchange rates: +79.2%.
Earnings per share (1) (Euros)

(1) Adjusted by additional Tier 1 instrument remuneration.
ROE and ROTE (1) (Percentage)

(1) The ROE and ROTE ratios include in the denominator the Group’s average shareholders’ funds, but do not take into account the caption within total equity named “Accumulated other comprehensive income” with an average balance of -€4.120m in 1Q 2016, -€4.492m in 2016 and -€5,743 in 1Q 2017.
ROA and RORWA (Percentage)

Balance sheet and business activity
The most notable factors behind BBVA Group’s key balance sheet and activity figures over the quarter are:
- A slight rise in loans and advances to customers (gross) as a result of the increase in credit volumes in emerging economies. In Spain, the trend remains the same as that seen in previous periods: deleveraging, despite the continued good performance of new production, chiefly due to more sluggish activity with institutions, increased repayments in the mortgage portfolio and a sustained decline of non-performing balances. In the United States, selective growth in the portfolios considered more profitable (basically loans to businesses and some consumer finance segments) is leading to a slight decline in overall lending activity.
- Non-performing loans have continued the decline registered in previous quarters, particularly in Non Core Real Estate and the United States.
- The Group’s deposits from customers closed March 0.7% down on the figure as of 31-Dec-2016, strongly impacted by the decline in repos and other deposits, and to a lesser extent time deposits. In contrast, there has been a general rise in lower-cost items, such as current and savings accounts.
- Off-balance sheet funds have continued to rise over the quarter, strongly focused on mutual funds and investment companies.
Consolidated balance sheet (Million euros)
| 31-03-17 | ∆% | 31-12-16 | 31-03-16 | |
|---|---|---|---|---|
| Cash, cash balances at central banks and other demand deposits | 29,214 | (27.0) | 40,039 | 23,554 |
| Financial assets held for trading | 74,898 | (0.1) | 74,950 | 81,706 |
| Other financial assets designated at fair value through profit or loss | 2,274 | 10.3 | 2,062 | 2,281 |
| Available-for-sale financial assets | 78,846 | (0.5) | 79,221 | 92,476 |
| Loans and receivables | 465,304 | (0.1) | 465,977 | 469,086 |
| Loans and advances to central banks and credit institutions | 37,654 | (6.5) | 40,268 | 47,322 |
| Loans and advances to customers | 416,038 | 0.4 | 414,500 | 410,458 |
| Debt securities | 11,562 | 3.2 | 11,209 | 11,306 |
| Held-to-maturity investments | 16,712 | (5.6) | 17,696 | 17,504 |
| Investments in subsidiaries, joint ventures and associates | 1,152 | 50.6 | 765 | 1,179 |
| Tangible assets | 8,940 | (0.0) | 8,941 | 9,697 |
| Intangible assets | 9,561 | (2.3) | 9,786 | 9,858 |
| Other assets | 32,293 | (0.4) | 32,418 | 33,607 |
| Total assets | 719,193 | (1.7) | 731,856 | 740,947 |
| Financial liabilities held for trading | 51,179 | (6.4) | 54,675 | 55,107 |
| Other financial liabilities designated at fair value through profit or loss | 2,522 | 7.9 | 2,338 | 2,600 |
| Financial liabilities at amortized cost | 580,031 | (1.6) | 589,210 | 597,709 |
| Deposits from central banks and credit institutions | 94,376 | (3.9) | 98,241 | 100,395 |
| Deposits from customers | 398,499 | (0.7) | 401,465 | 409,208 |
| Debt certificates | 72,840 | (4.6) | 76,375 | 74,834 |
| Other financial liabilities | 14,315 | 9.0 | 13,129 | 13,272 |
| Liabilities under insurance contracts | 9,657 | 5.7 | 9,139 | 9,379 |
| Other liabilities | 20,886 | (0.9) | 21,066 | 21,637 |
| Total liabilities | 664,275 | (1.8) | 676,428 | 686,431 |
| Non-controlling interests | 6,874 | (14.8) | 8,064 | 8,132 |
| Accumulated other comprehensive income | (5,144) | (5.8) | (5,458) | (4,171) |
| Shareholders’ funds | 53,188 | 0.7 | 52,821 | 50,555 |
| Total equity | 54,918 | (0.9) | 55,428 | 54,516 |
| Total equity and liabilities | 719,193 | (1.7) | 731,856 | 740,947 |
| Memorandum item: | ||||
| Guarantees given | 48,548 | (3.9) | 50,540 | 50,147 |
Loans and advances to customers (gross)
(Billion euros)

(1) At constant exchange rates: +0.1%.
Customer funds
(Billion euros)

(1) At constant exchange rates: -0.5%.
Loans and advances to customers
(Million euros)
| 31-03-17 | ∆% | 31-12-16 | 31-03-16 | |
|---|---|---|---|---|
| Public sector | 27,787 | 1.0 | 27,506 | 30,058 |
| Individuals | 173,167 | 0.4 | 172,476 | 172,194 |
| Mortgages | 121,483 | (0.8) | 122,439 | 123,811 |
| Consumer | 36,879 | 4.8 | 35,195 | 33,873 |
| Credit cards | 14,805 | (0.2) | 14,842 | 14,510 |
| Business | 189,699 | (0.0) | 189,733 | 185,377 |
| Business retail | 24,843 | 2.1 | 24,343 | 23,903 |
| Other business | 164,856 | (0.3) | 165,391 | 161,473 |
| Other loans | 18,674 | 4.7 | 17,844 | 16,060 |
| Non-performing loans | 22,572 | (1.5) | 22,915 | 24,826 |
| Loans and advances to customers (gross) |
431,899 | 0.3 | 430,474 | 428,515 |
| Loan-loss provisions | (15,811) | (1.0) | (15,974) | (18,057) |
| Loans and advances to customers |
416,088 | 0.4 | 414,500 | 410,458 |
| Memorandum item: | ||||
| Secured loans | 201,991 | 0.1 | 201,772 | 201,318 |
Customer funds
(Million euros)
| 31-03-17 | Δ% | 31-12-16 | 31-03-16 | |
|---|---|---|---|---|
| Deposits from customers | 398,499 | (0.7) | 401,465 | 409,208 |
| Demand deposits | 240,581 | 3.9 | 231,638 | 215,597 |
| Time deposits | 135,970 | (5.8) | 144,407 | 158,441 |
| Assets sold under repurchase agreement | 9,738 | (11.9) | 11,056 | 21,047 |
| Other deposits | 12,211 | (15.0) | 14,364 | 14,122 |
| Other customer funds | 135,290 | 2.4 | 132,092 | 131,072 |
| Mutual funds and investment companies | 58,780 | 6.8 | 55,037 | 53,147 |
| Pension funds | 33,479 | 0.2 | 33,418 | 31,410 |
| Other off-balance sheet funds | 2,952 | 4.3 | 2,831 | 3,611 |
| Customer portfolios | 40,078 | (1.8) | 40,805 | 42,093 |
| Total customer funds | 533,789 | 0.0 | 533,557 | 540,280 |
Solvency
Capital base
BBVA Group had a fully-loaded CET1 ratio of 11.0% at the close of March 2017. Key to the quarter has been the recurring generation of earnings and the positive impact of the markets.
The ratio is affected by transactions carried out during the quarter, in particular the acquisition of an additional 9.95% stake in Garanti and the sale of 1.7% in CNCB. Both transactions have had a joint negative impact on this ratio of 13 basis points.
There has been a slight increase in risk-weighted assets (RWAs) in the first quarter compared with the figure for December 2016. The decline in RWAs coming from the CNCB disposal does not fully offset the growth of activity in the emerging geographical areas.
There have been four subordinate capital issues in the quarter eligible under the CRD-IV capital regulations as Tier 2, in both phased-in and fully-loaded terms, with an approximate impact of 34 basis points of capital.
Due to these factors, combined with the other impacts on CET1, the phased-in ratio stands at 11.6%. As of January 1, 2017, the ratio has been affected by the European solvency regulations, i.e. the gradual transition period for some items, the most relevant being the deductions for goodwill and intangible assets, which since 2014 have increased by 20% every January 1, and will be fully deductible on January 1, 2018. These deductions have been partially offset by the increases in the calculation of other items (such as capital gains on available-for-sale portfolios). The Tier 1 ratio ended the quarter at 12.8% and the Tier 2 ratio at 2.4%, giving a total capital ratio of 15.3%. These levels are above the requirements established by the ECB in its SREP letter and the systemic buffers applicable to BBVA Group for 2017 (7.625% for the phased-in CET1 ratio and 11.125% for the total capital ratio).
The Group maintains a robust leverage ratio: 6.6% under fully-loaded criteria (6.8% phased-in), which compares very favorably with the rest of its peer group.
Evolution of fully-loaded capital ratios (Percentage)

Capital base (1) Million euros
| CRD IV phased-in (1) | CRD IV fully-loaded | |||||
|---|---|---|---|---|---|---|
| 31-03-2017 (2) | 31-12-16 | 31-03-16 | 31-03-2017 (2) | 31-12-16 | 31-03-16 | |
| Common Equity Tier 1 (CET 1) | 45,364 | 47,370 | 46,471 | 42,893 | 42,398 | 42,007 |
| Tier 1 | 50,034 | 50,083 | 48,272 | 48,816 | 48,459 | 47,004 |
| Tier 2 | 9,397 | 8,810 | 11,566 | 9,653 | 8,739 | 11,643 |
| Total Capital (Tier 1 + Tier 2) | 59,431 | 58,893 | 59,838 | 58,469 | 57,198 | 58,647 |
| Risk-weighted assets | 389,696 | 388,951 | 399,270 | 389,696 | 388,951 | 398,826 |
| CET1 (%) | 11.6 | 12.2 | 11.6 | 11.0 | 10.9 | 10.5 |
| Tier 1 (%) | 12.8 | 12.9 | 12.1 | 12.5 | 12.5 | 11.8 |
| Tier 2 (%) | 2.4 | 2.3 | 2.9 | 2.5 | 2.2 | 2.9 |
| Total capital ratio (%) | 15.3 | 15.1 | 15.0 | 15.0 | 14.7 | 14.7 |
- (1) The capital ratios are calculated under CRD IV from Basel III regulation, applying a 80% phase-in for 2017 and a 60% for 2016.
- (2) Preliminary data.
Ratings
On April 3, 2017, Standard & Poors (S&P) improved its utlook for BBVA to positive from stable as a result of a similar improvement in Spain’s sovereign rating outlook (on March 31), with both ratings remaining at BBB+. The rest of the credit rating agencies have not changed either BBVA’s rating or its outlook.
Ratings
| Rating agency | Long term | Short term | Outlook |
|---|---|---|---|
| DBRS | A | R-1 (low) | Stable |
| Fitch | A- | F-2 | Stable |
| Moody’s (1) | Baa1 | P-2 | Stable |
| Scope Ratings | A | S-1 | Stable |
| Standard & Poor’s | BBB+ | A-2 | Positive |
- (1) Additionally, Moody’s assigns an A3 rating to BBVA’s long term deposits.
Risk management
Credit risk
In the first quarter of 2017 BBVA Group has maintained the positive trend in the metrics related to credit risk management:
- Credit risk has remained flat over the quarter. At constant exchange rates, there was a year-on-year decline of 0.1%. Highlights: deleveraging in Spain, South America, the United States and Turkey (in the latter case due to the exchange-rate effect); and growth in Mexico.
- Non-performing loans have declined again with respect to the close of 2016. The balance has fallen by 1.5% in the last three months. There have been good figures in practically all geographical areas, with Non Core Real- Estate (down 7.7%) and the United States (down 13.5%) being mainly responsible for the reduction. In contrast, there has been a rise in South America of 13.2%, strongly influenced by the current economic situation.
- The Group’s NPL ratio continues to improve (down 7 basis point over the last three months and down 49 basis points on the figure for 31-Mar-2016), to 4.8% as of the close of the quarter.
- Loan-loss provisions have fallen slightly by 1.1% on the figure at the close of December 2016 (down 1.3% excluding the exchange-rate effect), due to declines in all the geographical areas except for South America (up 5.7%) and Mexico (up 9.4%).
- The coverage ratio stands at 71%.
- Finally, the cumulative cost of risk through March is 0.90%.
Non-performing loans (Million euros)

Credit risks (1) (Million euros)
| 31-03-17 | 31-12-16 | 30-09-16 | 30-06-16 | 31-03-16 | |
|---|---|---|---|---|---|
| Non-performing loans and guarantees given | 23,236 | 23,595 | 24,253 | 24,834 | 25,473 |
| Credit risks | 480,517 | 480,720 | 472,521 | 483,169 | 478,429 |
| Provisions | 16,385 | 16,573 | 17,397 | 18,264 | 18,740 |
| NPL ratio (%) | 4.8 | 4.9 | 5.1 | 5.1 | 5.3 |
| NPL coverage ratio (%) | 71 | 70 | 72 | 74 | 74 |
- (1) Include gross loans and advances to customers plus guarantees given.
Non-performing loans evolution (Million euros)
| 1Q 17 | 4Q 2016 | 3Q 2016 | 2Q 2016 | 1Q 2016 | |
|---|---|---|---|---|---|
| Beginning balance | 23,595 | 24,253 | 24,834 | 25,473 | 25,996 |
| Entries | 2,490 | 3,000 | 2,588 | 2,947 | 2,421 |
| Recoveries | (1,698) | (2,141) | (1,784) | (2,189) | (1,519) |
| Net variation | 792 | 859 | 804 | 758 | 902 |
| Write-offs | (1,141) | (1,403) | (1,220) | (1,537) | (1,432) |
| Exchange rate differences and other | (9) | (115) | (165) | 140 | 6 |
| Period-end balance | 23,236 | 23,595 | 24,253 | 24,834 | 25,473 |
| Memorandum item: | |||||
| Non-performing loans | 22,572 | 22,915 | 23,589 | 24,212 | 24,826 |
| Non-performing guarantees given | 664 | 680 | 665 | 622 | 647 |
Structural risks
Liquidity and funding
Management of liquidity and funding aims to finance the recurring growth of the banking business at suitable maturities and costs, using a wide range of instruments that provide access to a large number of alternative sources of finance, always in compliance with current regulatory requirements.
A core principle in BBVA’s management of the Group’s liquidity and funding is the financial independence of its banking subsidiaries abroad. This principle prevents the propagation of a liquidity crisis among the Group’s different areas and ensures that the cost of liquidity is correctly reflected in the price formation process.
In the first quarter of 2017 liquidity and funding conditions have remained comfortable across BBVA Group’s global footprint:
- The financial soundness of the Group’s banks is based on the funding of lending activity, fundamentally through the use of customer funds. Customer deposits, in particular those more liquid and of lower cost, have shown a positive trend in all the Group’s franchises.
- In the Eurozone, the liquidity situation is comfortable in all the internal and regulatory metrics, and is within established limits. In the first three months of 2017 liquidity has been generated by a narrowing of the credit gap, as well as a reduction in the fixed-income portfolios.
- In Mexico, the liquidity position continues to be sound, despite market volatility. The credit gap has narrowed this year, thanks to a significant increase of deposits in U.S. dollars, so there is little dependence on wholesale funding.
- In the United States, the liquidity situation is comfortable, with extensive volumes of cash supported by the reduction of the credit gap. In the first quarter of 2017, the credit rating agency Standard & Poor’s improved the outlook of BBVA Compass from negative to stable.
- Comfortable liquidity situation in Turkey. Slight increase in the credit gap during the quarter due to higher lending activity.
- In South America, deposit growth over the quarter higher than that of the loan book has helped improve the comfortable liquidity situation in the region.
- In the first three months of the year, BBVA S.A. has accessed the wholesale funding markets for €2 billion, using senior (€1 billion) and Tier 2 (€1 billion) debt. In addition, BBVA S.A. has also closed various private issuance transactions of Tier 2 debt for a total of €330m. In April BBVA S.A. has also once more issued senior debt with a variable coupon for €1.5 billion. The long-term wholesale funding markets remain stable in the other geographical areas where the Group operates. Of note has been the senior debt issue by Garanti in Turkey for US$500m.
- Short-term funding has also continued to perform favorably, in a context of high liquidity.
- As regards the new LCR regulatory liquidity ratio, BBVA Group has levels of over 100%, clearly higher than demanded by regulations (over 80% in 2017), both at Group level and in all its banking subsidiaries.
Foreign exchange
Foreign-exchange risk management of BBVA’s long-term investments, basically stemming from its franchises abroad, aims to preserve the Group’s capital adequacy ratios and ensure the stability of its income statement.
The first quarter of 2017 has been marked by:
- Uncertainty with respect to the fiscal and commercial policies of the new U.S. administration, which has generated a high level of volatility in the case of the Mexican peso.
- The cautious rise in interest rates by the Federal Reserve (FED).
- The debate on the elimination of negative rates by the European Central Bank (ECB), in view of the improvement in macroeconomic data.
- Activation of the process for the United Kingdom’s exit from the European Union (Brexit).
- Action by central banks in Mexico (Banxico) and Turkey (CBRT) to address the volatility of their currencies.
In this context, BBVA has maintained its policy of actively hedging its main investments in emerging countries, covering on average between 30% and 50% of the earnings expected for the following year and around 70% of the excess of the CET1 ratio (which is not naturally covered by the ratio itself). In accordance with this policy, at the close of March 2017, the sensitivity of the CET1 ratio to a depreciation of 10% of the main emerging currencies (Mexican peso or Turkish lira) against the euro would be limited to less than 2 basis points, and the coverage level of the expected earnings for next year in these two countries would be around 60% in Mexico and 50% in Turkey.
Interest rates
The aim of managing interest-rate risk is to maintain a sustained growth of net interest income in the short and medium term, irrespective of interest-rate fluctuations, while controlling the impact on the capital adequacy ratio through the valuation of the portfolio of available-for-sale assets.
In the first quarter of 2017, the results of this management have been satisfactory, with limited risk strategies in all the Group’s banks aimed at improving profitability. The amount of NTI generated in Europe, Mexico and Turkey is the result of prudent portfolio management strategies, particularly of sovereign debt, in a context of low interest rates. Portfolios are also held in the United States and South America, mainly of sovereign debt, to manage the balance-sheet structure.
Finally, the following is worth noting with respect to the monetary policy pursued by the different central banks of the main geographical areas where BBVA operates:
- No relevant changes in the Eurozone, where rates remain at 0%.
- In the United States the upward trend in interest rates continues, with a further rise in March to 1%.
- In Mexico, Banxico has carried out two interest-rate hikes so far this year for a total of 75 basis points, with the aim of containing inflation, leaving the monetary policy level at 6.50%.
- In Turkey, the quarter has been marked by the CBRT’s interest-rate hikes to contain inflationary and depreciation pressures on the Turkish lira.
Economic capital
Consumption of economic risk capital (ERC) at the close of February stood at €37,127m 1 in consolidated terms, a similar level to the close of 2016. Of note by type of ERC are: the increase in ERC for credit risk (the Americas and Turkey) and to a lesser extent equity risk due to goodwill (a result of the appreciation of some currencies over the quarter); as well as the reductions in trading ERC (for Garanti and insurance activity in Spain); fixed-income spread (Spain and Corporate & Investment Banking - CIB); exchange-rate (due to the depreciation of the Turkish lira in January 2017 on December 2016) and interest-rate structural risk; and fixed assets.
(1) The rate of change is calculated against the consolidated data at the close of December 2016 in comparable terms (€37,094m). This includes the annual effect of updating the diversification coefficients, the asset risk parameters at the close of the year (Mexico, South America, the United States and Garanti), and the sovereign rating (Garanti), as well as a review of the rest of the risk models, against the official consolidated figure at the close of 2016 (€37,665m).
Attributable economic risk capital breakdown
(Percentage as of March 2017)

The BBVA share
Global growth improved in the second half of 2016 (around 0.9% on a quarterly basis) and the trend appears to be solidifying so far in 2017. Growth in developed countries is accelerating thanks to an increase in confidence and global trade, also underpinned by an improved outturn in the Chinese economy. The performance of the rest of the emerging economies is uneven, but in general the trend is for recovery.
Against this backdrop, the main stock market indices delivered positive results in the first quarter of 2017. In Europe, the Stoxx 50 rose by 5.0%; in the Eurozone, the Euro Stoxx 50 gained 6.4%; and in Spain, the Ibex 35 increased by 11.9%. The S&P 500, which tracks the share prices of U.S. companies, also performed positively, registering a 5.5% rise.
In the banking sector, the European Stoxx Banks index, which includes British banks, rose 5.1%, while the Eurozone bank index, the Euro Stoxx Banks, increased by 8.4%. In contrast, in the United States the S&P Regional Banks sector index recorded a decline of 1.7%.
During the first three months of 2017, the BBVA share sustained a stronger relative performance than both the European banking sector and the Ibex 35; the share price rose by 13.3%, closing the quarter at 7.27 euros.
BBVA share evolution compared with European indices
(Base indice 100=31-03-2016)

The BBVA share and share performance ratios
| 31-03-17 | 31-12-16 | |
|---|---|---|
| Number of shareholders | 919,274 | 935,284 |
| Number of shares issued | 6,566,615,242 | 6,566,615,242 |
| Daily average number of shares traded | 49,642,589 | 47,180,855 |
| Daily average trading (million euros) | 322 | 272 |
| Maximum price (euros) | 7.32 | 6.88 |
| Minimum price (euros) | 5.92 | 4.50 |
| Closing price (euros) | 7.27 | 6.41 |
| Book value per share (euros) | 7.32 | 7.22 |
| Tangible book value per share (euros) | 5.88 | 5.73 |
| Market capitalization (million euros) | 47,739 | 42,118 |
| Yield (dividend/price; %) (1) | 5.1 | 5.8 |
- (1) Calculated by dividing shareholder remuneration over the last twelve months over the closing price at the end of the period.
As regards shareholder remuneration, the Board of Directors of BBVA decided at its meeting on March 29, 2017 to increase share capital against voluntary reserves, in accordance with the terms agreed by the Annual General Meeting of March 17, 2017. This increase in share capital has served as a way to implement the “dividend option” shareholder remuneration system, offering BBVA shareholders the possibility of receiving all or a part of their remuneration in newly issued BBVA ordinary shares or cash. BBVA has committed to buy each free allocation right at a price of €0.131 gross per right. Ultimately, owners of 83.28% of these rights chose to receive new shares.
In the future, once this “dividend-option” has been paid, and in line with the significant event published on February 1, 2017, BBVA intends to distribute fully in cash between 35% and 40% of profits obtained each year. This shareholder remuneration policy will be formed each year of an interim dividend (which is expected to be paid in October) and a final dividend (which will be paid out upon completion of the final year and following approval of the application of the result, foreseeably in April). These payouts will be subject to appropriate approval by the corresponding governing bodies.
Shareholder remuneration
(Euros-gross-/share)

The number of BBVA shares as of March 31, 2017, remained at 6,567 million and the number of shareholders was 919,274. Investors resident in Spain held 45.25% of share capital, while non-resident shareholders owned the remaining 54.75%.
Shareholder structure (31-03-2017)
| Numbers of shares |
Shareholders | Shares | ||
|---|---|---|---|---|
| Number | % | Number | % | |
| Up 150 | 191,907 | 20.9 | 13,731,834 | 0.2 |
| 151 to 450 | 190,617 | 20.7 | 51,856,537 | 0.8 |
| 451 to 1,800 | 288,374 | 31.4 | 278,807,222 | 4.2 |
| 1,801 to 4,500 | 130,362 | 14.2 | 371,459,887 | 5.7 |
| 4,501 to 9,000 | 60,509 | 6.6 | 381,412,700 | 5.8 |
| 9,001 to 45,000 | 50,887 | 5.5 | 887,297,571 | 13.5 |
| More than 45,001 | 6,618 | 0.7 | 4,582,049,491 | 69.8 |
| Total | 919,274 | 100.0 | 6,566,615,242 | 100.0 |
BBVA shares are traded on the Continuous Market of the Spanish Stock Exchanges and also on the stock exchanges in London and Mexico. BBVA American depositary shares (ADS) are traded on the New York Stock Exchange and on the Lima Stock Exchange (Peru), under an exchange agreement between these two markets. Among the main stock market indices, BBVA shares are included on the Ibex 35, Euro Stoxx 50 and Stoxx 50, with a weighting of 8.80%, 2.01% and 1.30% respectively. They are also listed on several sector indices, including the Euro Stoxx Banks, with a weighting of 9.17%, and the Stoxx Banks, with a weighting of 4.58%.
Finally, BBVA maintains a significant presence on a number of international sustainability indices or ESG (environmental, social and governance), which evaluate the performance of companies in this area, as summarized in the table below.
Sustainability indices on which BBVA is listed as of 31-03-2017 (1)
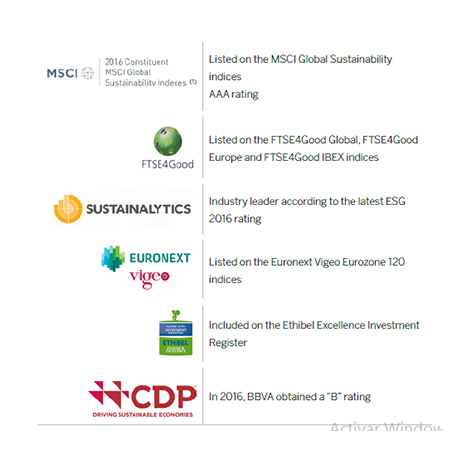
(1)The inclusion of BBVA in any MSCI index, and the use of MSCI logos, trademarks, service marks or index names herein donot constitute a sponsorship, endorsement or promotion of BBVA by MSCI or any of its affiliates. The MSCI indices are the exclusive property of MSCI. MSCI and MSCI index names and logos are trademarks or service marks of MSCI or its affiliates.
Responsible banking
At BBVA we have a differential banking model that we refer to as responsible banking, based on seeking out a return adjusted to principles, strict legal compliance, best practices and the creation of long-term value for all stakeholders.
The main strategic initiatives related to responsible banking which we are working on are:
The creation of lasting and more balanced relationships with our customers through transparent, clear and responsible communication and financial education included in the solutions that we offer.
In order to enhance financial education, in the first quarter of 2017 BBVA launched the Center for Financial Education and Skills in collaboration with globally renowned institutions and organizations. The center’s goal is to promote financial knowledge and help people to acquire financial skills that will enable them to improve their lives and access better opportunities.
Moreover, in Spain, BBVA has also launched the 8th edition of Valores de futuro (Future Values), a program which seeks to promote values associated with the correct use of money among children aged 6 to 15 years. More than five million students have taken part in this program since its inception in 2009.
The full integration of how we do business through responsible business policies, a reputational risk model, and a people-centric culture throughout the Organization.
BBVA is committed to communities across our global footprint. In this regard, because of the interest that has arisen among some stakeholders in regard to the financing of the Dakota Access Pipeline, the Bank has sought to sustain a fluid dialog with the customer and representatives of Sioux Standing Rock to facilitate a favorable agreement for all sides. BBVA has published an official statement summarizing its position on this issue:
- BBVA will seek an agreement that is favorable for all parties involved.
- The project, for which the Bank has contributed 5% of the finance, has been assessed in accordance with the Equator Principles, complies with current legislation and has been approved by the Government of the United States.
- An independent human rights consultant has been hired to review matters related to the permitting process and recommend measures
Promotion of responsible and sustainable growth through financial inclusion, sustainable finance, support for SMEs and responsible investment.
BBVA is broadening the range of available sustainable finance tools it provides. In this regard, the Bank has demonstrated its leading position in green finance with the start-up of the green loans plan, following the success achieved in recent years with the green bonds format. This format reflects BBVA’s commitment to sustainability and green principles.
Investment in the community, with priority for financial education initiatives for society, entrepreneurship, knowledge and other social causes that are relevant from a local point of view.
BBVA has launched the sixth edition of “BBVA Momentum”, a social entrepreneurship program, which will be global from now on (run in Spain, United States, Mexico, Turkey and Colombia), reaching more companies and better adapting to the reality facing social entrepreneurs. BBVA Momentum is organized around five initiatives: a training program; a strategic facilitation program; access to an external network of entrepreneurs, customers and investors; collaboration to give visibility to companies; and funding.
Finally, the BBVA Foundation has announced the winners of the 9th BBVA Frontiers of Knowledge Awards. Award categories include: Climate Change, Information and Communication Technologies (ICT), Basic Sciences, Biomedicine, Ecology and Conservation Biology, Contemporary Music, Economy, Finance and Company Management and Development Cooperation. The prizewinners stand out for their originality and for breaking frontiers in pursuit of new knowledge insights.