Mexico
Highlights
- In activity, solid growth of the wholesale portfolio.
- Expenses continue to grow below the rate of gross income.
- Double-digit year-on-year growth in net attributable profit.
- Good asset quality indicators.
Business activity (1)
(Year-on-year change at constant exchange rate. Data as of 30-06-2018)
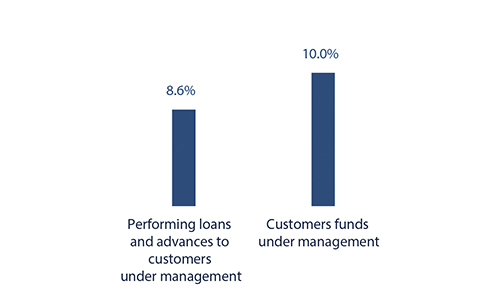
(1) Excluding repos.
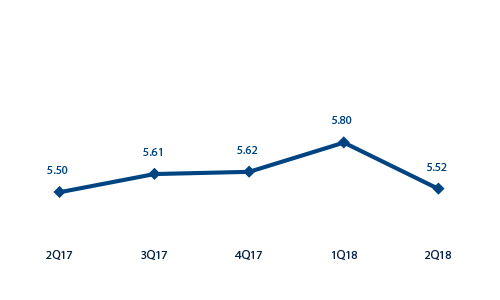
Net interest income/ATAs
(Percentage. Constant exchange rate)
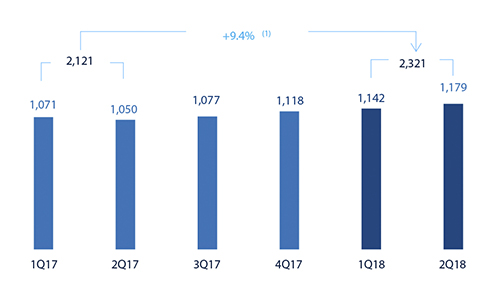
Operating income
(Million euros at constant exchange rate)
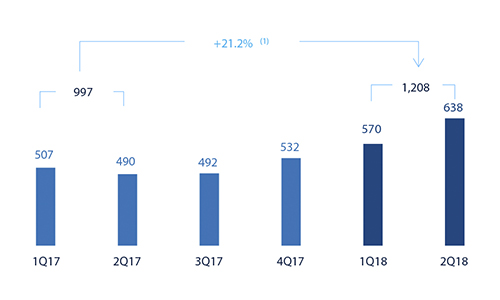
Net attributable profit
(Million euros at constant exchange rate)
(1) At current exchange rate: -0.3%.
(1) At current exchange rate: 10.5%.
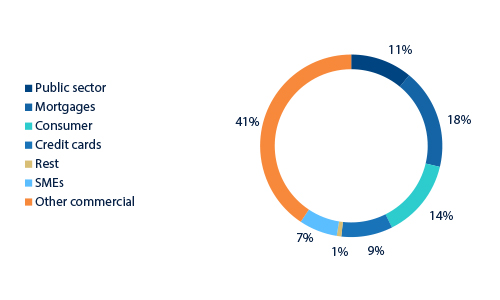
Breakdown of performing loans under management (1)
(30-06-2018)
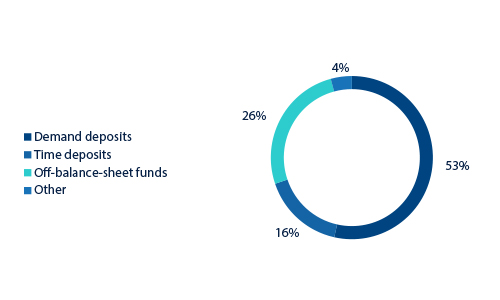
Breakdown of customer funds under management (1)
(30-06-2018)
(1) Excluding repos.
(1) Excluding repos.
Macro and industry trends
Economic activity in Mexico surprised positively in the first quarter of 2018, showing a quarter-on-quarter growth of 1.1%. After the negative effect of natural disasters (earthquakes and hurricanes) in the third quarter last year, economic recovery seems to be consolidating. This good performance was mainly due to the boost from the tertiary sector (trade and services). Among the factors that led to this growth are lower inflation rates and a recovery in the income of economic agents. However, uncertainty about the economic future in the coming quarters has increased, mainly due to the fear of escalating protectionism in the United States. Its biggest effects may be on investment in the coming quarters and foreign direct investment in a longer-term time horizon.
Inflation pressures have decreased during the first part of the year. These lower inflation expectations suggest that additional interest rate hikes by Banxico might not be necessary.
For yet another quarter, the Mexican banking system showed excellent levels of solvency and asset quality. According to the latest available information from the Mexican National Banking and Securities Commission (CNBV) in April 2018, activity remained as strong as in previous quarters, with year-on-year growth in the volume of lending and deposits at 9.4% and 9.3%, respectively. Finally, both the NPL ratio (2.2%) and NPL coverage ratio (151%) were stable.
Activity
Unless expressly stated otherwise, all the comments below on rates of change, for both activity and earnings, will be given at constant exchange rate. These rates, together with changes at current exchange rate, can be seen in the attached tables of financial statements and relevant business indicators.
The most relevant aspects related to the area’s activity year-to-date as of 30-June-2018 were:
- Increase in lending (performing loans under management) throughout the first half of 2018 (up 6.1%) and in year-on-year terms (up 8.6%). BBVA in Mexico continued to maintain its leading position in the country, with a market share of 22.9% in the outstanding portfolio of performing loans, according to local figures from the CNBV at the end of May 2018.
- By portfolio: the wholesale portfolio, which represents 51.5% of total lending, increased by 6.9% year-to-date and 9.5% in year-on-year terms, mainly driven by corporates and medium-sized companies. The government portfolio presented a flat performance since the end of 2017, while it showed a decline of 6.0% in year-on-year terms. The retail portfolio increased by 5.2% during the first half of the year (up 7.7% year-on-year), strongly supported by consumer loans, which rose by 3.9% (5.8% year-on-year). New loan production of credit cards performed excellently. However, the year-to-date figure increased by 0.6%, as more than 95% of the amount invoiced to customers was paid in the same month. In year-on-year terms there was growth of 4.9%.
- Improvement, once again, in asset quality indicators over the quarter: NPL and NPL coverage ratios closed the half year at 2.0% and 155%, respectively.
- Total customer funds (customer deposits under management, mutual funds and other off-balance sheet funds) posted a year-to-date increase of 3.3% and a year-on-year growth of 10.0%, explained by the performance of demand deposits (up 2.3% year-to-date, and up 8.6% year-on-year) and particularly time deposits, which grew at 6.3% and 15.0%, respectively. Mutual funds increased by 5.5% year-to-date (up 11.6% year-on-year).
- A profitable funding mix: low-cost items account for 77% of total customer deposits under management.
Results
BBVA in Mexico posted a net attributable profit in the first half of 2018 of €1,208m, a year-on-year increase of 21.2%. Main highlights on the year-on-year income statement are:
- Positive performance of net interest income, which increased 7.8% year-on-year, driven primarily by greater volumes of activity.
- Good performance of net fees and commissions, with growth of 8.2% over the last twelve months. They remained strongly influenced by an increased volume of transactions with credit card customers, cash management and mutual funds.
- NTI increased (up 35.4% year-on-year) due to the positive results from the Global Markets Unit.
- In other income/expenses the comparison was negative year-on-year (down 23.5%), mainly explained by extraordinary income from insurance activity in the first half of 2017.
- Operating expenses continued to grow at a controlled pace (up 4.4% year-on-year) and below the area's gross income growth of 7.7%. As a result, the efficiency ratio has continued to improve and stood at 33.0% at the close of the first half of the year.
- Good risk management has been reflected in the 6.5% decline in impairment losses on financial assets. This is explained, among other factors, by a lower volume of non-performing assets. As a result, the cumulative cost of risk in the area closed at 2.93% from 3.24% as of December 2017.
- Other gains (losses) included the extraordinary income from the sale of BBVA Bancomer's stake in a real-estate development in the first quarter of 2018, and the capital gain from the sale of a building by Bancomer in the second quarter of 2018.
Financial statements and relevant business indicators (Million euros and percentage)
| IFRS 9 | IAS 39 | ||||
|---|---|---|---|---|---|
| Income statement | 1H18 | ∆% | ∆%(1) | 1H17 | |
| Net interest income | 2,648 | (1.8) | 7.8 | 2,696 | |
| Net fees and commissions | 589 | (1.4) | 8.2 | 597 | |
| Net trading income | 144 | 23.4 | 35.4 | 117 | |
| Other operating income and expenses | 84 | (30.3) | (23.5) | 120 | |
| Gross income | 3,465 | (1.8) | 7.7 | 3,530 | |
| Operating expenses | (1,144) | (4.8) | 4.4 | (1,202) | |
| Personnel expenses | (498) | (4.2) | 5.2 | (520) | |
| Other administrative expenses | (524) | (5.3) | 3.9 | (553) | |
| Depreciation | (122) | (5.6) | 3.5 | (129) | |
| Operating income | 2,321 | (0.3) | 9.4 | 2,328 | |
| Impairment on financial assets not measured at fair value through profit or loss | (708) | (14.8) | (6.5) | (831) | |
| Provisions or reversal of provisions and other results | 54 | n.s. | n.s. | (8) | |
| Profit/(loss) before tax | 1,667 | 12.0 | 22.9 | 1,488 | |
| Income tax | (458) | 16.1 | 27.4 | (395) | |
| Profit/(loss) for the year | 1,208 | 10.5 | 21.2 | 1,094 | |
| Non-controlling interests | (0) | 10.3 | 21.0 | (0) | |
| Net attributable profit | 1,208 | 10.5 | 21.2 | 1,094 | |
| IFRS 9 | IAS 39 | ||||
|---|---|---|---|---|---|
| Balance sheets | 30-06-18 | ∆% | ∆%(1) | 31-12-17 | |
| Cash, cash balances at central banks and other demand deposits | 5,928 | (32.9) | (35.1) | 8,833 | |
| Financial assets designated at fair value | 28,293 | (1.2) | (4.4) | 28,627 | |
| of which loans and advances | 27 | (98.3) | (98.3) | 1,558 | |
| Financial assets at amortized cost | 55,871 | 17.2 | 13.3 | 47,691 | |
| of which loans and advances to customers | 49,498 | 8.2 | 4.6 | 45,768 | |
| Tangible assets | 1,734 | (0.9) | (4.1) | 1,749 | |
| Other assets | 2,785 | (61.1) | (62.4) | 7,160 | |
| Total assets/liabilities and equity | 94,611 | 0.6 | (2.7) | 94,061 | |
| Financial liabilities held for trading and designated at fair value through profit or loss | 17,254 | 83.5 | 77.4 | 9,405 | |
| Deposits from central banks and credit institutions | 1,987 | (66.0) | (67.2) | 5,853 | |
| Deposits from customers | 49,573 | (0.8) | (4.1) | 49,964 | |
| Debt certificates | 8,012 | 9.6 | 6.0 | 7,312 | |
| Other liabilities | 13,773 | (21.9) | (24.4) | 17,627 | |
| Economic capital allocated | 4,011 | 2.8 | (0.5) | 3,901 | |
| Relevant business indicators | 30-06-18 | ∆% | ∆%(1) | 31-12-17 |
|---|---|---|---|---|
| Performing loans and advances to customers under management (2) | 49,568 | 9.7 | 6.1 | 45,196 |
| Non-performing loans | 1,052 | (6.3) | (9.4) | 1,124 |
| Customer deposits under management (3) | 48,142 | 6.8 | 3.2 | 45,093 |
| Off-balance sheet funds (4) | 20,823 | 6.9 | 3.4 | 19,472 |
| Risk-weighted assets | 50,630 | 12.7 | 8.9 | 44,941 |
| Efficiency ratio (%) | 33.0 | 34.4 | ||
| NPL ratio (%) | 2.0 | 2.3 | ||
| NPL coverage ratio (%) | 155 | 123 | ||
| Cost of risk (%) | 2.93 | 3.24 |
(1) Figures at constant exchange rate.
(2) Excluding repos.
(3) Includes mutual funds, pension funds and other off-balance sheet funds.