Despite the difficult economic environment in 2011, BBVA was able to improve and stabilize the primary indicators of credit quality. At the close of the year, the NPA ratio went down to 4.0%, the coverage ratio stood at 61% and the cumulative risk premium decreased to 1.20%. Thus the Group continued to stand out from the rest of the system with respect to the positive performance of its risk indicators.
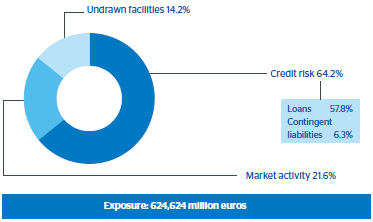
BBVA’s maximum exposure to credit risk stood at €624,624 million as of December 31, 2011, with a 4.1% increase with respect to the end of 2010. Customer credit risks (including contingent liabilities), which represent 64.2% of total credit risk, increased by 4.3% over the same time period. This increase was due to the incorporation of Garanti and the growth in lending in Mexico and, especially, in South America (in real terms). Potential exposure to credit risk in market activities (21.6% overall), including potential exposure to derivatives (once netting and collateral agreements are considered), rose by 4.3%, while undrawn facilities (14.2% overall) went 2.5% up.
The loan-book in the private residents sector in Spain stood at €174 billion, being its risks highly diversified by sector and counterparty type.
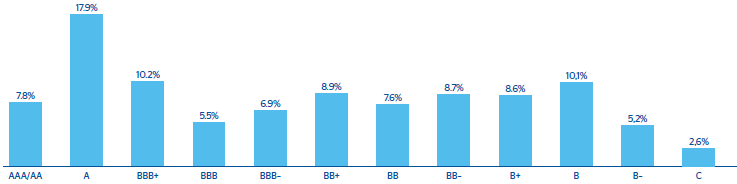
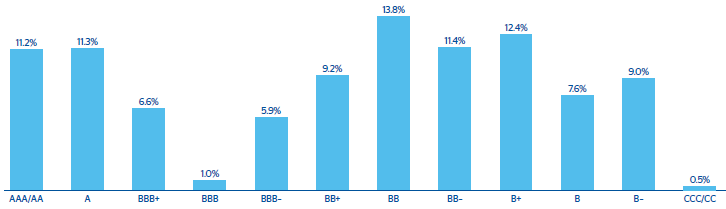
The exposure breakdown by rating of BBVA Spain, including corporations, financial institutions, sovereign institutions and customers shows 67.8% of A or better ratings. The breakdown by rating of the business and developer segments handled by BBVA Spain is also shown (Chart 19).
The breakdown of the loan book with corporates and financial institutions by rating in Mexico is shown in Chart 21.
16. BBVA Group. Maximum exposure to credit risk. Distribution by type of risk
(31-12-2011)
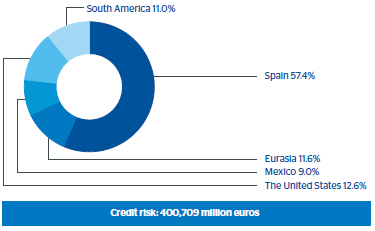
17. BBVA Group. Gross exposure to credit risk. Distribution by business area
(31-12-2011)
18. BBVA Group. Gross exposure to credit risk. Distribution by portfolio
(31-12-2011)
19. Distribution by rating in Spain (1)
(Exposure as of 31-12-2011)
(1) Include companies, financial institutions, public institutions and sovereign risks.
20. Distribution by rating. Corporates and developers in Spain (1)
(Exposure as of 31-12-2011)
(1) Include only the banking book.
21. Distribution by rating in Mexico
(Exposure as of 31-12-2011)
Maximum exposure to credit risk
(Million euros)
|
31-12-11 |
31-12-10 |
31-12-09 |
|
Spain |
Eurasia |
Mexico |
South America |
The United States |
Corporate Activities |
Total Group |
Total Group |
Total Group |
| Gross credit risk (drawn) |
232,666 |
47,113 |
36,551 |
44,398 |
44,528 |
(4,547) |
400,709 |
384,069 |
364,776 |
| Loans and receivables |
214,150 |
34,690 |
36,143 |
40,218 |
40,069 |
(3,960) |
361,310 |
348,253 |
332,162 |
| Contingent liabilities |
18,515 |
12,423 |
408 |
4,181 |
4,459 |
(587) |
39,398 |
35,816 |
32,614 |
| Market activity |
42,671 |
10,269 |
25,117 |
14,325 |
9,916 |
32,640 |
134,937 |
129,398 |
136,453 |
| Credit entities |
9,532 |
4,650 |
4,961 |
3,593 |
1,033 |
2,337 |
26,107 |
23,636 |
22,239 |
| Fixed income |
17,930 |
5,618 |
19,175 |
7,779 |
7,816 |
30,303 |
88,621 |
88,081 |
98,254 |
| Derivatives |
15,210 |
- |
980 |
2,953 |
1,067 |
- |
20,209 |
17,680 |
15,960 |
| Undrawn facilitites |
32,536 |
18,786 |
11,465 |
5,423 |
22,604 |
(1,835) |
88,978 |
86,790 |
84,925 |
| Maximum exposure to credit risk |
307,872 |
76,167 |
73,132 |
64,146 |
77,049 |
26,259 |
624,624 |
600,257 |
586,154 |
Customer lending by sector
(Million euros)
|
31-12-11 |
31-12-10 |
31-12-09 |
|
Resident |
Non-residents |
Total |
Total |
Total |
| Public sector |
25,372 |
9,718 |
35,090 |
31,224 |
26,219 |
| Agriculture |
1,526 |
3,315 |
4,841 |
3,977 |
3,924 |
| Industry |
16,287 |
20,930 |
37,217 |
36,578 |
42,798 |
| Real estate and construction |
29,262 |
21,727 |
50,989 |
55,854 |
55,767 |
| Commercial and financial |
21,801 |
33,947 |
55,748 |
53,830 |
48,936 |
| Loans to individuals customers |
85,206 |
53,857 |
139,063 |
135,868 |
126,488 |
| Others |
19,495 |
17,412 |
36,907 |
29,879 |
26,955 |
| Subtotal |
198,948 |
160,907 |
359,855 |
347,210 |
331,087 |
| Interest, fees and others |
35 |
418 |
453 |
195 |
320 |
| Total |
198,983 |
161,324 |
360,308 |
347,405 |
331,407 |