
Own Funds and capital
For the purposes of calculating minimum capital requirements, according to Regulation (EU) 575/2013 and subsequent amendments, which enter into force on June 27, 2019 (CRR), the elements and instruments of Tier 1 (Tier 1) capital are defined as the sum of Common Equity Tier 1 capital (CET1) and additional Tier 1 capital (AT1), as defined in Part Two, Title I, Chapters I to III of the CRR, as well as their corresponding deductions, in accordance with Articles 36 and 56, respectively.
Also considered are the elements of Tier 2 capital defined in Part Two of Chapter IV, Section I of the CRR. The deductions defined as such in Section II of the same Chapter are also considered.
The amount of total eligible capital, net of deductions, for the different items making up the capital base as of December 31, 2020 and 2019, respectively, is below, in accordance with the requirements for the disclosure of information related to regulatory own funds established by the Commission's Implementing Regulation (EU) No 1423/2013 of December 20, 2013:
Amount of capital (CC1)
Million Euros
| Reference to template CC2 (1) | 12-31-2020 | 12-31-2019 (2) |
|---|---|---|
| a) Capital and share premium | 27,259 | 27,259 |
| b) Retained earnings | 29,974 | 29,127 |
| c) Other accumulated earnings and other reserves | (14,023) | (10,133) |
| d) Minority interests | 3,656 | 4,404 |
| e) Net interim attributable profit | 860 | 1,316 |
| Common Equity Tier 1 Capital before other regulatory adjustments | 47,726 | 51,974 |
| f) Additional value adjustments | (233) | (302) |
| g) Intangible assets | (3,455) | (6,803) |
| h) Deferred tax assets | (1,478) | (1,420) |
| i) Fair value reserves related to gains o losses on cash flow hedges | (204) | 69 |
| j) Expected losses in equity | - | - |
| k) Profit or losses on liabilities measured at fair value | 21 | (24) |
| l) Direct and indirect holdings of own instruments | (366) | (484) |
| m) Securitizations tranches at 1250% | (29) | (25) |
| n) Other CET1 deductions | 949 | 667 |
| Total Common Equity Tier 1 regulatory adjustments | (4,795) | (8,321) |
| Common Equity Tier 1 (CET1) | 42,931 | 43,653 |
| o) Equity instruments and AT1 share premium | 6,130 | 5,280 |
| p) Items referred in Article 486 (4) of the CRR | - | 120 |
| q) Qualifying Tier 1 capital included in consolidated AT1 capital (including minority interests not included in row d) issued by subsidiaries and held by third parties) | 536 | 648 |
| Additional Tier 1 before regulatory adjustments | 6,666 | 6,048 |
| Total regulatory adjustments of Additional Tier 1 | - | - |
| Additional Tier 1 (AT1) | 6,666 | 5,048 |
| Tier 1 (Common Equity Tier 1 + Additional Tier 1) | 49,597 | 49,701 |
| r) Equity instruments and Tier 2 share premium | 4,540 | 3,242 |
| s) Admissible shareholders' funds instruments included in consolidated Tier 2 issued by subsidiaries and held by third parties | 3,410 | 4,512 |
| Of which: instruments issued by subsidiaries subject to phase-out | 23 | 516 |
| t) Credit risk adjustments | 604 | 631 |
| Tier 2 before regulatory adjustments | 8,554 | 8,385 |
| Tier 2 regulatory adjustments | (6) | (82) |
| Tier 2 | 8,547 | 8,304 |
| Total Capital (Total capital = Tier 1 + Tier 2) | 58,145 | 58,005 |
| Total RWA's | 353,273 | 364,448 |
| CET 1 (phased-in) | 12.15% | 11.98% |
| CET 1 (fully loaded) | 11.73% | 11.74% |
| TIER 1( phased in) | 14.04% | 13.64% |
| TIER 1( fully loaded) | 13.62% | 13.37% |
| Total Capital (phased in) | 16.46% | 15.92% |
| Total Capital (fully loaded) | 15.91% | 15.41% |
- (*) As of December 31, 2020, the diference between phased-in and fully loaded ratios arises from the transitional treatment of certain capital elements, mainly the impact of IFRS9, to which the BBVA Group has voluntarily adhered (in accordance with the article 473 bis of the CRR). See paragraph 2.3 for more information on the transitional impact of IFRS9.
- In addition, noted that the Group to date is not applying the transitional treatment of unrealized gains and losses valued at fair value through Other comprehensive Income (hereinafter, unrealized P&L measured at fair value through OCI) as defined in Article 1.6 of that Regulation amending Article 468 of the CRR. Therefore, the Group's own funds, capital and leverage ratios to date reflect the full impact of the above-mentioned unrealized P&L measured at fair value through OCI.
- (**) In line with the EBA Standards published in June 2020 (EBA/ITS/2020/04) the template has been adapted according to the format established by the EBA in those rows that are applicable to the date of the report, among which is the transitional impact of IFRS9 on CET1, which has been reclassified from the "Common Equity Tier 1 Before Other Regulatory Adjustments" row as an Commmon Equity Tier 1 regulatory adjustment, within the "Other regulatory adjustments" row. In addition to this change, December 2019 data has been restated to consider the change in accounting policy made by the Group which involves recording the differences generated when translating the restated financial statements of the subsidiaries in hyperinflationary economies into euros as indicated in footnote 1.3 of the Consolidated Financial Statements.
- (1) References to regulatory balance sheet items (CC2) reflecting the diferent items described
As of December 2020 Common Equity Tier 1 (CET1) phased-in ratio stood at 12.15% which represented an increase of +17 basis points with respect to 2019. The difference is mainly explained by:
- The positive BBVA´s organic profit generation which has it made possible to cover the growth (in constant euros) of risk weighted assets (RWA) and the relative stabilization of the financial markets during the second half of the year, largely motivated by the measures to stimulate the economy and the announced guaranteed programs by the different national and supranational authorities and the approval by the Parliament and the European Council of regulation 2020/873 (known as CRR quick fix). In this regard, the modification in the software deduction had a positive impact of +19 basis points.
- The effect of the transitory adjustments for the treatment in the solvency ratios of the impacts of IFRS 9 and subsequent modifications in response to the COVID-19 pandemic.
- The execution of the agreement reached with Allianz to jointly develop the non-life insurance business in Spain, excluding the health insurance line had an impact of +7 basis points in CET1 ratio.
In addition, the effect of the distribution of a dividend of 0.059 euros gross per share has been frontloading at the CET1 levels of December 2020, which rises to a maximum amount of approximately 393 million euros (equivalent to 11 bps of CET1) and that have been calculated taking into account the ECB recommendation. (For more information see note 4 of the Group's Consolidated Financial Statements).
In terms of fully loaded, CET1 ratio stood at 11.73%, which remains at a similar level compared to December 2019 (11.74%).
Phased-in Additional Tier 1 (AT1) capital stood at 1.89% at the end of December 2020, an improvement of 23 basis points compared to 2019. In this regard, a green CoCo was issued in July 2020 for €1,000m, with a 6% coupon and an early repayment option from five and a half years. However, in February, a CoCo of €1.5 billion (6.75% coupon) was amortised on the first date of the early amortisation option, while in January 2021, the early amortisation options were implemented for two preferential issuances, issued by BBVA International Preferred and Caixa Sabadell Preferents for 31 million pounds sterling and €90m respectively. Furthermore, in a third preferential issuance issued by Caixa Terrassa Societat de Participacions Preferents, consent was received from the bondholders' meeting for its early amortisation from 29 January 2021 (compared to the early amortisation option of 10 August 2021). As of 31 December, these issuances do not form part of the Group's capital adequacy ratios.
The phased-in Tier 2 ratio at 31 December 2020 stood at 2.42%, an increase of 14 basis points compared to 2019. Two Tier 2 issuances were issued in 2020: an issuance of €1,000m in January, with a maturity of 10 years and a repayment option from the fifth year, with a coupon of 1%; and another issuance of 300 million pounds sterling in July, with a maturity of 11 years and with an early repayment option from the sixth year, with a coupon of 3.104%.
Regarding the MREL (Minimum Requirement for own funds and Eligible Liabilities) requirements, BBVA has continued with its issuance plan during 2020 by closing two public issuances of senior non-preferred debt, one in January 2020 for € 1.25 billion euros for a seven-year term and a coupon of 0.5%, and another in February 2020 for 160 million Swiss francs, with a term of six and a half years and a coupon of 0.125%. In May 2020, the first issuance of a COVID-19 social bond by a private financial entity in Europe was closed. It is a senior preferred bond with a 5-year term, for an amount of 1.0 billion euros and a coupon of 0.75%. Finally, to optimize compliance with the MREL requirement, in September BBVA issued a senior preferred debt of US $ 2.0 billion in two tranches, with maturities of three and five years, for US $ 1.2 billion and 800 million and coupons of 0.875% and 1.125%, respectively.
The Group estimates that, after the entry into force of Regulation (EU) 2019/877 of the European Parliament and of the Council of May 20 (which, among other issues, establishes the MREL in terms of APRs and new transition periods and implementation of said requirement), the current structure of own funds and admissible liabilities of the resolution group allows compliance with MREL.
Annual evolution of the CET1 fully loaded ratio
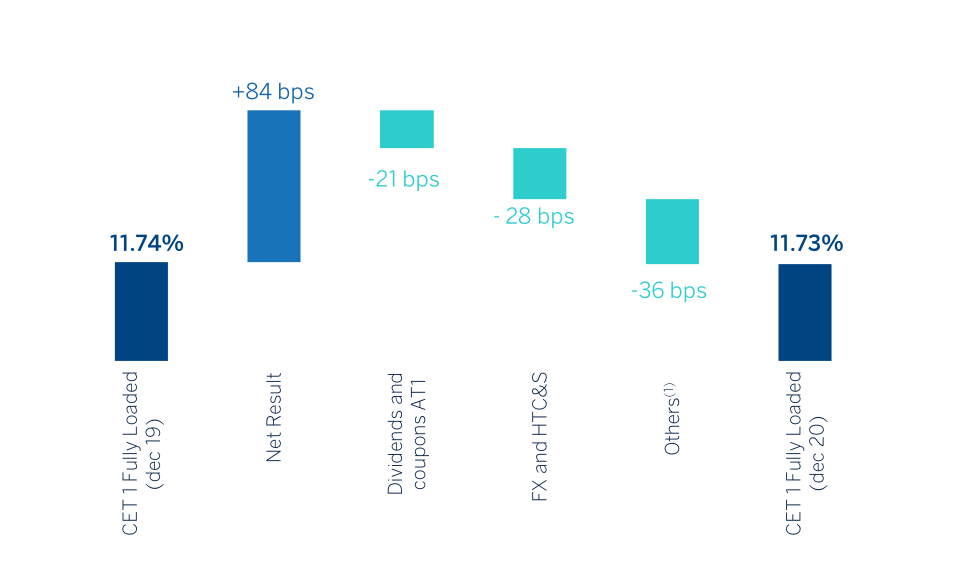
(1) Includes mainly RWAs evolution in constant Euros, frontloading of regulatory impacts (-25 bps.), impact of the new treatment of software (+19 bps.) and impact from the Joint Venture with Allianz (+7 pbs.).
The characteristics of the main capital instruments are shown in Annex III, available on the Group's website, in accordance with Commission Implementing Regulation (EU) No 1423/2013 of December 20, 2013.
The process of reconciliation between accounting own funds and regulatory own funds is shown below. Based on the shareholders’ equity reported in the Group’s Consolidated Financial Statements and applying the deductions and adjustments shown in the table below, we arrive at the regulatory capital figure eligible for solvency purposes:
Reconciliation of the Public Balance Sheet from the accounting perimeter to the regulatory perimeter
Million Euros
| Eligible capital own funds | 12-31-2020 | 12-31-2019 (2) |
|---|---|---|
| Capital | 3,267 | 3,267 |
| Share premium | 23,992 | 23,992 |
| Retained earnings, revaluation reserves and other reserves | 30,344 | 29,269 |
| Other equity | 42 | 56 |
| Less: Treasury shares | (46) | (62) |
| Attributable to the parent company | 1,305 | 3,512 |
| Attributed dividend | - | (1,084) |
| Total Equity | 58,904 | 58,950 |
| Accumulated other comprehensive income (Loss) | (14,356) | (10,226) |
| Non-controlling interest | 5,472 | 6,201 |
| Shareholders' equity | 50,020 | 54,925 |
| Goodwill and other Intangible assets | (3,455) | (6,803) |
| Direct and synthetic treasury shares | (320) | (422) |
| Deductions | (3,775) | (7,225) |
| Differences from solvency and accounting level | (186) | (215) |
| Equity not eligible at solvency level | (186) | (215) |
| Other adjustments and deductions (2) | (3,128) | (3,832) |
| Common Equity Tier 1 (CET 1) | 42,931 | 43,653 |
| Additional Tier 1 before Regulatory Adjustments | 6,666 | 6,048 |
| Total regulatory adjustment of additional Tier 1 | - | - |
| Tier 1 | 49,597 | 49,701 |
| Tier 2 | 8,548 | 8,304 |
| Total Capital (Tier 1 + Tier 2) | 58,145 | 58,005 |
| Total minimum capital required (1) | 45,042 | 46,540 |
- (1) Calculated over the minimum total capital applicable at each period.
- (2) Other adjustments and deductions includes the amount of minority interest not eligible as capital, amount of dividends not distributed and other deductions and filters set by the CRR. Additionally, it includes a prudential accrual corresponding to 0.059 euros gross shareholder remuneration based on the current recommendation of the ECB.
The table below shows a comparison of institutions' own funds and capital and leverage ratios with and without the application of the temporary treatment of the impacts of IFRS 9, and with and without the application of the temporary treatment in accordance with Article 468 of the CRR, as established by EBA guidelines (EBA/GL/2018/01).
Since 2018 BBVA Group has applied the transitional treatment of IFRS9 impact. Therefore, phased-in capital ratios and leverage ratio are calculated taking into account the transitional provisions as defined by article 473 bis of the CRR and its subsequent amendments made by Regulation 2020/873 of the Parliament and Council of 24 June 2020 in response to the COVID-19 pandemia. The Group also applies paragraph 7a of the aforementioned article in calculating the impact of the transitional treatment on phased in risk-weighted assets.
In addition, as of the date of the report, the Group is not applying the temporary treatment of unrealised gains and losses measured at fair value through other comprehensive income (hereinafter, unrealised gains and losses measured at FVTOCI) outlined in Article 1, Paragraph 6 of the aforementioned regulation amending Article 468 of the CRR. Therefore, the Group's own funds, and its capital adequacy and leverage ratios, reflect to date the full impact of the aforementioned unrealised gains and losses measured at FVTOCI.
In addition, the own funds and capital adequacy ratios—despite not including the application of the temporary treatment of IFRS 9 and other comprehensive income—do include the impact of applying temporary treatments other than those mentioned above.
IFRS 9-FL - Comparison of institutions’ own funds and capital and leverage ratios with and without the application of transitional arrangements for IFRS 9 or analogous ECLs and with and without the application of the transitional treatment of unrealised gains and losses measured at FVOCI.
Million Euros
| Own funds | 12-31-2020 | 09-30-2020 | 06-30-2020 | 03-31-2020 | 12-31-2019 |
|---|---|---|---|---|---|
| CET1 Capital | 42,931 | 41,231 | 42,119 | 40,854 | 43,653 |
| CET1 Capital without IFRS9 transitional arrangement or similar ECL | 41,333 | 39,640 | 40,734 | 39,902 | 42,844 |
| CET1 Capital without IFRS9 transitional arrangement | |||||
| Tier 1 Capital (T1) | 49,597 | 48,248 | 48,186 | 46,974 | 49,701 |
| Tier 1 Capital (T1) without IFRS9 transitional arragement or similar ECL | 48,000 | 46,657 | 46,802 | 46,022 | 48,892 |
| Tier 1 Capital (T1) without FVCCI transitional arragement | |||||
| Total Capital | 58,145 | 57,305 | 57,531 | 56,731 | 58,005 |
| Total Capital without IFRS9 transitional arragement or similar ECL | 56,544 | 55,712 | 56,146 | 55,779 | 57,196 |
| Tier 1 Capital (T1) without FVCCI transitional arragement | |||||
| Risk-weighted assets (million euros) | - | - | - | - | - |
| Total Risk-weighted assets | 353,273 | 343,923 | 362,050 | 368,666 | 364,448 |
| Total Risk-weighted assets without I FRS9 transitional arrangement or similar ECL | 352,679 | 344,215 | 362,388 | 368,839 | 364,943 |
| Capital Ratio | - | - | - | - | - |
| CET1 Capital (as a percentage of total exposure to risk) | 12.15% | 11.99% | 11.63% | 11.08% | 11.98% |
| CET1 Capital (as a percentage of total exposure to risk) without IFRS9 transitional arrangement or similar ECL | 11.72% | 11.52% | 11.24% | 10.82% | 11.74% |
| CET1 Capital (as a percentage of total exposure to risk) without IFRS9 transitional arrangement | |||||
| Tier 1 Capital (T1) (as a percentage of total exposure to risk) without IFRS9 transitional arrangement or similar ECL | 14.04% | 14.03% | 13.31% | 12.74% | 13.64% |
| Tier 1 Capital (T1) (as a percentage of total exposure to risk) without IFRS9 transitional arrangement or similar ECL | 13.61% | 13.55% | 12.91% | 12.48% | 13.40% |
| Tier 1 Capital (T1) (as a percentage of total exposure to risk) without IFRS9 transitional arrangement | |||||
| Total Capital (as a percentage of total exposure to risk) | 16.46% | 16.66% | 15.89% | 15.39% | 15.92% |
| Total Capital (as a percentage of total exposure to risk) without IFRS9 transitional arrangement or similar ECL | 16.04% | 16.19% | 15.49% | 15.12% | 15.67% |
| Total Capital (as a percentage of total exposure to risk) without IFRS9 transitional arrangement | |||||
| Leverage Ratio | - | - | - | - | - |
| Total exposure related to leverage ratio | 741,095 | 722,221 | 775,915 | 749,989 | 731,087 |
| Leverage Ratio | 6.69% | 6.68% | 6.21% | 6.26% | 6.80% |
| Leverage ratio without IFRS9 transitional arrangements or similar ECL | 6.46% | 6.47% | 6.03% | 6.15% | 6.70% |
Entity risk profile and Minimum capital requirements
The BBVA Group has a general risk management and control model (hereinafter, the “Model”) that is appropriate for its business model, its organization, the countries where it operates and its corporate governance system. This model allows the Group to carry out its activity within the risk management and control strategy and policy defined by the corporate bodies of BBVA and to adapt itself to a changing economic and regulatory environment, facing this management at a global level and aligned to the circumstances at all times. The Model establishes a suitable risk management system related to the risk profile and strategy of the entity.
The types of risk inherent in the business that make up the risk profile of the Group are as follows:
- Credit risk and dilution: Credit risk arises from the probability that one party to a financial instrument will fail to meet its contractual obligations for reasons of insolvency or inability to pay and cause a financial loss for the other party. This includes counterparty risk, issuer risk, liquidation risk and country risk.
- Counterparty risk: The credit risk corresponding to derivative instruments, repurchase and resale transactions, securities or commodities lending or borrowing transactions and deferred settlement transactions.
- Credit Valuation Adjustment Risk (CVA): Its aim is to reflect the impact on the fair value of the counterparty’s credit risk, resulting from OTC derivative instruments which are not recognized credit derivatives for the purpose of reducing the amount of credit risk weighted exposure.
- Market risk: Market risk originates in the possibility that there may be losses in the value of positions held due to movements in the market variables that affect the valuation of financial products and assets in the trading book. This includes risk with respect to the position in debt and equity instruments, exchange rate risk and commodity risk.
- Operational risk: a risk that may cause losses as a result of human error; inadequate or defective internal processes; inadequate conduct towards customers, in the markets or against the company; failures, interruptions or deficiencies in systems or communications; theft, loss or misuse of information, as well as deterioration of its quality; internal or external fraud including, in all cases, fraud resulting from cyber-attacks; theft or physical damage to assets or persons; legal risks; risks resulting from workforce and occupational health management; and inadequate service provided by suppliers. This definition includes legal risk, but excludes strategic and/or business risk and reputational risk.
- Structural risks: This is divided into structural interest-rate risk (movements in market interest rates that cause changes in an entity’s net interest income and book value) and structural exchange-rate risk (exposure to variations in exchange rates originating in the Group’s foreign companies and in the provision of funds to foreign branches financed in a different currency from that of the investment).
- Liquidity risk: Risk of an entity having difficulties in duly meeting its payment commitments, or where, to meet them, it has to resort to funding under burdensome terms which may harm the Group’s image or reputation.
- Reputational risk: Considered to be the potential loss in earnings as a result of events that may negatively affect the perception of the Group’s different stakeholders.
The chart below shows the total risk-weighted assets broken down by type of risk (where credit risk encompasses counterparty risk) as of December 31, 2020 and December 31, 2019:
Distribution of RWAs by risk type eligible in Pillar I

(*) Credit Risk includes Risk by CVA adjustment
The following table shows the total capital requirements broken down by risk type as of December 31, 2020 and December 31, 2019:
EU OV1 - Overview of RWAs
| RWA's(1) | Minimum Capital requirements (2) (3) |
|||
|---|---|---|---|---|
| 12-31-2020 | 09-30-2020 | 12-31-2019 | 12-31-2020 | |
| Credit Risk (excluding CCR) | 277,644 | 269,409 | 286,159 | 22,212 |
| Of which th standarised approach(4) | 176,056 | 175,783 | 190,603 | 14,085 |
| Of which the foundation IRB (FIRB) approach(6) | 4,263 | 4,458 | 4,606 | 341 |
| Of which the advanced IRB (FIRB) approach(7) | 94,882 | 86,655 | 88,191 | 7,591 |
| Of which the foundation IRB (FIRB) approach(5) | 2,444 | 2,513 | 2,758 | 195 |
| CCR | 9,284 | 9,557 | 8,289 | 743 |
| Of which mark to market | 7,710 | 8,107 | 6,716 | 617 |
| Of which original exposure | - | - | - | - |
| Of which the standardised approach | - | - | - | - |
| Of which the internal model method (IMM) | - | - | - | - |
| Of which risk exposure amount for contributions to the default fund of a CCP | 89 | 60 | 44 | 7 |
| Of which CVA | 1,485 | 1,389 | 1,529 | 119 |
| Settlement Risk | 1 | - | - | 0 |
| Securitization exposures in the banking book (after the cap) | 347 | 368 | 924 | 28 |
| Of which internal assesment approach (SEC- I RBA) | 143 | 157 | - | 11 |
| Of which standardized approach (SEC- SA) | - | - | - | - |
| Of which external assesment approach (SEC- ERBA) | 204 | 210 | - | 16 |
| Market Risk | 14,773 | 16,377 | 16,066 | 1,182 |
| Of which standardised approach (SA) | 6,397 | 6,232 | 6,991 | 512 |
| Of which IMA approach | 8,376 | 10,145 | 9,075 | 670 |
| Operational risk | 35,656 | 34,379 | 37,877 | 2,853 |
| Of which basic indicator approach | 883 | 637 | 805 | 71 |
| Of which standardised approach | 34,773 | 12,783 | 21,822 | - |
| Of which IRB approach | - | 20,959 | 21,822 | - |
| Amounts below the thresholds for education (subject to 250% risk weight) | 15,566 | 13,834 | 15,134 | 1,245 |
| Floor adjustement | - | - | - | - |
| Total | 353,273 | 343,923 | 364,448 | 28,262 |
(1) Risk-weighted assets for the transitional period (phased-in)
(2) Calculated on the minimum total capital requirements of 8% (Article 92 of the CRR).
(3) Under CET 1 requirements (8.59%) after the supervisory evaluation process (SREP), the requirements amount to EUR 30,346 million euros. Under Total Capital requirements (12.75%), the requirements amount to EUR 45,042 million euros.
(4) Deferred tax assets arising from temporary differences, which are not deducted from eligible own funds (subject to a risk weighting of 250%) are excluded, in accordance with Article 48.4 oh the CRR. This amount is 7,423, 6,548 and 7,279 million euros as of December 31, 2020, Septembre 30, 2020 and December 31, 2019, respectively.
(5) Includes equity, calculated under the simple risk-weighted approach and internal model approach, but excluding significant investments in financial sector entities and insurers that are not deducted from eligible own funds (subject to a risk weighting of 250%), in accordance with Article 48.4 CRR. This amount is 8,143, 7,286 and 7,855 as December 31, 2020, September 30, 2020 and December 31, 2019, respectively.
(6) Exposures clasisified in the FIRB approach correspond to specialized lending exposures. The Group has chosen to use the slotting criteria, in line with article 153.5 of the CRR.
(7) It includes the frontloading to partially cover the regulatory impacts derived from Targeted Review of Internal Models (TRIM) and other regulatory/supervisory impacts.
(8) As of December 31, 2019, the approaches applied to calculate the RWA of securitisations corresponded to the standard and IRB, which were later replaced by the approaches of the new securitization framework defined in EU Regulation 2017/2401. As of December 31, 2020, the applicable approaches for the Group correspond to SEC-ERBA and SEC-IRBA.
Throughout 2020, RWAs have decreased by approximately €12.3 billion compared to December 2019 in aggregate terms, mainly affected by the widespread depreciation of currencies, mainly the Turkish lira and the Mexican peso. Excluding the currency effect, RWAs increased by approximately €18 billion, mainly due to:
- Organic growth in activity characterised by the various relief measures in the form of temporary payment deferrals for customers due to the pandemic, as well as the granting of loans backed by public guarantees or collateral; and the incorporation of regulatory and supervisory impacts.
- The prudential advance of €7.4 billion (equivalent to 25 CET1 basis points) will partially cover the regulatory and supervisory impacts expected in 2021.
Furthermore, as indicated in Section 3.6 of this report, in December 2020, BBVA reverted to using advanced models to calculate capital requirements for operational risk at the consolidated level in geographical areas for which this method was previously used (Spain and Mexico), following authorisation from the European Central Bank's Governing Council on 18 December 2020. At the Group level, this reversal does not significantly impact capital requirement figures nor RWAs for operational risk.
The respective sections of the report explain in more detail the evolution of RWAs by type of risk.
The following is a breakdown of risk-weighted assets and capital requirements broken down by risk type and exposure categories as of December 31, 2020 and December 31, 2019:
Capital requirements by risk type and exposure class
Million Euros
| Capital requirements (2) | RWA's (1) | |||
|---|---|---|---|---|
| Exposure Class and risk type | 12-31-2020 | 12-31-2019 | 12-31-2020 | 12-31-2019 |
| Credit Risk | 14,926 | 16,014 | 186,576 | 200,176 |
| Central goverments or central banks | 2,347 | 2,375 | 29,343 | 29,685 |
| Regional goverments or local authorities | 185 | 132 | 2,317 | 1,644 |
| Public sector entities | 61 | 63 | 768 | 790 |
| Multilateral development banks | 1 | 1 | 11 | 10 |
| International organisations | - | - | - | - |
| Institutions | 626 | 429 | 7,827 | 5,366 |
| Corporates | 6,226 | 6,999 | 77,822 | 87,486 |
| Retail | 2,749 | 3,079 | 34,362 | 38,493 |
| Secured by mortgages on immovable property | 1,022 | 1,199 | 12,769 | 14,983 |
| Exposures in default | 358 | 305 | 4,480 | 3,808 |
| Exposures associated with particularly high risk | 381 | 411 | 4,758 | 5,136 |
| Covered bonds | - | - | - | - |
| Claims on institutions and corporates with a short-term credit assesment | 0 | 0 | 1 | 2 |
| Collective investments undertakings | 0 | 1 | 3 | 8 |
| Other exposures | 970 | 1,021 | 12,120 | 12,767 |
| Total credit risk by standardised approach | 14,926 | 16,019 | 188,576 | 200,237 |
| Credit Risk | 6,938 | 7,125 | 86,729 | 89,061 |
| Central goverments or central banks | 68 | 54 | 849 | 673 |
| Institutions | 567 | 532 | 7,084 | 6,646 |
| Corporates | 4,826 | 4,769 | 60,324 | 59,615 |
| Of which: SMEs | 916 | 998 | 11,452 | 12,478 |
| Of which: Specialised lending | 393 | 433 | 4,912 | 5,407 |
| Of which: Others | 3,517 | 3,338 | 43,960 | 41,730 |
| Retail | 1,478 | 1,770 | 18,471 | 22,128 |
| Of which: Secured by real estate property | 586 | 712 | 7,319 | 8,904 |
| Of which: Qualifying revolving | 479 | 589 | 5,987 | 7,365 |
| Of which: Other SMEs | 103 | 131 | 1,289 | 1,636 |
| Of which: Non-SMEs | 310 | 338 | 3,876 | 4,223 |
| Equity | 1,163 | 1,293 | 14,532 | 16,167 |
| Simple risk weight approach | 146 | 185 | 1,831 | 2,309 |
| Exposure in sufficiently diversified portfolios (RW 190%) | 89 | 86 | 1,114 | 1,070 |
| Exchange traded exposure (RW 190%) | 34 | 67 | 425 | 841 |
| Others (RW 370%) | 23 | 32 | 291 | 399 |
| PD/LGD approach | 316 | 444 | 3,945 | 5,554 |
| Internal models approach | 49 | 36 | 613 | 449 |
| Exposures subject to a 250% risk weight | 651 | 628 | 8,144 | 7,854 |
| Total credit risk by IRB approach | 8,101 | 8,487 | 101,261 | 106,091 |
| Total contributions to the default fund of a CCP | 7 | 3 | 89 | 44 |
| Securitization on exposures | 28 | 74 | 347 | 924 |
| Total credit risk | 23,062 | 24,510 | 288,273 | 306,372 |
| Settlement risk | 0 | - | 1 | - |
| Standardised approach: | 275 | 272 | 3,431 | 3,395 |
| Of which: Price Risk by fixed income exposures | 155 | 197 | 1,943 | 2,461 |
| Of which: Price Risk by Securitization exposures | 0 | 2 | 4 | 21 |
| Of which: Price Risk by correlation | 97 | 51 | 1,210 | 641 |
| Of which: Price Risk by stocks and shares | 21 | 20 | 264 | 248 |
| Of which: Commodities Risk | 1 | 2 | 10 | 24 |
| IRB: Market Risk | 670 | 726 | 8,376 | 9,075 |
| Total trading book risk | 945 | 998 | 11,807 | 12,470 |
| Foreing exchange risk (standardised approach) | 237 | 288 | 2,966 | 3,596 |
| CVA risk | 119 | 122 | 1,485 | 1,529 |
| Operational risk | 2,853 | 3,030 | 35,656 | 37,877 |
| Others (3) | 1,047 | 208 | 13,084 | 2,605 |
| Capital requirements | 28,262 | 29,156 | 353,273 | 364,448 |
(1) Risk-weighted assets according to the transitional period (phased-in).
(2) Calculated on the minimum total capital requirements of 8% (Article 92 of the CRR).
(3) As of report date, it includes the frontloading to partially cover the regulatory impacts derived from Targeted Review of Internal Models (TRIM) and other regulatory/supervisory impacts.
For more detail, see section 2 of the report.