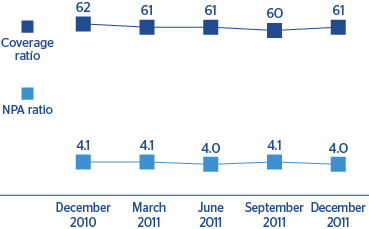

Despite the difficult economic environment in 2011, BBVA was able to improve and stabilize the primary indicators of credit quality. At the close of 2011, the NPA ratio was down to 4.0%, the coverage ratio stood at 61% and the cumulative risk premium was 1.20% (compared with 1.33% at the close of 2010). Thus the Group continued to stand out from the rest of the system with respect to the positive performance of its risk indicators.
As of 31-Dec-2011, the volume of total risks (including contingent liabilities) was €400,709m, a year-on-year increase of 4.3% and a growth over the quarter of 2.6%. The increase can be explained by the acquisition of Garanti and the growth in lending in Mexico and, above all, South America.
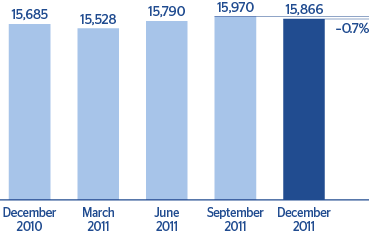
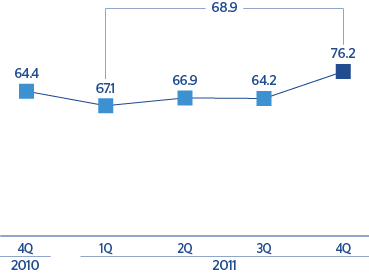
Non-performing assets have remained at practically the same level since December 2009, and at the close of 2011 amounted to €15,866m. The year-on-year increase of 1.2% is the result of the acquisition of Garanti. Without this change in the scope of consolidation, there would have been a slight fall of 0.04%. In terms of variations in NPA over the year, the ratio of recoveries to gross additions to NPA stood at 68.9%, slightly above the level in 2010 (68.6%). This is due to the stable levels of gross additions to NPA and recoveries.
As a result, the NPA ratio for the Group closed 2011 at 4.0%, which is down from the figure at the close of 2010 (4.1%). This rate has remained stable over all the quarters, and has not exceeded the peak of a year ago. By business areas, the United States performed particularly well. Its NPA ratio fell by 81 basis points over the year to 3.6% at the end of 2011 (4.4% in 2010). This is mainly the result of the fall in gross additions to NPA. Also notable was the performance of South America, where the NPA ratio improved by 26 basis points to 2.2% (2.5% in December 2010). In Spain, the NPA ratio ended the year at the same level as the previous year (4.8%). In Mexico, it stood at 3.5% (3.2% as of 31-Dec-2010). In Eurasia, it increased to 1.5% (0.9% at the close of 2010) due to the acquisition of Garanti.
Coverage provisions for customer risk amounted to €9,688m on 31-Dec-2011, a similar figure to that at the end of 2010. Of this total, generic provisions and country risk provisions accounted for €3,218m and represent 33.2% of the total.
Finally, the NPA coverage ratio closed 2011 at 61%. By business areas, the coverage ratio was up in South America to 146% (130% at the end of 2010) and in the United States, where it improved to 73% (61% in 2010). In Spain it closed 2011 at the same level as the previous year, 44%. In Eurasia it fell to 123%, also as a result of the acquisition of Garanti (154% as of 31-Dec-2010); and in Mexico to 120% (152% as of 31-Dec-2010), where its fall is due to the early cancellation of the Federal Government’s Punto Final plan in January 2011. It is also important to note that 62% of the risks are collateralized (58% at the close of 2010).