Annex
Other information: Corporate & Investment Banking
Highlights
- Continued pressure on margins and excess liquidity.
- Lending has remained flat since March 2017.
- Increase of deposits year-to-date.
- Positive trend in earnings, strongly supported by good performance of revenues, cost restraint and lower provisions.
- Stable risk indicators.
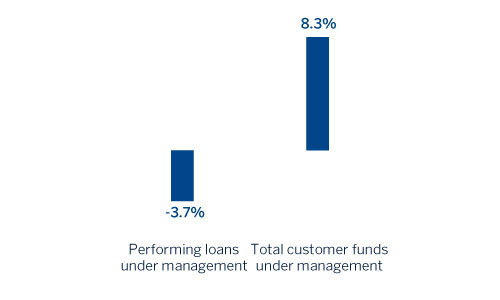
Business activity (1)
(Year-on-year change at constant exchange rate. Data as of 30-06-2017)
(1) Excluding repos.
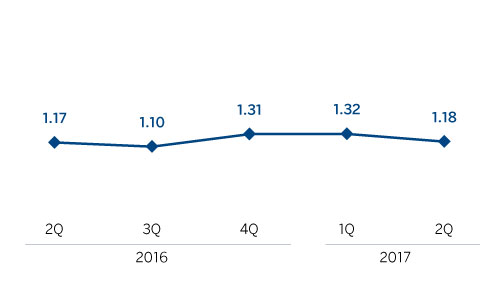
Gross income/ATA
(Percentage. Constant exchange rate)
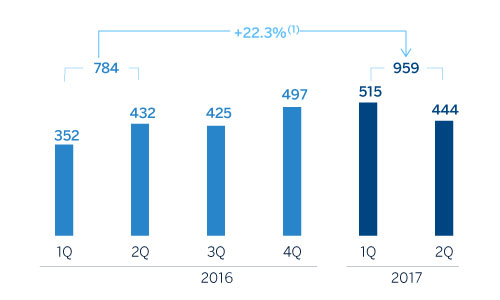
Operating income
(Million euros at constant exchange rate)
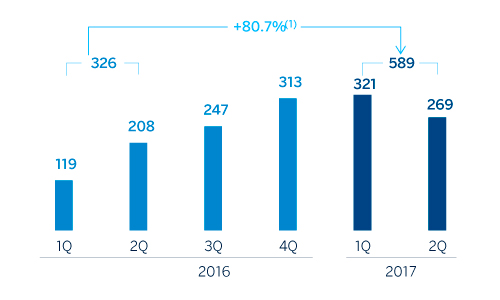
Net attributable profit
(Million euros at constant exchange rate)
(1) At current exchange rate: +19.8.
(1) At current exchange rate: +75.4%.
Breakdown of performing loans under management (1)
(30-06-2017)
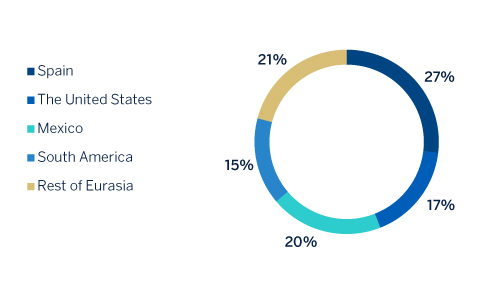
(1) Excluding repos.
Breakdown of customer funds under management (1)
(30-06-2017)
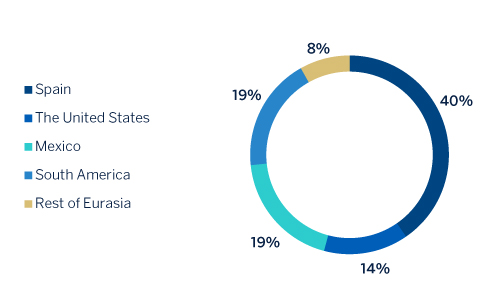
(1) Excluding repos.
Macro and industry trends
In the first half of 2017, and specifically in the second quarter of the year, the financial markets experienced a low level of volatility and lack of financial tension, despite some political uncertainty in developed countries and the expected progress in the normalization of monetary policy by the central banks.
Against this backdrop, in the United States equity market has continued its upward trend, boosted by the still low interest rates and limited volatility.
In Europe, the victory of Macron in France, the lack of an agreement in Italy on electoral reform and the agreement on Greece have given a positive tone to the markets, boosting the equity markets and moderating the country risk premium in the peripherals and in France. Against this backdrop, everything suggests that the ECB is prepared to start a normalization process, given the improvement in the cyclical situation and the disappearance of the risk of deflation. This imminent turning point has had an impact on the market: specifically, long-term interest rates have picked up and the euro has gained against the dollar.
In summary, the environment of low volatility, U.S. rates anchored at moderate levels and the current stability of Chinese growth, have been favorable for emerging assets in general, including currency, equity and fixed-income. However, some specific countries linked to commodities have experienced some tension, slowed down by a change in the trend in the oil price.
In the coming months an increase in volatility cannot be ruled out in the face of expectations that abundant liquidity in the markets will be moderated as central banks make progress in the strategy of switching to a less expansive policy.
Activity
All the comments below on rates of change, for both activity and earnings, will be given at constant exchange rate, unless expressly stated otherwise. These rates, together with changes at the current exchange rate, can be seen in the attached tables of financial statements and relevant business indicators.
The market context remains unchanged, with margins squeezed and surplus liquidity. Lending (performing loans under management) has remained flat since March 2017 (up 0.1%). However, there has been a decrease of 2.2% year-to-date. Performance has varied by geographic area: outstanding growth in the Rest of Europe, Asia, Mexico, Argentina and Chile, and a decline in Spain, the United States, Colombia and Peru.
As regards asset quality indicators, the NPL ratio has improved on December 2016 and remains stable with respect to March 2017 (0.8% as of 30-Jun-2017, 0.8% as of 31-Mar-2017 and 1.0% as of 31-Dec-2016), and the NPL coverage ratio closed at 89% (93% as of the close of the first quarter of 2017 and 79% as of the close of 2016).
There has been a fall of 2.6% in total customer funds over the last three months, strongly focused in Spain (down 2.9%) and the Rest of Eurasia (down 41.5%). The rest of geographical areas have reported significant growth. However, there was an increase of 1.5% year-to-date thanks to their favorable performance in Mexico and South America.
Results
CIB posted a net attributable profit of €589m in the first half of 2017, 80.7% up on the same period of 2016. This is mainly due to good revenue figures, contained expenses and a lower level of loan-loss provisions. The highlights of the income statement are summarized below:
-
Year-on-year increase in gross income of 13.1%, thanks to the results of managing market volatility, above all during the early part of the half-year, and the positive performance of activity with customers. The good performance of this item is bolstered strongly by the Deep Blue commercial initiative, whose aim is to proactively and selectively promote potential covered operations in a context of acquisitions
The corporate finance business in the first half of the year was characterized by a high level of activity and significant marketing effort, thanks to which BBVA has won numerous mandates, some of which will be completed in the coming months.
The Equity Capital Markets (ECM) unit has continued very active in the primary equity market. In addition to the transactions completed in the first quarter, it has participated in the biggest IPO so far this year in Spain (Gestamp); while in Europe BBVA has been present in the most significant transactions in the market, such as the IPO of ALD Automotive in France and the capital increases of Deutsche Bank in Germany and Credit Suisse in Switzerland.
From the point of view of mergers & acquisitions (M&A), the second quarter continued in line with the good outlook of the previous quarter, thus closing a good half year, both in terms number of deals and their volume. There is still a great deal of liquidity and interest on the part of international investors in investing in Spain and Portugal. The M&A market continues to take advantage of low interest rates and the good performance of the Spanish economy.
In addition, BBVA has demonstrated its leading position in green finance with the start-up of the green loans plan, following the success achieved in recent years with the green bonds format. Interest in the green bond market is expected to grow among issuers and financial institutions, which will have increasingly major quantitative and qualitative goals in terms of sustainability. BBVA believes in and is committed to this growing financial market.
-
Cumulative operating expenses have declined by 1.0% on the same period in 2016. The keys to this figure continue to be a slowdown in the growth of personnel and discretionary expenses, and the increase in costs associated with technology investment plan.
-
Lastly, it is worth of note the lower impairment losses on financial assets with respect to the first half of 2016 (when there were increased provisions arising from downgrades in the rating of oil & gas companies in the United States, above all in the first three months of this year).
Financial statements and relevant business indicators (Million euros and percentage)
| Income statement | 1H17 | ∆% | ∆%(1) | 1H16 |
|---|---|---|---|---|
| Net interest income | 545 | (19.0) | (18.5) | 673 |
| Net fees and commissions | 359 | 17.7 | 17.4 | 305 |
| Net trading income | 463 | 92.5 | 103.9 | 241 |
| Other income/expenses | 94 | 5.4 | 4.7 | 89 |
| Gross income | 1,461 | 11.7 | 13.1 | 1,307 |
| Operating expenses | (502) | (0.9) | (1.0) | (507) |
| Personnel expenses | (248) | (5.0) | (5.1) | (262) |
| Other administrative expenses | (200) | 1.6 | 1.4 | (197) |
| Depreciation | (53) | 11.0 | 11.5 | (48) |
| Operating income | 959 | 19.8 | 22.3 | 800 |
| Impairment on financial assets (net) | (24) | (87.6) | (87.8) | (194) |
| Provisions (net) and other gains (losses) | (24) | (48.8) | (51.2) | (47) |
| Profit/(loss) before tax | 911 | 62.7 | 69.1 | 560 |
| Income tax | (255) | 53.0 | 60.4 | (167) |
| Profit/(loss) for the year | 655 | 66.8 | 72.7 | 393 |
| Non-controlling interests | (66) | 16.1 | 23.8 | (57) |
| Net attributable profit | 589 | 75.4 | 80.7 | 336 |
| Balance sheets | 30-06-17 | ∆% | ∆%(1) | 31-12-16 |
|---|---|---|---|---|
| Cash, cash balances at central banks and other demand deposits | 2,337 | (10.1) | (4.3) | 2,600 |
| Financial assets | 75,554 | (8.6) | (8.8) | 82,666 |
| Loans and receivables | 82,259 | (6.5) | (5.4) | 87,988 |
| of which loans and advances to customers | 58,622 | (3.0) | (1.6) | |
| Inter-area positions | - | - | - | - |
| Tangible assets | 32 | (9.0) | (10.4) | 35 |
| Other assets | 2,730 | 9.5 | 13.1 | 2,492 |
| Total assets/liabilities and equity | 162,911 | (7.3) | (6.7) | 175,781 |
| Financial liabilities held for trading and designated at fair value through profit or loss | 51,506 | (6.0) | (5.5) | 54,785 |
| Deposits from central banks and credit institutions | 38,832 | (11.1) | (11.9) | 43,705 |
| Deposits from customers | 45,312 | 1.1 | 2.1 | 44,836 |
| Debt certificates | 481 | (16.2) | (15.4) | 574 |
| Inter-area positions | 19,373 | (19.1) | (16.8) | 23,957 |
| Other liabilities | 3,642 | (5.4) | (5.3) | 3,850 |
| Economic capital allocated | 3,765 | (7.6) | (6.7) | 4,074 |
| Relevant business indicators | 30-06-17 | ∆% | ∆%(1) | 31-12-16 |
|---|---|---|---|---|
| Loans and advances to customers (gross)(2) | 52,991 | (3.9) | (2.4) | 55,160 |
| Non-performing loans and guarantees given | 678 | (16.1) | (12.8) | 808 |
| Customer deposits under management (2) | 37,419 | (0.5) | 0.8 | 37,616 |
| Off-balance sheet funds (3) | 1,367 | 18.1 | 27.0 | 1,157 |
| Efficiency ratio (%) | 34.4 | 37.7 | ||
| NPL ratio (%) | 0.8 | 1.0 | ||
| NPL coverage ratio (%) | 89 | 79 | ||
| Cost of risk (%) | 0.10 | 0.12 |
- (1) Figures at constant exchange rates.
- (2) Excluding repos.
- (3) Includes mutual funds, pension funds and other off-balance sheet funds.