
This section presents and analyzes the most relevant aspects of the Group’s different business areas. Specifically, it shows a summary of the income statement and balance sheet, the business activity figures and the most significant ratios in each of them.
(Click on each country to see information)
SPAIN
Highlights
- Less deleveraging affecting lending, decline in time deposits and increase in more liquid customer deposits and mutual funds.
- Good performance of fees and commissions.
- Positive trend in operating expenses.
- Restructuring costs booked to improve efficiency.
- Stability of risk indicators.


THE UNITED STATES
Highlights
- Lending continues to focus on selective and profitable growth.
- Decline in customer deposits due to good cost management and increased profitability.
- Positive performance of more recurring revenues.
- Moderation of operating expenses and reduction in the impairment of financial assets.
- Stability of risk indicators.

MEXICO
Highlights
- Growth of lending.
- Good performance of customer funds.
- Costs continue to increase below gross income, and double-digit year-on-year growth in net attributable profit.
- Stable asset quality indicators.

TURKEY
Highlights
- Solid growth in lending.
- Good performance of deposits, both in Turkish lira and foreign currency, strongly focused on current and savings accounts.
- Very good performance of more recurring revenues, cost discipline and reduction of loan-loss provisions.
- Improvement of the asset quality indicators, which have performed better than in the rest of the sector.

SOUTH AMERICA
Highlights
- Growth of activity in the region continues to moderate, in line with the current macro economic situation.
- Customer funds are increasing at a good pace.
- Positive trend of more recurring revenues.
- Expenses conditioned by the high level of inflation in some countries.
- The macroeconomic environment continues to influence the behavior of the risk indicators.

REST OF EURASIA
Highlights
- The loan book continues its upward path begun in the fourth quarter of 2016.
- Reduction in the balance of deposits.
- Slight decline in earnings, which compare with an excellent performance during the first half of 2016.
- Improvement in the asset quality indicators.

In 2017 the reporting structure of BBVA Group’s business areas remains basically the same as in 2016:
- Banking activity in Spain includes, as in previous years, the Retail Network in Spain, Corporate and Business Banking (CBB), Corporate & Investment Banking (CIB), BBVA Seguros and Asset Management units in Spain. It also includes the portfolios, finance and structural interest-rate positions of the euro balance sheet.
- Non Core Real Estate covers specialist management in Spain of loans to developers in difficulties and real-estate assets mainly coming from foreclosed assets, originated from both, residential mortgages, as well as loans to developers. New loan production to developers or loans to those that are not in difficulties are managed by Banking activity in Spain.
- The United States includes the Group’s business activity in the country through the BBVA Compass group and the BBVA New York branch.
- Mexico basically includes all the banking, real-estate and insurance businesses carried out by the Group in the country.
- Turkey includes the activity of the Garanti Group. On March 22nd 2017 BBVA completed the acquisition of a 9.95% additional stake in Garanti. Thus, BBVA’s total stake in the said entity at present amounts to 49.85%.
- South America basically includes BBVA’s banking and insurance businesses in the region.
- Rest of Eurasia includes business activity in the rest of Europe and Asia, i.e. the Group’s retail and wholesale businesses in the area.
In addition to the above, all the areas include a remainder made up basically of other businesses and a supplement that includes deletions and allocations not assigned to the units making up the above areas.
Lastly, the Corporate Center is an aggregate that contains the rest of the items that have not been allocated to the business areas, as it corresponds to the Group’s holding function. It includes: the costs of the head offices that have a corporate function; management of structural exchangerate positions; specific issues of equity instruments to ensure adequate management of the Group’s global solvency; portfolios and their corresponding results, whose management is not linked to customer relations, such as industrial holdings; certain tax assets and liabilities; funds due to commitments with employees; goodwill and other intangibles.
In addition to this geographical breakdown, supplementary information is provided for all the wholesale businesses carried out by BBVA, i.e. Corporate & Investment Banking (CIB), in all the geographical areas where it operates. This aggregate business is considered relevant to better understand the Group because of the characteristics of the customers served, the type of products offered and the risks assumed.
Lastly, as usual, in the case of the Americas, Turkey and CIB areas, the results of applying constant exchange rates are given in addition to the year-on-year variations at current exchange rates.
The information by areas is based on units at the lowest level and/or companies making up the Group, which are assigned to the different areas according to the geographical area in which they carry out their activity.
Major income statement items by business area (Million euros)
| Business areas | ||||||||||
|---|---|---|---|---|---|---|---|---|---|---|
| BBVA Group | Banking activity in Spain | Non Core Real Estate | The United States | Mexico | Turkey | South America | Rest of Eurasia | ∑ Business areas | Corporate Center | |
| 1H17 | ||||||||||
| Net interest income | 8,803 | 1,865 | 31 | 1,098 | 2,676 | 1,611 | 1,617 | 95 | 8,993 | (190) |
| Gross income | 12,718 | 3,201 | (6) | 1,468 | 3,507 | 1,998 | 2,252 | 256 | 12,676 | 42 |
| Operating income | 6,407 | 1,492 | (64) | 523 | 2,309 | 1,230 | 1,211 | 102 | 6,804 | (397) |
| Profit/(loss) before tax | 4,033 | 943 | (241) | 405 | 1,469 | 1,010 | 790 | 104 | 4,480 | (447) |
| Net attributable profit | 2,306 | 670 | (191) | 297 | 1,080 | 374 | 404 | 73 | 2,707 | (401) |
| 1H16 | ||||||||||
| Net interest income | 8,365 | 1,941 | 42 | 938 | 2,556 | 1,606 | 1,441 | 86 | 8,610 | (245) |
| Gross income | 12,233 | 3,282 | 11 | 1,330 | 3,309 | 2,154 | 1,999 | 278 | 12,363 | (130) |
| Operating income | 5,901 | 1,493 | (56) | 425 | 2,112 | 1,321 | 1,078 | 110 | 6,482 | (582) |
| Profit/(loss) before tax | 3,391 | 898 | (287) | 240 | 1,300 | 1,022 | 804 | 103 | 4,079 | (688) |
| Net attributable profit | 1,832 | 621 | (207) | 178 | 968 | 324 | 394 | 75 | 2,352 | (520) |
Gross income (1), operating income (1) and net attributable profit breakdown (1) (Percentage. 1H 2017)
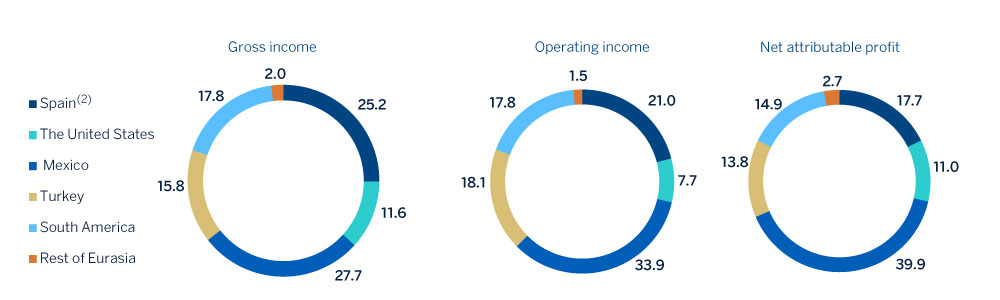
(1) Excludes the Corporate Center.
(2) Includes the areas Banking activity in Spain and Non Core Real Estate.
Major balance sheet items and risk-weighted assets by business area (Million euros)
| Business areas | ||||||||||
|---|---|---|---|---|---|---|---|---|---|---|
| BBVA Group | Banking activity in Spain | Non Core Real Estate | The United States | Mexico | Turkey | South America | Rest of Eurasia | ∑ Business areas | Corporate Center | |
| 30-06-17 | ||||||||||
| Loans and advances to customers | 409,087 | 179,920 | 5,412 | 55,993 | 50,425 | 55,248 | 45,791 | 16,298 | 409,087 | - |
| Deposits from customers | 394,626 | 181,812 | 47 | 59,145 | 54,826 | 46,780 | 44,713 | 7,304 | 394,626 | - |
| Off-balance sheet funds | 96,535 | 58,891 | 5 | - | 21,040 | 3,913 | 12,323 | 363 | 96,535 | - |
| Total assets/liabilities and equity | 702,429 | 316,003 | 12,491 | 80,015 | 99,233 | 83,895 | 73,323 | 18,807 | 683,768 | 18,662 |
| Risk-weighted assets | 373,075 | 107,754 | 10,298 | 60,653 | 48,547 | 67,270 | 53,755 | 14,144 | 362,420 | 10,655 |
| 31-12-16 | ||||||||||
| Loans and advances to customers | 414,500 | 181,137 | 5,946 | 61,159 | 46,474 | 55,612 | 48,718 | 15,325 | 414,370 | 130 |
| Deposits from customers | 401,465 | 180,544 | 24 | 65,760 | 50,571 | 47,244 | 47,927 | 9,396 | 401,465 | - |
| Off-balance sheet funds | 91,287 | 56,147 | 8 | - | 19,111 | 3,753 | 11,902 | 366 | 91,287 | - |
| Total assets/liabilities and equity | 731,856 | 335,847 | 13,713 | 88,902 | 93,318 | 84,866 | 77,918 | 19,106 | 713,670 | 18,186 |
| Risk-weighted assets | 388,951 | 113,194 | 10,870 | 65,492 | 47,863 | 70,337 | 57,443 | 15,637 | 380,836 | 8,115 |
Once the composition of each business area has been defined, certain management criteria are applied, of which the following are particularly important:
- Risk adjusted return. Calculation of risk adjusted return per transaction, customer, product, segment, unit and/or business area is sustained on ERC, which is based on the concept of unexpected loss at a specific confidence level, depending on the Group’s capital adequacy targets. The calculation of the ERC combines credit risk, market risk, structural balance-sheet risk, equity positions, operational risk, fixed-asset risk and technical risks in the case of insurance companies. These calculations are carried out using internal models that have been defined following the guidelines and requirements established under the Basel III capital accord.
- Internal transfer prices. BBVA Group has a transfer prices system whose general principles apply in the Bank’s different entities, business areas and units.
- Allocation of operating expenses. Both direct and indirect costs are allocated to the business areas, except where there is no clearly defined relationship with the businesses, i.e. when they are of a clearly corporate or institutional nature for the Group as a whole.
- Cross-selling. In some cases, adjustments are required to eliminate shadow accounting entries that are registered in the earnings of two or more units as a result of crossselling incentives.
Interest rates (Quarterly averages. Percentage)
| 2017 | 2016 | |||||
|---|---|---|---|---|---|---|
| 2Q | 1Q | 4Q | 3Q | 2Q | 1Q | |
| Official ECB rate | 0.00 | 0.00 | 0.00 | 0.00 | 0.00 | 0.04 |
| Euribor 3 months | (0.33) | (0.33) | (0.31) | (0.30) | (0.26) | (0.19) |
| Euribor 1 year | (0.13) | (0.10) | (0.07) | (0.05) | (0.02) | 0,01 |
| USA Federal rates | 1.05 | 0.80 | 0.55 | 0.50 | 0.50 | 0.50 |
| TIIE (Mexico) | 7.06 | 6.41 | 5.45 | 4.60 | 4.08 | 3.80 |
| CBRT (Turkey) | 11.80 | 10.10 | 7.98 | 7.99 | 8.50 | 8.98 |
Exchange rates (Expressed in currency/euro)
| Year-end exchange rates | Average exchange rates | ||||
|---|---|---|---|---|---|
30-06-17 |
∆% on 30-06-16 |
∆% on 31-12-16 |
1H17 |
∆% on 1H16 |
|
| Mexican peso | 20.5838 | 0.2 | 5.8 | 21.0340 | (4.1) |
| U.S. dollar | 1.1412 | (2.7) | (7.6) | 1.0829 | 3.1 |
| Argentine peso | 18.8080 | (12.0) | (11.8) | 17.0082 | (6.0) |
| Chilean peso | 757.00 | (3.0) | (7.1) | 714.80 | 7.6 |
| Colombian peso | 3,472.22 | (6.8) | (8.9) | 3,164.56 | 10.1 |
| Peruvian sol | 3.6974 | (1.3) | (4.5) | 3.5447 | 6.4 |
| Venezuelan bolivar | 4,310.34 | (72.8) | (56.1) | 4,310.34 | (72.8) |
| Turkish lira | 4.0134 | (20.1) | (7.6) | 3.9388 | (17.3) |