
Results
The BBVA Group generated a cumulative net attributable loss of €15m at the end of September 2020. The good performance of operating income was offset, on one hand, by a greater impairment on financial assets, mainly due to the deterioration of the macroeconomic scenario resulting from COVID-19 and higher provisions and, on the other hand, by the goodwill impairment in the United States in the first quarter of 2020 in the amount of €2,084m, also due to the pandemic. The comparison with the same period of the previous year is impacted by these two factors. Excluding the goodwill impairment in the United States, the Group´s net attributable profit stood at €2,069m, which corresponds to a decrease of 43.6% compared to January-September of 2019. In the third quarter of the year, the net attributable profit stood at €1,141m, which is 79.5% higher than the figure achieved in the second quarter.
CONSOLIDATED INCOME STATEMENT: QUARTERLY EVOLUTION (MILLIONS OF EUROS)
| 2020 | 2019 | ||||||
|---|---|---|---|---|---|---|---|
| 3Q | 2Q | 1Q | 4Q | 3Q | 2Q | 1Q | |
| Net interest income | 4,109 | 4,097 | 4,556 | 4,709 | 4,473 | 4,544 | 4,398 |
| Net fees and commissions | 1,143 | 1,043 | 1,258 | 1,290 | 1,273 | 1,256 | 1,214 |
| Net trading income | 372 | 512 | 594 | 490 | 351 | 116 | 426 |
| Other operating income and expenses | 38 | (91) | 75 | (89) | 22 | (18) | 8 |
| Gross income | 5,663 | 5,561 | 6,484 | 6,400 | 6,120 | 5,897 | 6,046 |
| Operating expenses | (2,570) | (2,594) | (2,918) | (3,082) | (2,946) | (2,952) | (2,922) |
| Personnel expenses | (1,356) | (1,342) | (1,532) | (1,637) | (1,572) | (1,578) | (1,553) |
| Other administrative expenses | (848) | (884) | (988) | (1,039) | (971) | (976) | (977) |
| Depreciation | (366) | (369) | (397) | (406) | (403) | (398) | (392) |
| Operating income | 3,093 | 2,967 | 3,566 | 3,317 | 3,174 | 2,945 | 3,124 |
| Impairment on financial assets not measured at fair value through profit or loss | (928) | (1,571) | (2,575) | (1,169) | (1,172) | (731) | (1,001) |
| Provisions or reversal of provisions | (60) | (228) | (312) | (243) | (113) | (117) | (144) |
| Other gains (losses) | (128) | (101) | (2,113) | (1,444) | (4) | (3) | (22) |
| Profit/(loss) before tax | 1,978 | 1,066 | (1,435) | 460 | 1,886 | 2,095 | 1,957 |
| Income tax | (524) | (269) | (186) | (430) | (488) | (595) | (541) |
| Profit/(loss) for the year | 1,454 | 798 | (1,621) | 31 | 1,398 | 1,500 | 1,416 |
| Non-controlling interests | (312) | (162) | (172) | (186) | (173) | (241) | (234) |
| Net attributable profit | 1,141 | 636 | (1,792) | (155) | 1,225 | 1,260 | 1,182 |
| Earning per share (euros) (1) | 0.16 | 0.08 | (0.29) | (0.04) | 0.17 | 0.17 | 0.16 |
| Of which: | |||||||
| Goodwill impairment in the United States | (2,084) | (1,318) | |||||
| Net attributable profit excluding the goodwill impairment in the United States | 1,141 | 636 | 292 | 1,163 | 1,225 | 1,260 | 1,182 |
| Earning per share excluding the goodwill impairment in the United States (euros) (1) | 0.16 | 0.08 | 0.03 | 0.16 | 0.17 | 0.17 | 0.16 |
- General note: as a result of the interpretation issued by the International Financial Reporting Standards Interpretations Committee (IFRIC) regarding the collecting of interests of written-off financial assets for the purpose of IFRS 9, those collections are presented as reduction of the credit allowances and not as a higher interest income, recognition method applied until December 2019. Therefore, and in order to make the information comparable, the quarterly information of the 2019 income statements has been restated.
- (1) Adjusted by additional Tier 1 instrument remuneration.
CONSOLIDATED INCOME STATEMENT (MILLIONS OF EUROS)
| Jan.-Sep. 20 | ∆% | ∆% at constant exchange rates |
Jan.-Sep. 19 | |
|---|---|---|---|---|
| Net interest income | 12,763 | (4.9) | 4.7 | 13,415 |
| Net fees and commissions | 3,444 | (8.0) | (1.3) | 3,743 |
| Net trading income | 1,479 | 65.5 | 83.7 | 893 |
| Other operating income and expenses | 22 | 76.6 | n.s. | 13 |
| Gross income | 17,708 | (2.0) | 7.4 | 18,064 |
| Operating expenses | (8,082) | (8.4) | (2.4) | (8,820) |
| Personnel expenses | (4,230) | (10.1) | (4.6) | (4,703) |
| Other administrative expenses | (2,720) | (7.0) | 0.0 | (2,924) |
| Depreciation | (1,132) | (5.1) | 0.4 | (1,193) |
| Operating income | 9,626 | 4.1 | 17.3 | 9,244 |
| Impairment on financial assets not measured at fair value through profit or loss | (5,074) | 74.8 | 97.7 | (2,904) |
| Provisions or reversal of provisions | (600) | 60.9 | 68.6 | (373) |
| Other gains (losses) | (2,342) | n.s. | n.s. | (29) |
| Profit/(loss) before tax | 1,609 | (72.9) | (69.4) | 5,938 |
| Income tax | (979) | (39.7) | (32.0) | (1,623) |
| Profit/(loss) for the year | 631 | (85.4) | (83.5) | 4,315 |
| Non-controlling interests | (646) | (0.3) | 18.0 | (648) |
| Net attributable profit | (15) | n.s. | n.s. | 3,667 |
| Earning per share (euros) (1) | (0.05) | 0.51 | ||
| Of which: | ||||
| Goodwill impairment in the United States | (2,084) | |||
| Net attributable profit excluding the goodwill impairment in the United States | 2,069 | (43.6) | (36.6) | 3,667 |
| Earning per share excluding the goodwill impairment in the United States (euros) (1) | 0.27 | 0.51 |
- General note: as a result of the interpretation issued by the International Financial Reporting Standards Interpretations Committee (IFRIC) regarding the collecting of interests of written-off financial assets for the purpose of IFRS 9, those collections are presented as reduction of the credit allowances and not as a higher interest income, recognition method applied until December 2019. Therefore, and in order to make the information comparable, the first six months information of the 2019 income statements has been restated.
- (1) Adjusted by additional Tier 1 instrument remuneration.
Unless expressly indicated otherwise, to better understand the changes in the main headings of the Group's income statement, the year-on-year percentage changes provided below refer to constant exchange rates.
Gross income
Gross income increased by 7.4% year-on-year, supported by the good performance of net interest income and NTI, which managed to offset the lower contribution from net fees and commissions.
GROSS INCOME (MILLIONS OF EUROS)
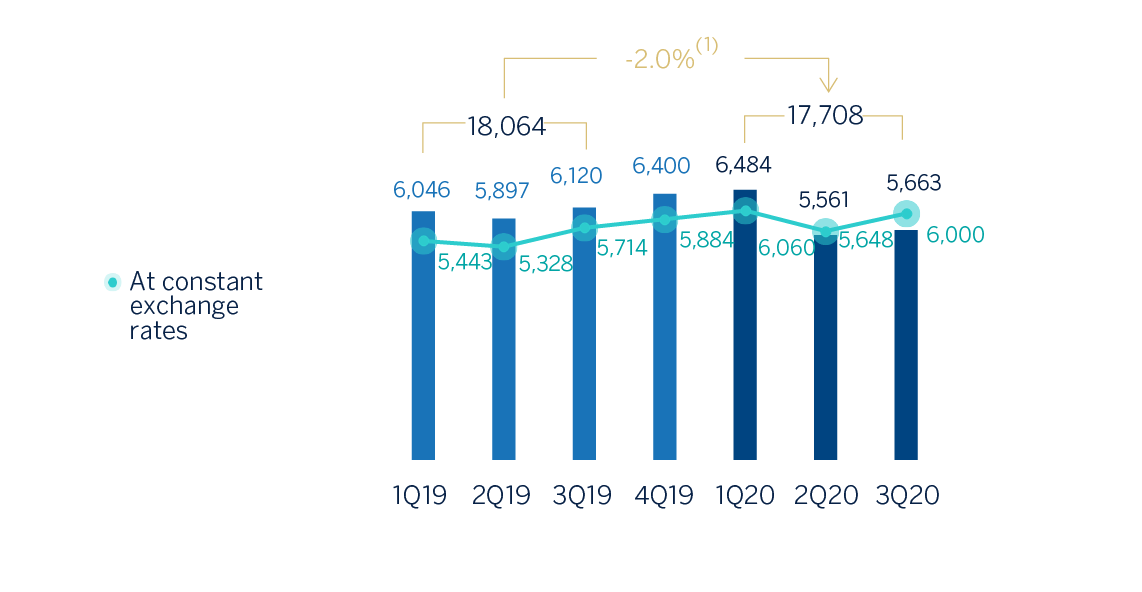
(1) At constant exchange rates: +7.4%.
Net interest income grew by 4.7% year-on-year, supported by the good performance, mainly, from Turkey and South America and, to a lesser extent, Rest of Eurasia and Spain, which offset the smaller contribution from the United States and Mexico as a result of the cuts in the benchmark interest rates by the banking authorities in these countries.
Net fees and commissions were affected by the lower activity resulting from the pandemic. The areas that showed year-on-year reductions were South America and, especially, Mexico and Turkey, the latter was also affected by changes in the regulation regarding fees and commissions charged, which have been applied since March 2020. In Spain, the United States, and Rest of Eurasia, net fees and commissions grew year-on-year (up 4.8%, 3.3% and 10.8%, respectively) despite not charging some fees and commissions as one of the measures to support customers through the worst moments of the pandemic.
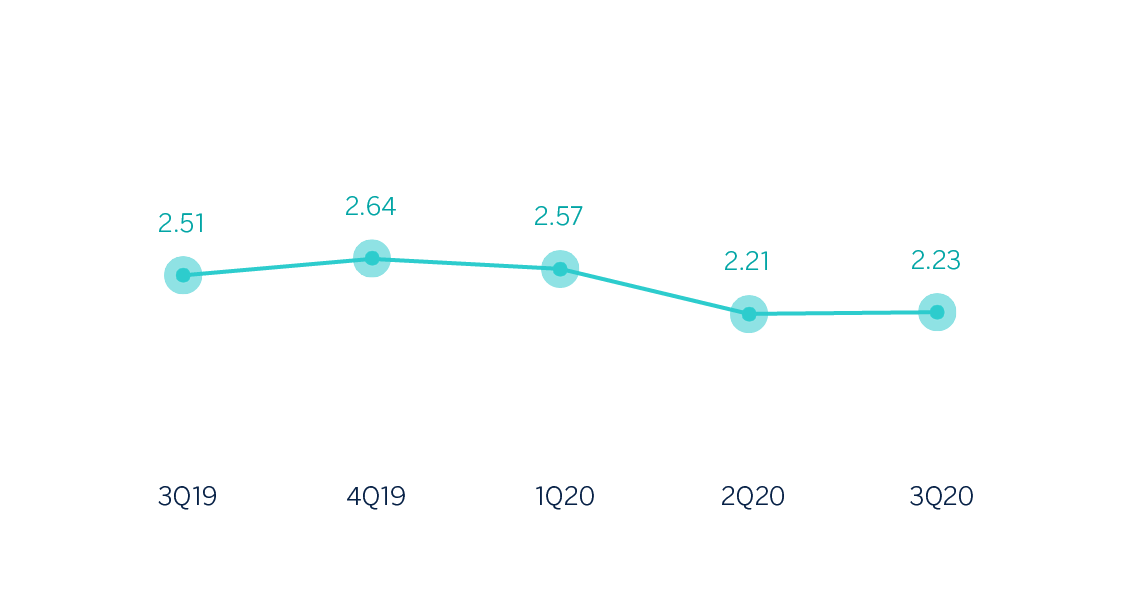
NET INTEREST INCOME/ATAS (PERCENTAGE)
NET INTEREST INCOME PLUS FEES AND COMMISSIONS (MILLIONS OF EUROS)
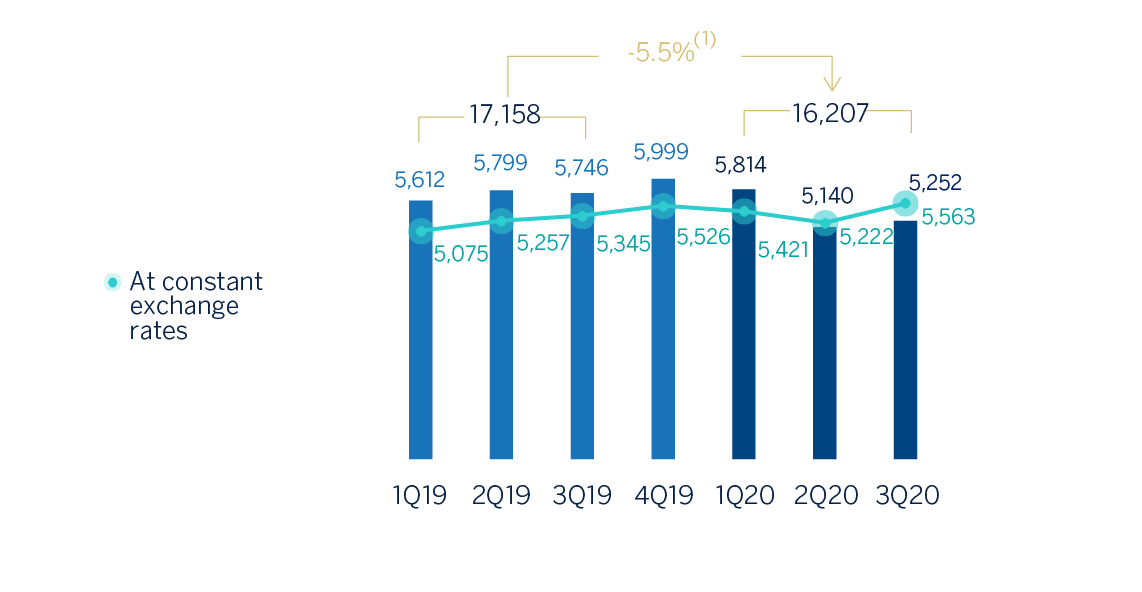
(1) At constant exchange rates: +3.4%.
NTI recorded a year-on-year increase of 83.7%, mainly due to the foreign-exchange rate hedging gains, registered at the Corporate Center, and higher results generated during the first nine months of the year by all business areas, with the exception of South America, due to the positive effect of the sale of the Prisma Medios de Pago S.A. stake in the cumulative net attributable profit as of September 2019.
The other operating income and expenses line registered €22m between January and September of 2020 compared to €13m registered 12 months earlier. This favorable performance is due to the lower adjustment for inflation in Argentina, which offsets the greater contribution to the Single Resolution Fund (SRF) in Spain.
Operating income
Operating expenses fell 2.4% year-on-year as a result of the containment plans implemented by all business areas and also due to the lower execution of some discretionary expenses since the beginning of the pandemic. It is worth mentioning the cost reduction in Spain and the Corporate Center.
OPERATING EXPENSES (MILLIONS OF EUROS)
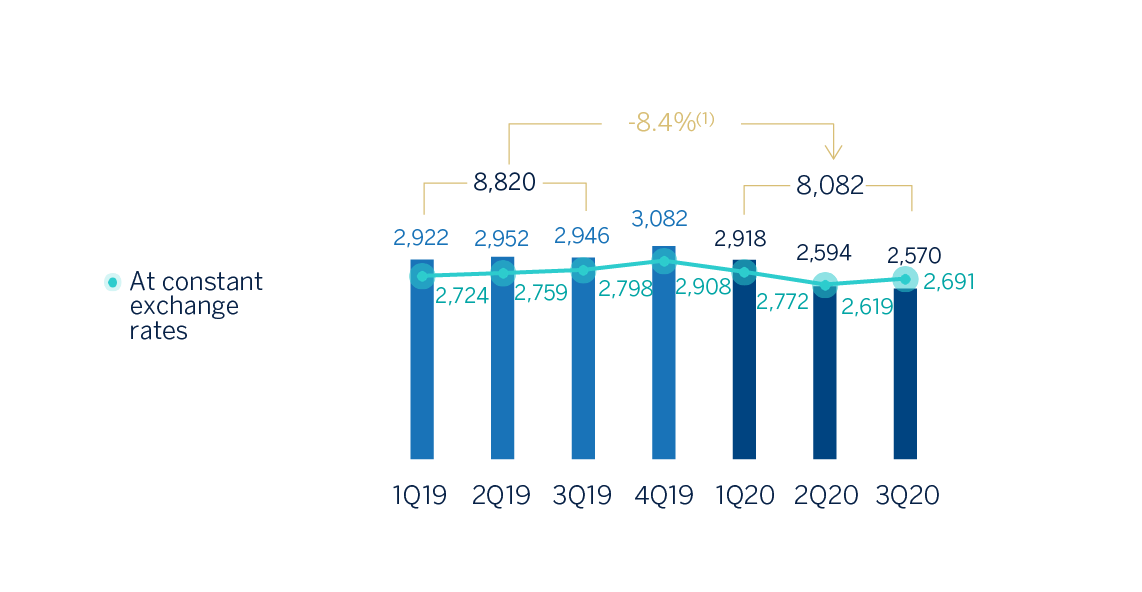
(1) At constant exchange rates: -2.4%.
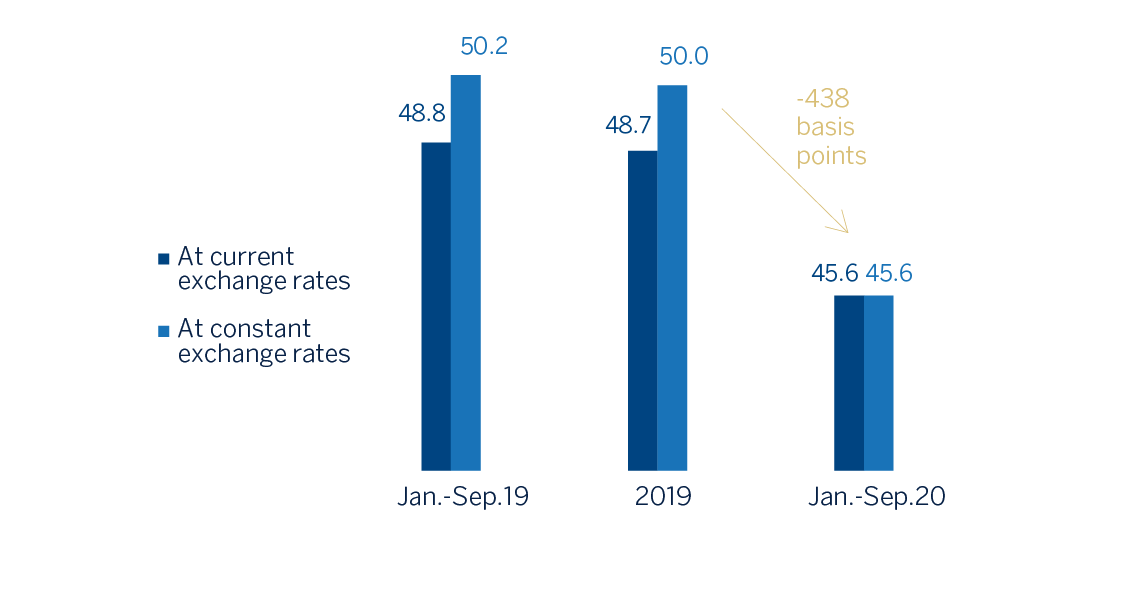
As a result, the efficiency ratio stood at 45.6% as of September 30, 2020, significantly below the level reached last year (48.8%), and operating income grew by 17.3% year-on-year.
EFFICIENCY RATIO (PERCENTAGE)
OPERATING INCOME (MILLIONS OF EUROS)
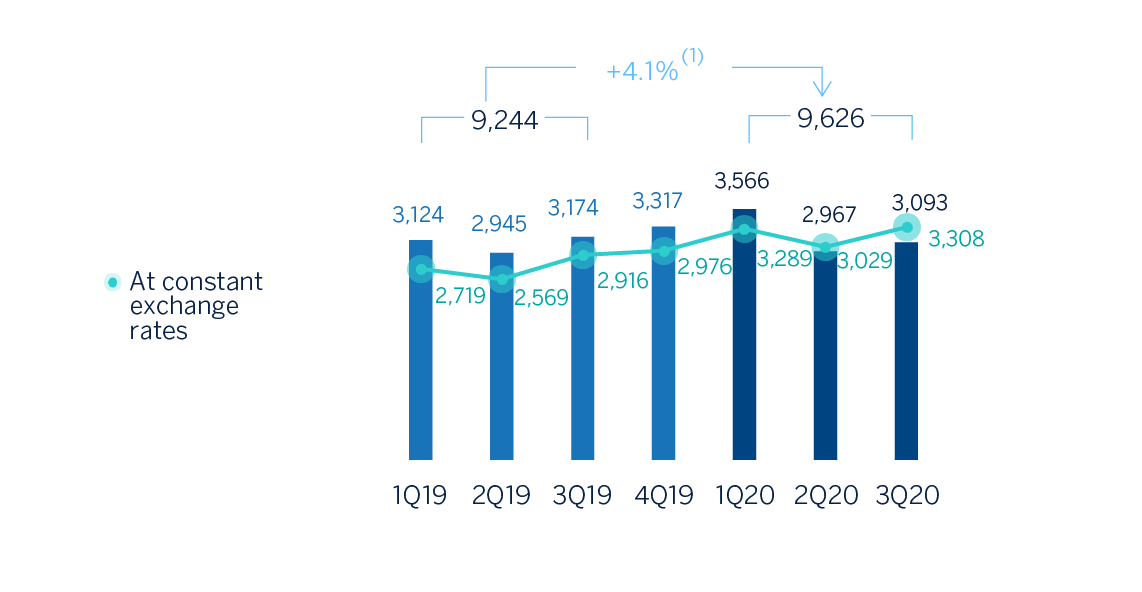
(1) At constant exchange rates: +17.3%.
Provisions and other
The impairment on financial assets not measured at fair value through profit and loss (impairment on financial assets) closed September with a negative balance in accumulated terms of €5,074m, which is 97.7% above the one recorded in the same period of the previous year, as a consequence of the negative impacts resulting from COVID-19.
IMPAIRMENT ON FINANCIAL ASSESTS (MILLIONS OF EUROS)
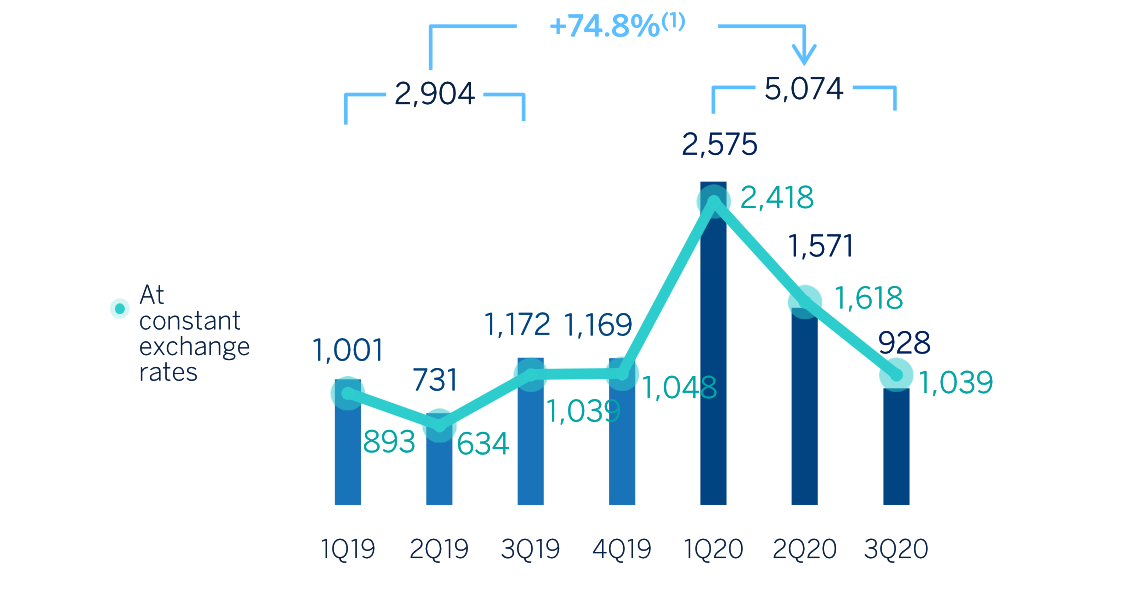
(1) At constant exchange rates: +97.7%.
Provisions or reversal of provisions (hereinafter provisions) closed September with an accumulated negative balance of €600m, which is 68.6% higher compared to the same period of the previous year, mainly due to higher provisions in Spain.
The other gains (losses) line mainly reflects the aforementioned goodwill impairment in the United States and registered an accumulated negative balance of €2,342m between January and September 2020.
Results
As a result of the above, the Group's cumulative net attributable loss from January to September 2020 amounted to €15m, which compares negatively with the profit of €3,667m obtained in the same period of the previous year. This comparison is affected by the increase in the impairment on financial assets, as well as by the goodwill impairment in the United States, being both a result of the impact of COVID-19.
NET ATTRIBUTABLE PROFIT (MILLIONS OF EUROS)
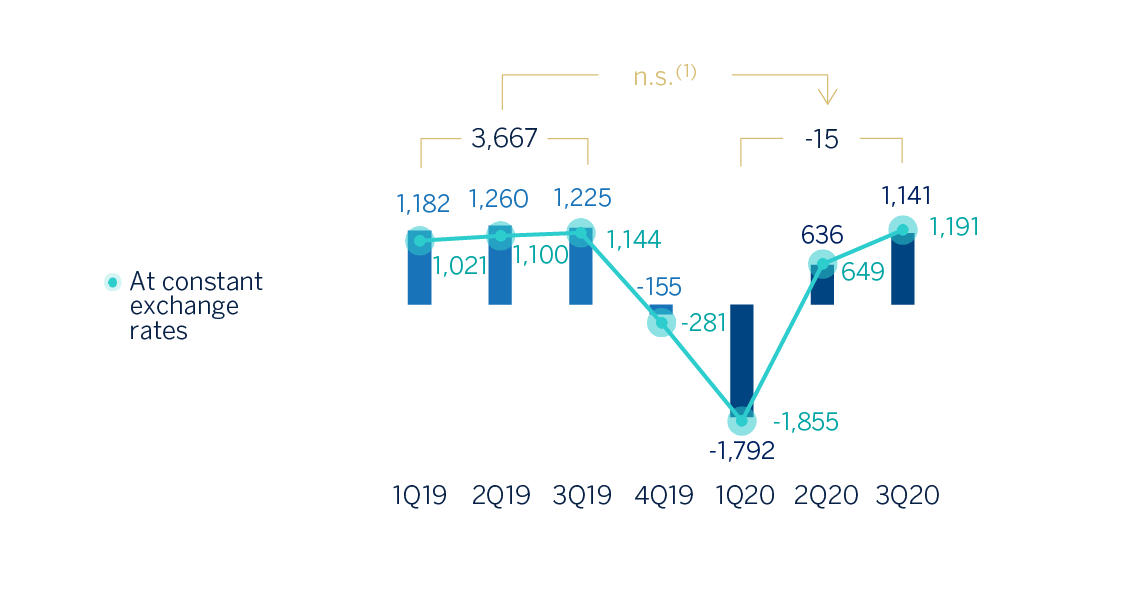
(1) At constant exchange rates: n.s.
NET ATTRIBUTABLE PROFIT EXCLUDING THE UNITED STATES GOODWILL IMPAIRMENT (MILLIONS OF EUROS)
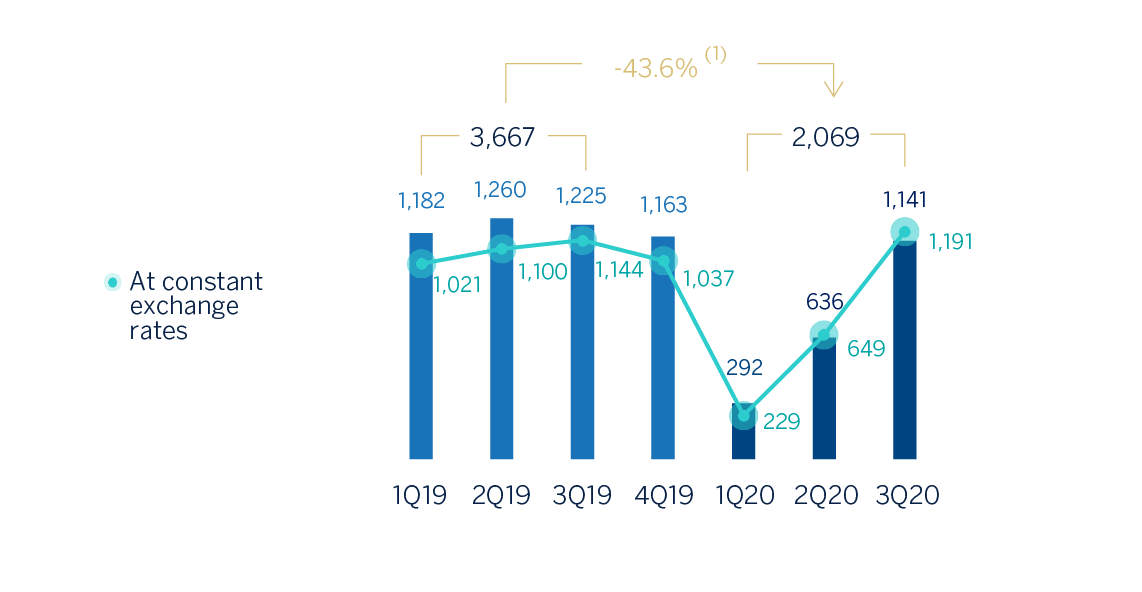
(1) At constant exchange rates: -36.6%.
The net attributable profit, in millions of euros, accumulated at the end of September 2020 by the different business areas that make up the Group were: 440 in Spain, 115 in the United States, 1,204 in Mexico, 503 in Turkey, 326 in South America and 96 in Rest of Eurasia.
TANGIBLE BOOK VALUE PER SHARE AND DIVIDENDS (1) (EUROS)
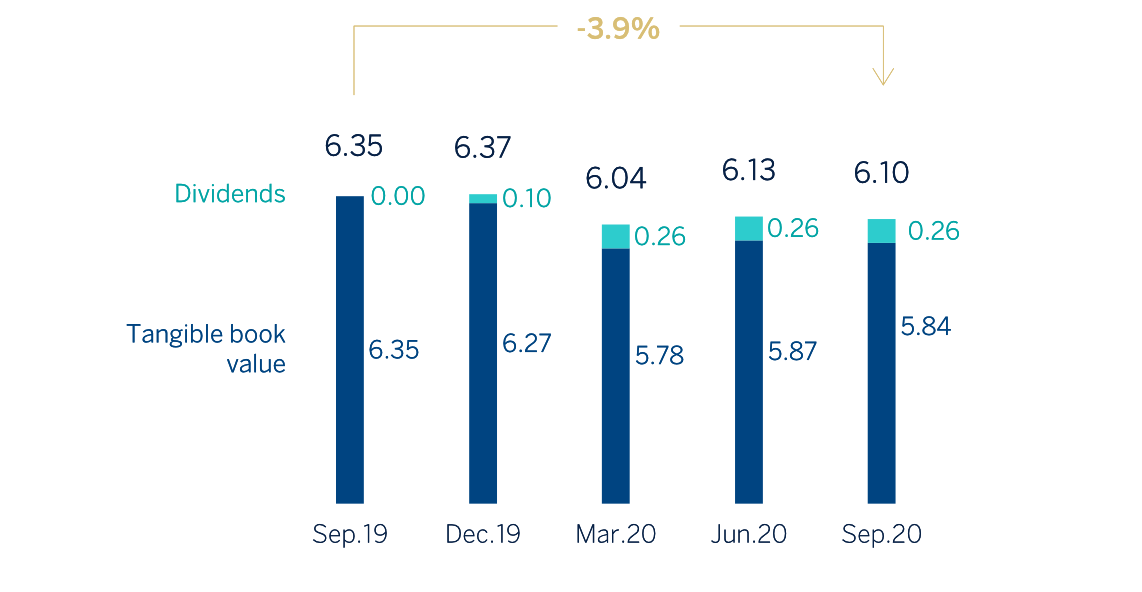
(1) Replenishing dividends paid in the period.
EARNING PER SHARE (1) (EUROS)
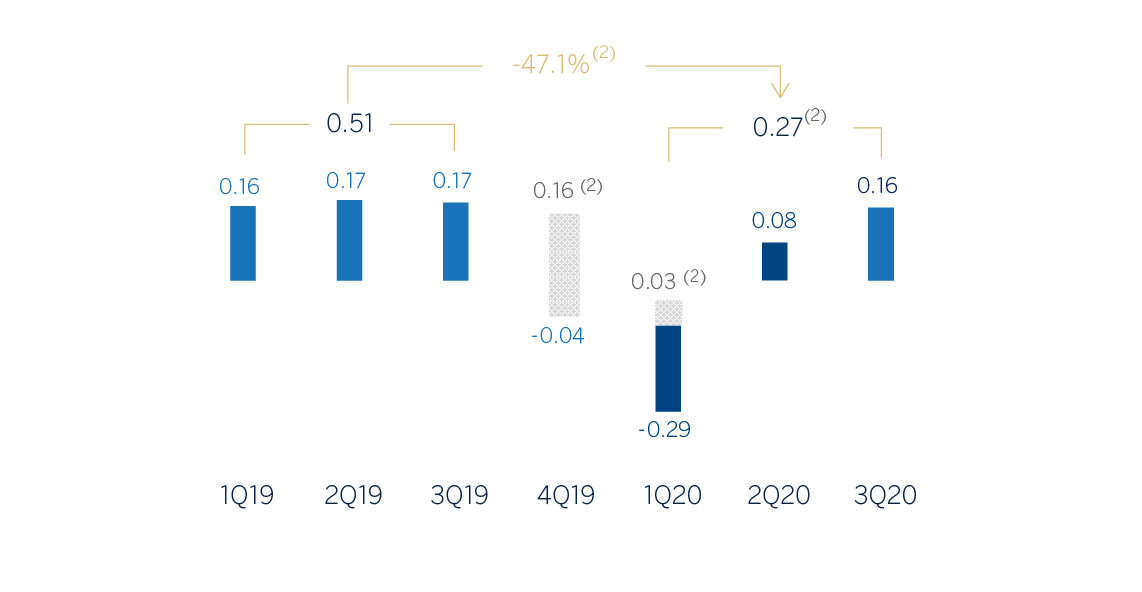
(1) Adjusted by additional Tier 1 instrument remuneration.
(2) Excluding the goodwill impairment in the United States in 4Q19 and 1Q20.
ROE AND ROTE (1) (PERCENTAGE)
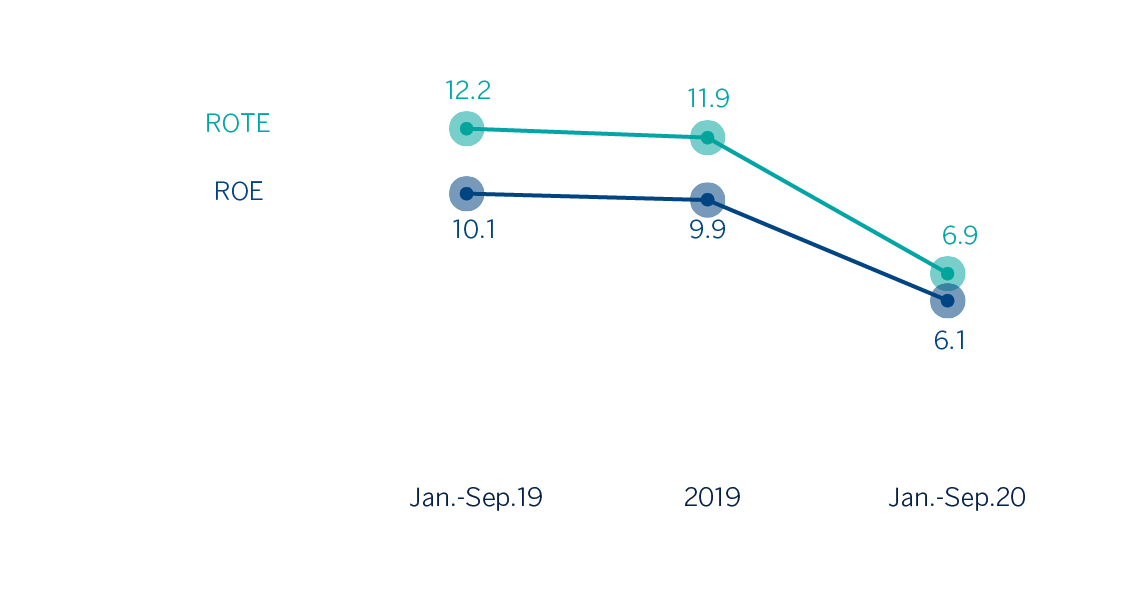
(1) Ratios excluding the goodwill impairment in the United States in 2019 and Jan.-Sep.
ROA AND RORWA (1) (PERCENTAGE)
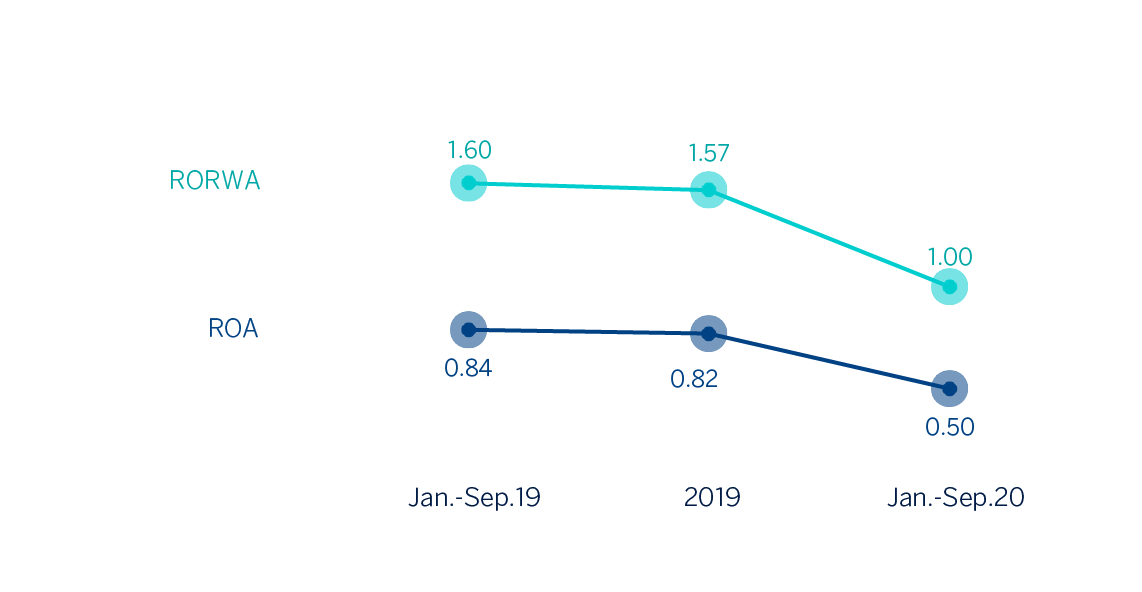
(1) Ratios excluding the goodwill impairment in the United States in 2019 and Jan.-Sep.20.