Business areas
Spain
€4,382 Mill.*
+3.2%
Millions of euros and year-on-year changes. Balances as of 30-09-20.
Highlights
- Activity growth, partly driven by the government support programs.
- Significant improvement in operating income due to an increase in NTI and commissions, as well as a decrease in operating expenses.
- Risk indicators contained.
- Net attributable profit affected by the level of the impairment on financial assets.
Results
Net interest income
2,675Gross income
4,382Operating income
2,105Net attributable profit
440Activity (1)
Performing loans and advances to customers under mangement
+0.8%Customers funds under management
+4.6%
Risks
NPL coverage ratio
NPL ratio
Cost of risk
(1) Excluding repos.
(2) Year on year changes.
The United States
€2,374 Mill.*
-2.4%
Millions of euros and year-on-year changes at constant exchange rate. Balances as of 30-09-20.
Highlights
- Increase in loans on the commercial portfolios, whereas retail segments have been affected by the pandemic. Strong increase in customer deposits.
- The cost of risk continues to improve.
- Positive evolution of fees and commissions and NTI.
- Lower net attributable profit due to a fall in net interest income and a significant increase in the impairment on financial assets line.
Results
Net interest income
1,708Gross income
2,374Operating income
960Net attributable profit
115Activity (1)
Performing loans and advances to customers under mangement
+6.3%Customers funds under management
+17.0%
Risks
NPL coverage ratio
NPL ratio
Cost of risk
(1) Excluding repos.
(2) Year on year changes at constant exchange rate.
Mexico
€5,231 Mill.*
+0.4%
Millions of euros and year-on-year changes at constant exchange rate. Balances as of 30-09-20.
Highlights
- Evolution of activity supported by the good performance of the wholesale portfolio.
- Improvement in the risk indicators.
- Stability of the main margins.
- Net attributable profit affected by the significant increase in the impairment on financial assets line.
Results
Net interest income
4,036Gross income
5,231Operating income
3,489Net attributable profit
1,204Activity (2)
Performing loans and advances to customers under mangement
+4.2%Customers funds under management
+14.4%
Risks
NPL coverage ratio
NPL ratio
Cost of risk
(2) Excluding repos.
(1) Year on year changes at constant exchange rate.
Turkey
€2,866 Mill.*
+34.8%
Millions of euros and year-on-year changes at constant exchange rate. Balances as of 30-09-20.
Highlights
- Credit growth driven by Turkish lira loans. Strong growth in foreign currency deposits.
- Outstanding performance of recurring revenue and efficiency ratio improvement.
- Small rise in the NPL ratio year-to-date.
- Double digit growth in the main income statement margins.
Results
Net interest income
2,218Gross income
2,866Operating income
2,075Net attributable profit
503Activity (1)
Performing loans and advances to customers under mangement
+34.3%Customers funds under management
+36.3%
Risks
NPL coverage ratio
NPL ratio
Cost of risk
(1) Excluding repos.
(2) Year on year changes at constant exchange rate.
South America
€2,441 Mill.*
+0.1%
Millions of euros and year-on-year changes at constant exchange rates. Balances as of 30-09-20.
Highlights
- Activity growth impacted by support measures from the different governments.
- Year-on-year net interest income growth.
- Year-on-year decrease in NTI due to the sale of the Prisma stake in 2019.
- Net attributable profit affected by the increase in the impairment on financial assets line.
Results
Net interest income
2,069Gross income
2,441Operating income
1,397Net attributable profit (3)
326Activity (1)
Performing loans and advances to customers under mangement
+13.1%Customers funds under management
+19.4%
Risks
NPL coverage ratio
NPL ratio
Cost of risk
(1) Excluding repos.
(2) Year on year changes at constant exchange rates.
Rest of Eurasia
€388 Mill.*
+14.6%
Millions of euros and year-on-year changes. Balances as of 30-09-20.
Highlights
- Moderation of lending activity growth.
- Improved risk indicators.
- Increased recurring income and good performance of NTI.
- Reduction of operating expenses.
Results
Net interest income
159Gross income
388Operating income
184Net attributable profit
96Activity (1)
Performing loans and advances to customers under mangement
+13.7%Customers funds under management
+5.4%
Risks
NPL coverage ratio
NPL ratio
Cost of risk
(1) Excluding repos.
(2) Year on year changes.
* Gross income
This section presents and analyzes the most relevant aspects of the Group's different business areas. Specifically, for each one of them, it shows a summary of the income statement and balance sheet, the business activity figures and the most significant ratios.
At the end of the first half of 2020, BBVA Group’s business areas reporting structure continued to be the same as the one presented at the end of 2019. BBVA Group's business areas are summarized below:
- Spain mainly includes the banking and insurance businesses that the Group carries out in this country. In April, BBVA reached an agreement with Allianz, Compañía de Seguros y Reaseguros, S.A., to create a bancassurance alliance, with the aim of jointly promoting the non-life insurance business in Spain, excluding the health insurance line, and constituting a newly created insurance company. The closing of the operation is subject to the approval of the competent regulatory authorities.
- The United States includes the business of BBVA USA and the activity of the BBVA, S.A. branch in New York.
- Mexico includes banking and insurance businesses in this country, as well as the activity that BBVA Mexico carries out through its branch in Houston.
- Turkey reports the activity of the group Garanti BBVA that is mainly carried out in this country and, to a lesser extent, in Romania and the Netherlands.
- South America basically includes banking and insurance businesses in the region. With respect to the agreement reached with Banco GNB Paraguay, S.A., for the sale of BBVA Paraguay, the closing of the transaction is subject to obtaining the authorizations from the competent regulatory authorities.
- Rest of Eurasia includes the banking business activity carried out in Asia and in Europe, excluding Spain.
The Corporate Center contains the centralized functions of the Group, including: the costs of the head offices with a corporate function; management of structural exchange rate positions; some equity instruments issuances to ensure an adequate management of the Group's global solvency. It also includes portfolios whose management is not linked to customer relationships, such as industrial holdings; certain tax assets and liabilities; funds due to commitments to employees; goodwill and other intangible assets.
In addition to these geographical breakdowns, supplementary information is provided for the wholesale business carried out by BBVA, Corporate & Investment Banking (CIB), in the countries where it operates. This business is relevant to have a broader understanding of the Group's activity and results due to the important features of the type of customers served, products offered and risks assumed.
The information by business area is based on units at the lowest level and/or companies that comprise the Group, which are assigned to the different areas according to the main region or company group in which they carry out their activity.
As usual, in the case of the different business areas in America, in Turkey and in CIB, the results applying constant exchange rates are given as well as the year-on-year variations at current exchange rates.
Main income statement line items by business area (Millions of euros)
| Business areas | |||||||||
|---|---|---|---|---|---|---|---|---|---|
| BBVA Group |
Spain | The United States |
Mexico | Turkey | South America |
Rest of Eurasia |
∑ Business areas | Corporate Center | |
| 30-09-20 | |||||||||
| Net interest income | 12,763 | 2,675 | 1,708 | 4,036 | 2,218 | 2,069 | 159 | 12,865 | (103) |
| Gross income | 17,708 | 4,382 | 2,374 | 5,231 | 2,866 | 2,441 | 388 | 17,682 | 26 |
| Operating income | 9,626 | 2,105 | 960 | 3,489 | 2,075 | 1,397 | 184 | 10,210 | (584) |
| Profit/(loss) before tax | 1,609 | 600 | 117 | 1,692 | 1,325 | 647 | 128 | 4,509 | (2,900) |
| Net attributable profit | (15) | 440 | 115 | 1,204 | 503 | 326 | 96 | 2,684 | (2,699) |
| 30-09-19 | |||||||||
| Net interest income | 13,415 | 2,661 | 1,813 | 4,599 | 2,029 | 2,376 | 130 | 13,607 | (193) |
| Gross income | 18,064 | 4,247 | 2,442 | 5,912 | 2,548 | 2,884 | 338 | 18,372 | (308) |
| Operating income | 9,244 | 1,806 | 989 | 3,954 | 1,661 | 1,733 | 126 | 10,269 | (1,025) |
| Profit/(loss) before tax | 5,938 | 1,489 | 588 | 2,702 | 982 | 1,137 | 129 | 7,027 | (1,089) |
| Net attributable profit | 3,667 | 1,064 | 478 | 1,965 | 380 | 569 | 103 | 4,558 | (891) |
- General note: as a result of the interpretation issued by the International Financial Reporting Standards Interpretations Committee (IFRIC) regarding the collecting of interests of written-off financial assets for the purpose of IFRS 9, those collections are presented as reduction of the credit allowances and not as a higher interest income, recognition method applied until December 2019. Therefore, and in order to make the information comparable, the first nine months information of the 2019 income statements has been restated.
GROSS INCOME(1), OPERATING INCOME(1) AND NET ATTRIBUTABLE PROFIT(1) BREAKDOWN (PERCENTAGE. JANUARY-SEPTEMBER 2020)

(1) Excludes the Corporate Center.
Major balance-sheet items and risk-weighted assets by business area (Millions of euros)
| Business areas | |||||||||||
|---|---|---|---|---|---|---|---|---|---|---|---|
| BBVA Group |
Spain | The United States |
Mexico | Turkey | South America |
Rest of Eurasia |
∑ Business areas | Corporate Center | Deletions | NCA&L(1) | |
| 30-09-20 | |||||||||||
| Loans and advances to customers |
365,605 | 166,568 | 61,987 | 47,788 | 36,797 | 33,678 | 20,938 | 367,757 | 279 | (1,429) | (1,001) |
| Deposits from customers | 395,132 | 195,682 | 73,297 | 50,770 | 38,130 | 36,024 | 4,597 | 398,500 | 298 | (2,267) | (1,399) |
| Off-balance sheet funds | 100,040 | 60,891 | - | 21,328 | 3,431 | 13,861 | 529 | 100,040 | - | - | - |
| Total assets/ liabilities and equity | 727,014 | 403,527 | 98,193 | 101,416 | 58,128 | 55,533 | 24,888 | 741,224 | 40,795 | (55,004) | - |
| APRs | 343,929 | 107,046 | 63,021 | 53,443 | 50,131 | 40,087 | 18,855 | 332,583 | 11,345 | - | - |
| 31-12-19 | |||||||||||
| Loans and advances to customers |
382,360 | 167,332 | 63,162 | 58,081 | 40,500 | 35,701 | 19,669 | 384,445 | 813 | (1,692) | (1,205) |
| Deposits from customers | 384,219 | 182,370 | 67,525 | 55,934 | 41,335 | 36,104 | 4,708 | 387,976 | 308 | (2,598) | (1,467) |
| Off-balance sheet funds | 107,803 | 66,068 | - | 24,464 | 3,906 | 12,864 | 500 | 107,803 | - | - | - |
| Total assets/ liabilities and equity | 698,690 | 365,380 | 88,529 | 109,079 | 64,416 | 54,996 | 23,257 | 705,656 | 49,886 | (56,852) | - |
| APRs | 364,448 | 104,911 | 65,170 | 59,299 | 56,642 | 45,413 | 17,989 | 349,422 | 15,026 | - | - |
- (1) Non-current assets and liabilities held for sale (NCA&L) from BBVA Paraguay.
The balance sheet includes a column, which represents the deletions and balance sheet adjustments between the different business areas, especially in terms of the relationship between the areas in which the parent company operates, i.e. Spain, Rest of Eurasia and the United States, and the Corporate Center.
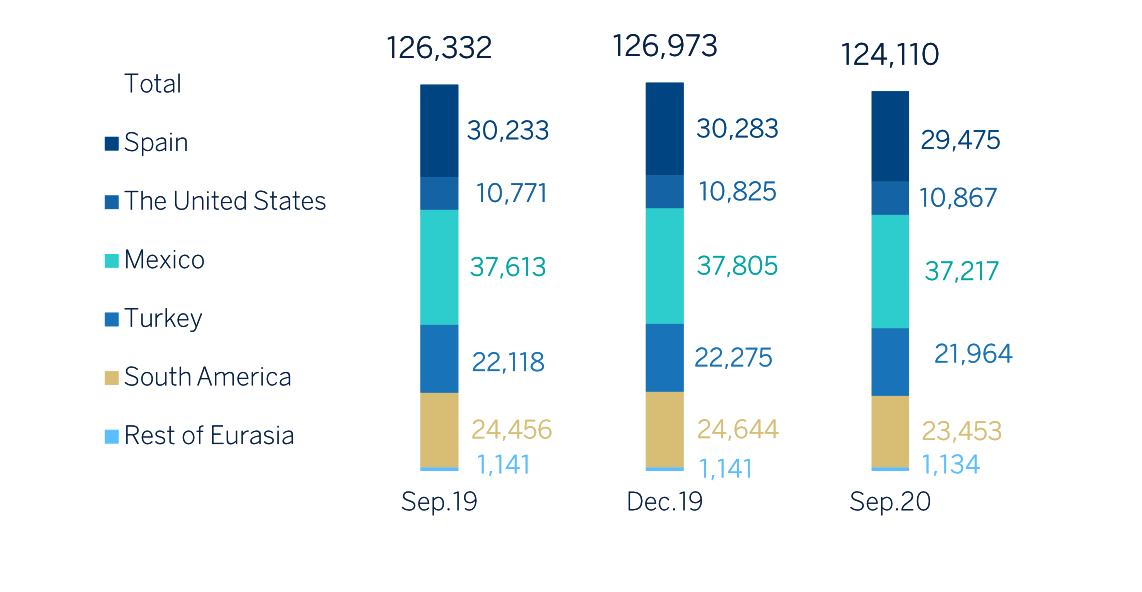
Number of employees

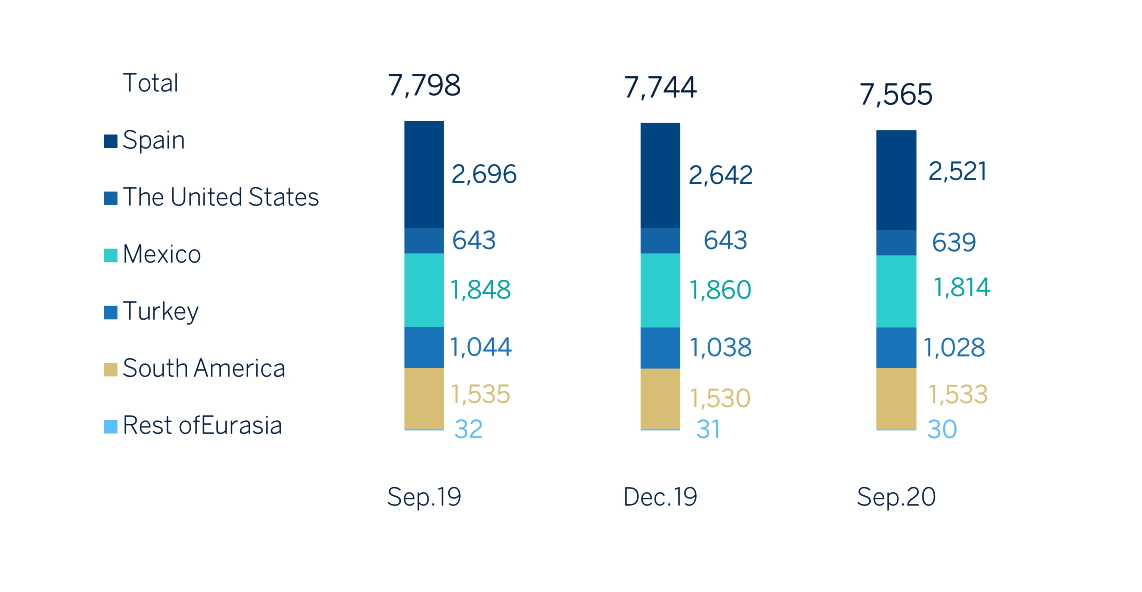
Number of branches

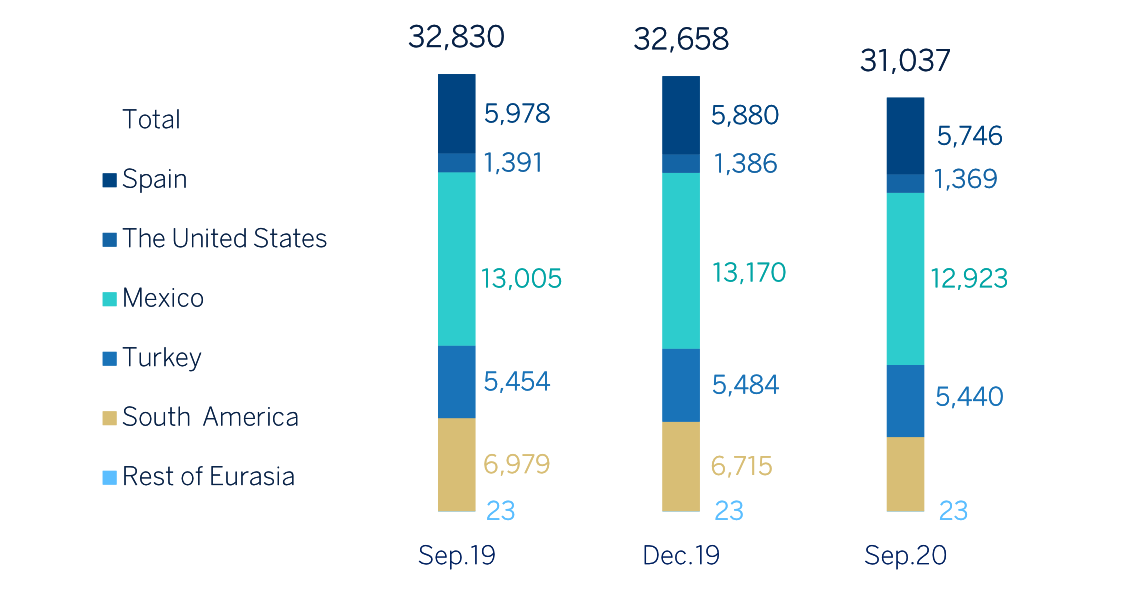
Number of ATMs

