
Other information: Corporate & Investment Banking
Highlights
- Slight increase in lending activity
- Excellent performance of NTI and favorable evolution of recurring income
- Efficiency improvement
- Year-on-year increase in net attributable profit
Business activity (1)
(VARIATION AT CONSTANT EXCHANGE RATES COMPARED TO
31-12-22)
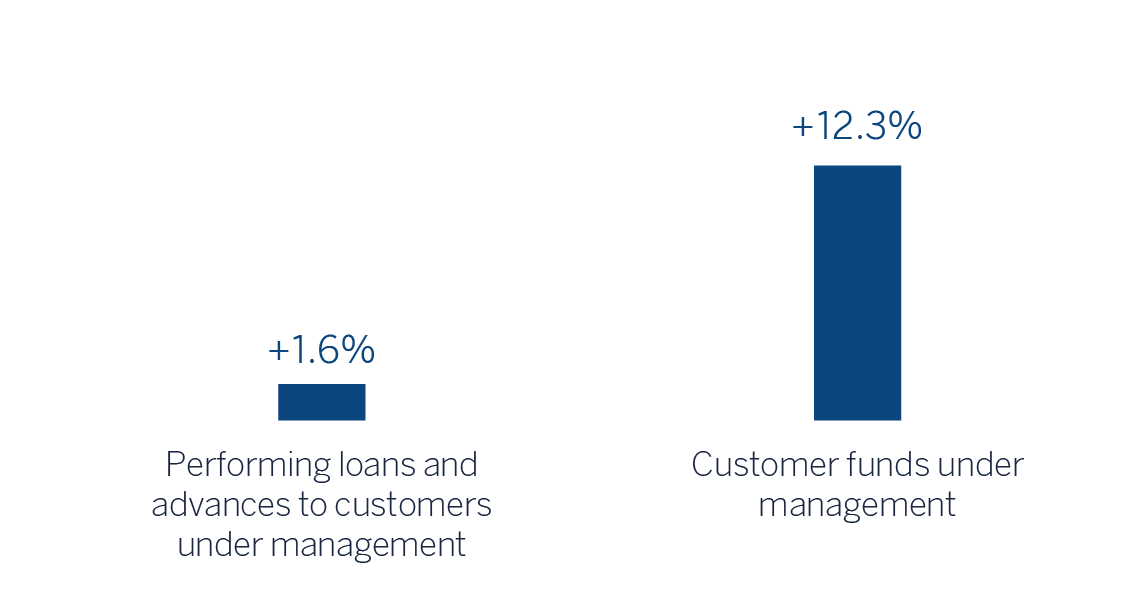
(1) Excluding repos.
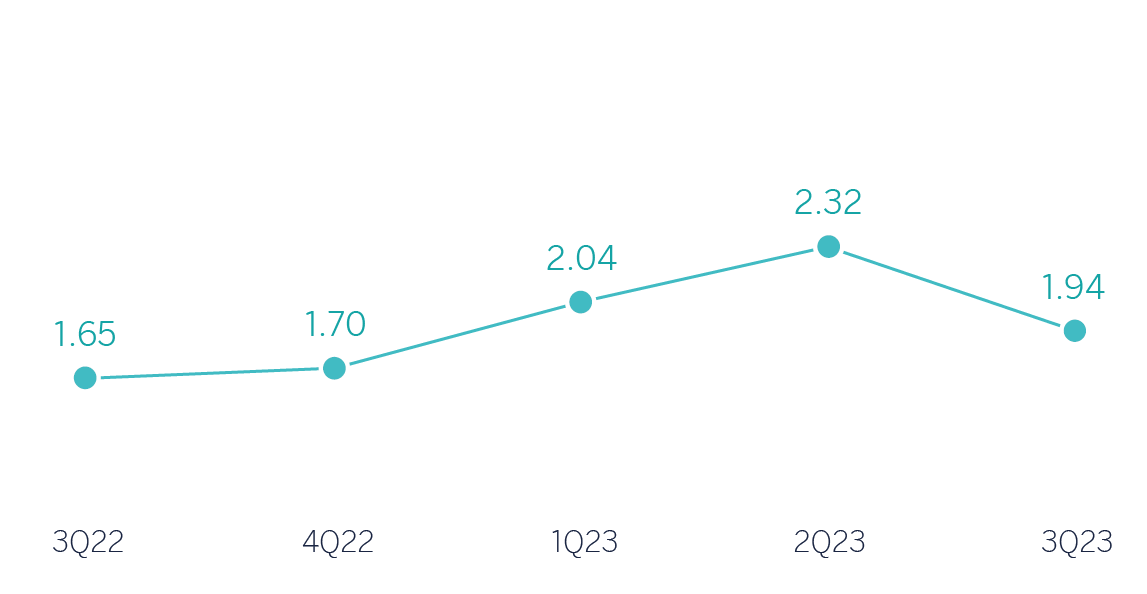
Gross income / AVERAGE TOTAL ASSETS
(PERCENTAGE AT CONSTANT EXCHANGE RATES)
Operating income
(Millions of euros at constant exchange rates)
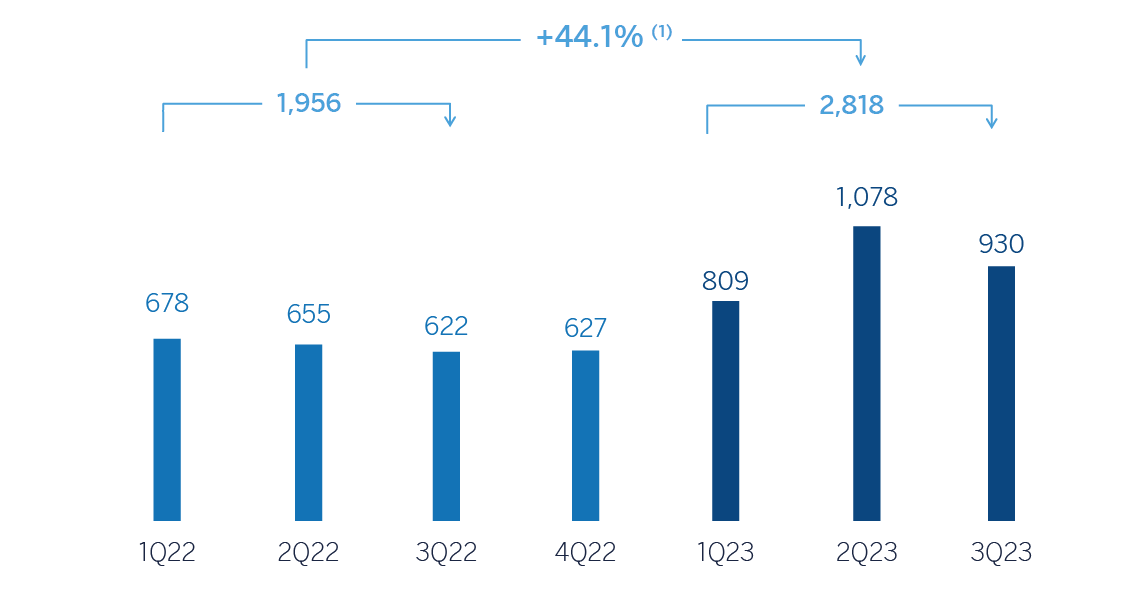
(1) At current exchange rates: +28.3%.
Net attributable profit (LOSS)
(Millions of euros at constant exchange rates)
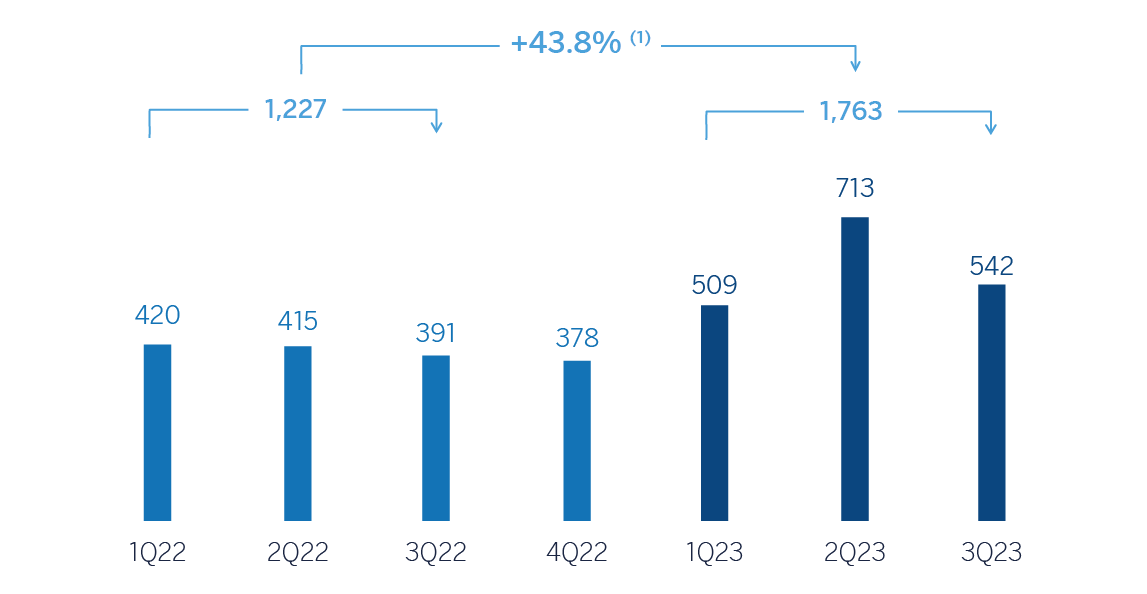
(1) At current exchange rates: +32.8%.
Financial statements and relevant business indicators (Millions of euros and percentage)
| Income statement | Jan.-Sep. 23 (1) | ∆% | ∆% (2) | Jan.-Sep. 22 |
|---|---|---|---|---|
| Net interest income | 1,568 | 6.6 | 17.1 | 1,471 |
| Net fees and commissions | 795 | 17.5 | 23.7 | 677 |
| Net trading income | 1,438 | 59.5 | 81.7 | 902 |
| Other operating income and expenses | (58) | 95.1 | 104.5 | (30) |
| Gross income | 3,743 | 24.0 | 36.4 | 3,019 |
| Operating expenses | (926) | 12.5 | 17.3 | (823) |
| Personnel expenses | (438) | 15.6 | 18.9 | (379) |
| Other administrative expenses | (408) | 12.0 | 20.0 | (364) |
| Depreciation | (79) | (0.2) | (1.2) | (80) |
| Operating income | 2,818 | 28.3 | 44.1 | 2,197 |
| Impairment on financial assets not measured at fair value through profit or loss | (39) | (40.1) | 1.9 | (65) |
| Provisions or reversal of provisions and other results | 14 | 49.5 | 86.3 | 9 |
| Profit (loss) before tax | 2,792 | 30.5 | 45.1 | 2,140 |
| Income tax | (805) | 32.1 | 46.6 | (609) |
| Profit (loss) for the period | 1,988 | 29.8 | 44.5 | 1,531 |
| Non-controlling interests | (224) | 10.3 | 50.1 | (203) |
| Net attributable profit (loss) | 1,763 | 32.8 | 43.8 | 1,328 |
| Balance sheets | 30-09-23 | ∆% | ∆% (2) | 31-12-22 |
|---|---|---|---|---|
| Cash, cash balances at central banks and other demand deposits | 5,315 | (3.8) | (7.3) | 5,524 |
| Financial assets designated at fair value | 146,069 | 23.8 | 21.9 | 117,958 |
| Of which: Loans and advances | 66,648 | 46.9 | 46.7 | 45,360 |
| Financial assets at amortized cost | 96,132 | 7.5 | 7.7 | 89,440 |
| Of which: Loans and advances to customers | 78,283 | 1.4 | 1.8 | 77,208 |
| Inter-area positions | - | - | - | - |
| Tangible assets | 137 | 163.8 | 159.8 | 52 |
| Other assets | 9,754 | n.s. | n.s. | 862 |
| Total assets/liabilities and equity | 257,406 | 20.4 | 19.4 | 213,836 |
| Financial liabilities held for trading and designated at fair value through profit or loss | 117,905 | 19.3 | 17.9 | 98,790 |
| Deposits from central banks and credit institutions | 29,867 | 42.3 | 41.4 | 20,987 |
| Deposits from customers | 55,267 | 14.7 | 14.9 | 48,180 |
| Debt certificates | 6,573 | 24.2 | 22.5 | 5,292 |
| Inter-area positions | 29,300 | 14.4 | 13.8 | 25,609 |
| Other liabilities | 7,458 | 80.8 | 63.3 | 4,124 |
| Regulatory capital allocated | 11,036 | 1.7 | 4.0 | 10,855 |
| Relevant business indicators | 30-09-23 | ∆% | ∆% (2) | 31-12-22 |
|---|---|---|---|---|
| Performing loans and advances to customers under management (3) | 78,194 | 1.2 | 1.6 | 77,291 |
| Non-performing loans | 859 | 14.0 | 49.0 | 753 |
| Customer deposits under management (3) | 50,289 | 6.4 | 6.6 | 47,270 |
| Off-balance sheet funds (4) | 4,306 | 146.0 | 203.1 | 1,750 |
| Efficiency ratio (%) | 24.7 | 28.5 |
(1) For the translation of the income statement in those countries where hyperinflation accounting is applied, the punctual exchange rate as of September 30, 2023 is used.
(2) At constant exchange rates.
(3) Excluding repos.
(4) Includes mutual funds, customer portfolios and other off-balance sheet funds.
Unless expressly stated otherwise, all the comments below on rates of change, for both activity and results, will be given at constant exchange rates. For the conversion of these figures in those countries in which accounting for hyperinflation is applied, the end of period exchange rate as of September 30, 2023 is used. These rates, together with changes at current exchange rates, can be found in the attached tables of financial statements and relevant business indicators.
Activity
The most relevant aspects related to the area's activity in the first nine months of 2023 were:
- Lending activity (performing loans under management) was slightly higher than at the end of December 2022 (+1.6%). By products, the evolution of Investment Banking & Finance is noteworthy, and by geographical areas, the performance in the United States stands out. On the other hand, the evolution of the rest of the areas continues to be slower than expected.
- Customer funds continued to grow by 12.3% between January and September of 2023, maintaining the positive trend in price management.
The most relevant aspects related to the area's activity in the third quarter of 2023 were:
- Lending activity balances were above the figure for the end of June (+3.0%).
- Customer funds increased (+4.7%), with outflows of some customers in Europe and the United States, offset by the rest of geographical areas.
Results
CIB generated a net attributable profit of €1,763m between January and September of 2023. These results, which do not include the application of hyperinflation accounting, represent an increase of 43.8% on a year-on-year basis and reflect the contribution of the diversification of products and geographical areas, as well as the progress of the Group's wholesale businesses in its strategy, leveraged on globality and sustainability, with the purpose of being relevant to its clients.
The contribution by business areas, excluding the Corporate Center, to CIB's accumulated net attributable profit at the end of September 2023 was as follows: 16% Spain, 26% Mexico, 29% Turkey, 13% South America and 16% Rest of Business.
All business line results have performed well, highlighting particularly the Global Markets performance, mainly in the United States and emerging markets, the Global Transactional Banking (GTB) in all geographical areas, and Project Finance within Investment Banking & Finance (IB&F).
The most relevant aspects of the year-on-year evolution in the income statement of this aggregate are summarized below:
- Net interest income was 17.1% higher than in the same period last year. GTB stands out, which evolved favorably in all geographic areas, especially in Spain and the American region.
- Net fees and commissions registered an increase of 23.7%, with positive evolution in all businesses.
- Excellent NTI performance (+81.7%), mainly due to the performance of the Global Markets due to the income generated by foreign currency operations in emerging markets. By geographical areas, all of them showed growth, except Spain.
- The operating expenses increased by 17.3%, driven by higher personnel expenses, partly due to measures taken by the Group to compensate for the loss in purchasing power of the workforce and salary review processes, as well as the increase in the number of employees in the area. On the other hand, general expenses continue to be affected by inflation and higher technology-related expenses. Despite this, the efficiency ratio improved to 24.7%, which represents an improvement compared to the same period of the previous year.
- Provisions for impairment on financial assets stood slightly below the previous year, mainly due to releases in Spain and Mexico.
In the third quarter of 2023 and excluding the effect of the variation in exchange rates, the Group's wholesale businesses generated a net attributable profit of €542m (-24.0% compared to the previous quarter), which is mainly explained by the more modest NTI results in the third quarter compared to the second quarter. It should to be noted the excellent income in all businesses, highlighting GM in the United States, IB&F in Rest of Europe, and GTB in Spain, Mexico and South America.