
Spain
Highlights
- Growth in consumer loans, SMEs and public sector during the year
- Net interest income dynamism continues
- Very significant improvement of the efficiency ratio
- Cost of risk remains at low levels
Business activity (1)
(VARIATION COMPARED TO 31-12-22)
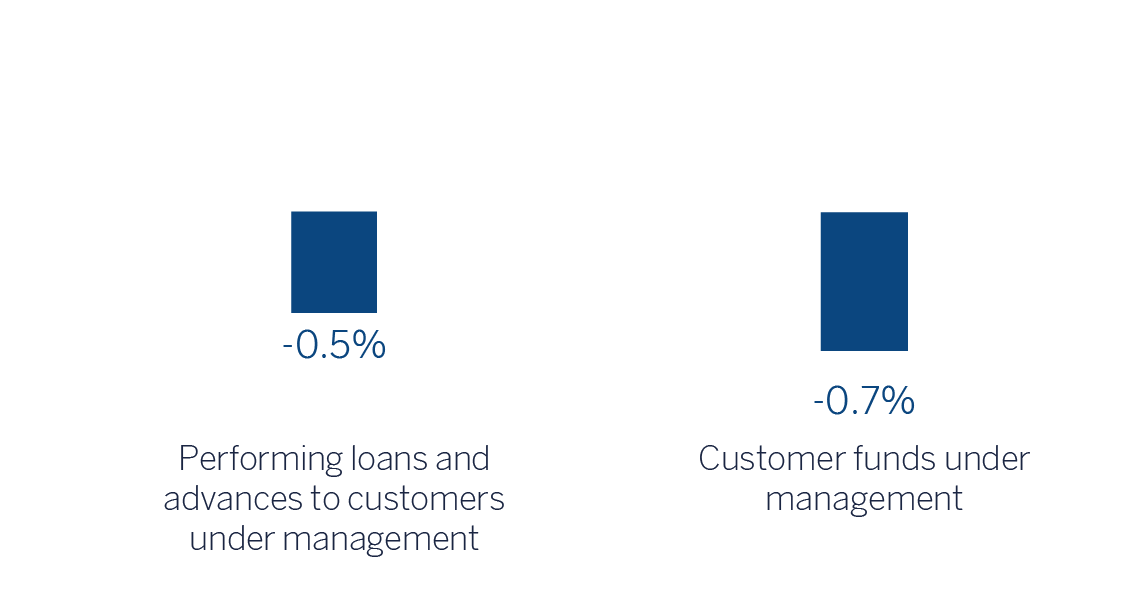
(1) Excluding repos.
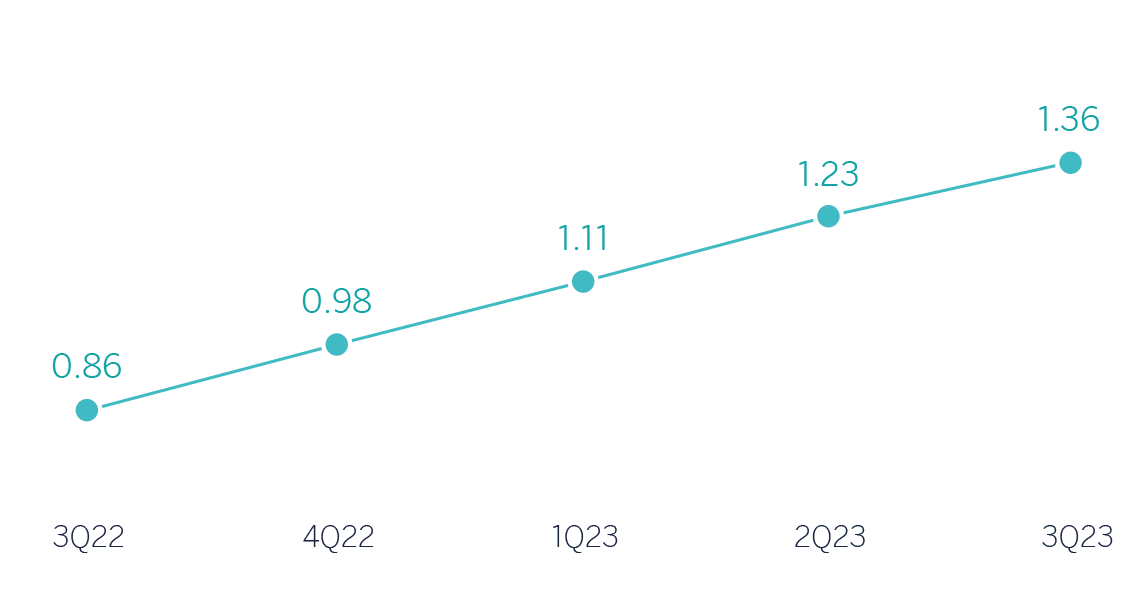
Net interest income / AVERAGE TOTAL ASSETS
(Percentage)
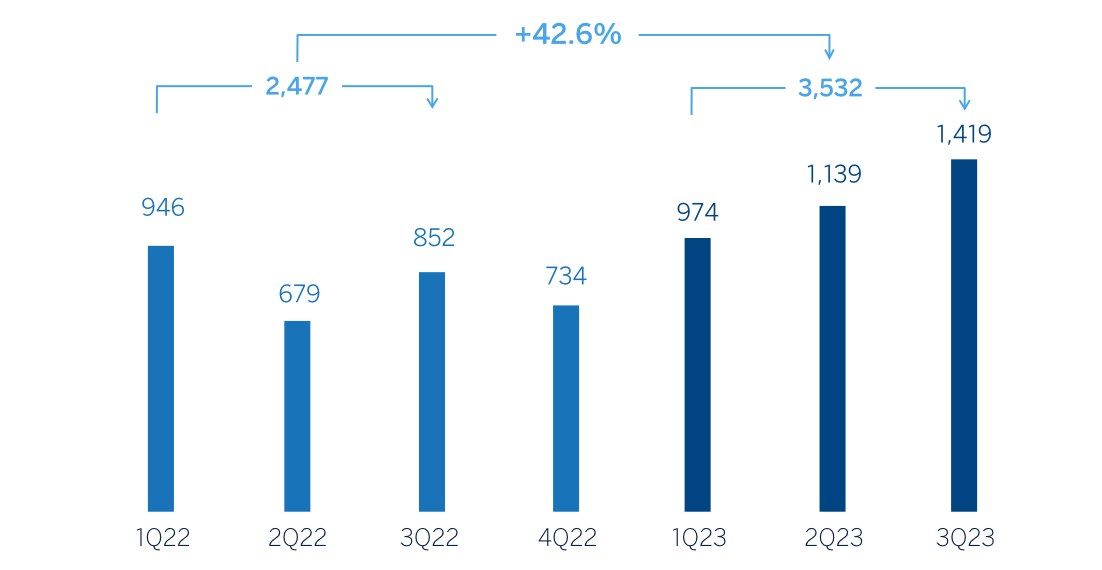
Operating income (Millions of euros)
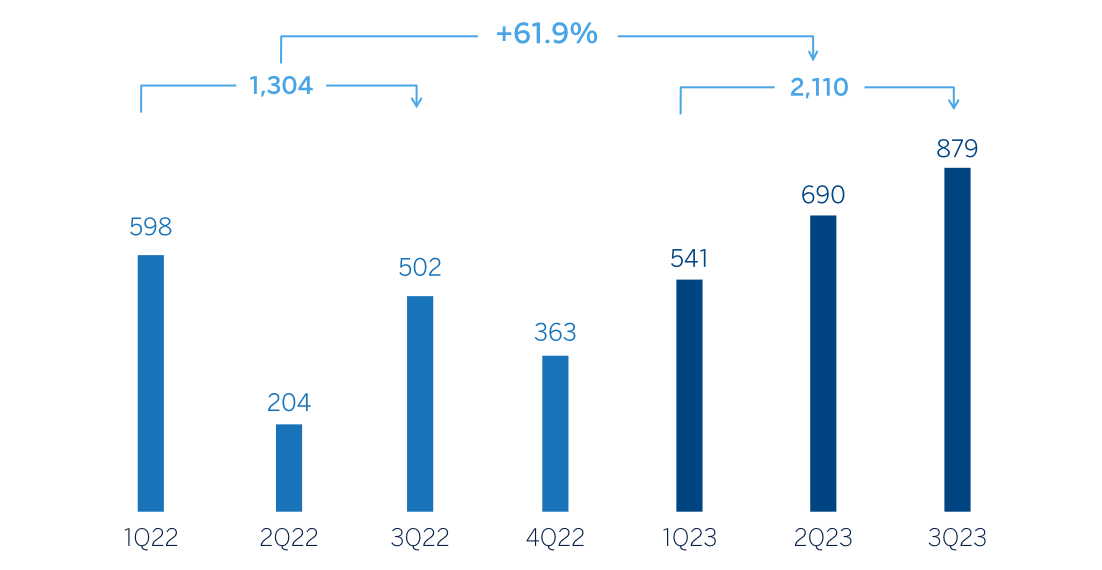
Net attributable profit (LOSS) (Millions of euros)
Financial statements and relevant business indicators (Millions of euros and percentage)
| Income statement | Jan.-Sep. 23 | ∆% | Jan.-Sep. 22 (1) |
|---|---|---|---|
| Net interest income | 4,053 | 50.8 | 2,687 |
| Net fees and commissions | 1,603 | (2.0) | 1,635 |
| Net trading income | 309 | (6.2) | 329 |
| Other operating income and expenses | (132) | n.s. | (31) |
| Of which: Insurance activities | 278 | 2.9 | 270 |
| Gross income | 5,833 | 26.3 | 4,620 |
| Operating expenses | (2,301) | 7.3 | (2,144) |
| Personnel expenses | (1,292) | 10.5 | (1,169) |
| Other administrative expenses | (723) | 8.3 | (668) |
| Depreciation | (286) | (6.8) | (307) |
| Operating income | 3,532 | 42.6 | 2,477 |
| Impairment on financial assets not measured at fair value through profit or loss | (405) | 21.9 | (332) |
| Provisions or reversal of provisions and other results | (74) | 100.4 | (37) |
| Profit (loss) before tax | 3,053 | 44.9 | 2,107 |
| Income tax | (941) | 56.9 | (600) |
| Profit (loss) for the period | 2,112 | 40.1 | 1,507 |
| Non-controlling interests | (2) | (31.6) | (3) |
| Net attributable profit (loss) excluding non-recurring impacts | 2,110 | 40.2 | 1,505 |
| Net impact arisen from the purchase of offices in Spain | - | - | (201) |
| Net attributable profit (loss) | 2,110 | 61.9 | 1,304 |
| Balance sheets | 30-09-23 | ∆% | 31-12-22 (1) |
|---|---|---|---|
| Cash, cash balances at central banks and other demand deposits | 34,461 | (29.9) | 49,185 |
| Financial assets designated at fair value | 138,913 | 9.9 | 126,413 |
| Of which: Loans and advances | 58,053 | 38.5 | 41,926 |
| Financial assets at amortized cost | 214,593 | 4.9 | 204,528 |
| Of which: Loans and advances to customers | 173,619 | (0.2) | 173,971 |
| Inter-area positions | 41,660 | 7.0 | 38,924 |
| Tangible assets | 2,882 | (3.6) | 2,990 |
| Other assets | 5,248 | 3.4 | 5,076 |
| Total assets/liabilities and equity | 437,757 | 2.5 | 427,116 |
| Financial liabilities held for trading and designated at fair value through profit or loss | 104,052 | 23.0 | 84,619 |
| Deposits from central banks and credit institutions | 41,839 | (19.1) | 51,702 |
| Deposits from customers | 212,725 | (3.8) | 221,019 |
| Debt certificates | 48,733 | 19.5 | 40,782 |
| Inter-area positions | - | - | - |
| Other liabilities | 15,979 | 0.7 | 15,870 |
| Regulatory capital allocated | 14,429 | 9.9 | 13,124 |
| Relevant business indicators | 30-09-23 | ∆% | 31-12-22 |
|---|---|---|---|
| Performing loans and advances to customers under management (2) | 170,282 | (0.5) | 171,209 |
| Non-performing loans | 7,931 | 0.5 | 7,891 |
| Customer deposits under management (2) | 211,611 | (3.9) | 220,140 |
| Off-balance sheet funds (3) | 93,024 | 7.2 | 86,759 |
| Risk-weighted assets | 117,112 | 2.3 | 114,474 |
| Efficiency ratio (%) | 39.4 | 47.5 | |
| NPL ratio (%) | 4.0 | 3.9 | |
| NPL coverage ratio (%) | 55 | 61 | |
| Cost of risk (%) | 0.31 | 0.28 |
(1) Balances restated according to IFRS 17 - Insurance contracts
(2) Excluding repos.
(3) Includes mutual funds, customer portfolios and pension funds.
Macro and industry trends
According to the latest estimate from BBVA Research, GDP growth will converge to around 2.4% in 2023 (unchanged from the previous forecast) and 1.8% in 2024 (30 basis points lower than previously expected). Despite the relative resilience of activity in recent quarters, largely related to the dynamism of the services sector, exports, and the labor market, as well as the effect of the European recovery funds, growth is expected to continue to moderate going forward, in line with the slowdown in growth in the Eurozone and the prospects of tighter monetary conditions and higher oil prices. Annual inflation, which reached 3.5% in September, will remain slightly above this level—and higher than previously expected—in the last quarter of 2023 and during most of 2024, pressured by recent increases in oil prices and the strength of the services sector.
As for the banking system, data at the end of July 2023 showed that the volume of credit to the private sector declined by 3.1% year- on-year. At the June close, household and corporate loan portfolios fell by 1.7% and 3.7% year-on-year, respectively. Customer deposits fell by 3.9% year-on-year as of the end of July 2023, due to an 8.1% reduction in demand deposits. This was not offset by the growth in time deposits (+49.6% year-on-year). The NPL ratio continued to decline, falling to 3.56% in August 2023, 30 basis points below the figure of the same period of the previous year. Furthermore, the system maintains comfortable solvency and liquidity levels.
Activity
The most relevant aspects related to the area's activity during the first nine months of 2023 were:
- Lending balances were in line with the end of December (-0.5%). By portfolios, loans to the public sector (+6.5%), consumer loans (+4.2%, including credit cards) and loans to SMEs (+2.3%) were offset by mortgage cancellations made by some customers and deleveraging by large corporations (-2.4%).
- Total customer funds remained relatively stable (-0.7%). Lower demand deposit balances (-5.5%) were partially offset mainly by off-balance sheet funds growth (mutual and pension funds, 7.2% overall), which increased mainly as a result of net contributions during the first nine months of the year.
The most relevant aspects related to the area's activity during the third quarter of 2023 were:
- Lending activity remained flat compared to the previous quarter (-0.3%) mainly due to the seasonal reduction in loans to the public sector (-13.3%), offset by the consumer loans (+3.4%, including credit cards), loans to large corporations (+2.6%) and SMEs (+0.6%). On the other hand, mortgage loans remained stable during the quarter (+0.1%).
- Regarding credit quality, the NPL ratio decreased 7 basis points compared to the previous quarter and stands at 4.0%, favored by both the positive dynamics of the wholesale portfolio and the impact of the sale of a default loan portfolio without collateral (non-performing loans and write-offs). As a result of this sale and given the high coverage level of the portfolio sold, the NPL coverage ratio decreased during the quarter to 55%.
- Total customer funds remained stable in the quarter (-0.4%). Customer deposits declined (-0.7%) influenced by seasonality, while off-balance sheet funds (mutual and pension funds) increased slightly (+0.2%), mainly due to the volume of net contributions, which offset the slight negative impact of the market evolution.
Results
Spain generated a net attributable profit of €2,110m in the first nine months of 2023, 61.9% higher than in the same period of the previous year, thanks again to the strength of the net interest income, which boosted gross income growth and comfortably offset the increase in expenses.
The most notable aspects of the year-on-year changes in the area's income statement at the end of September 2023 were:
- Net interest income grew by 50.8% and continues to benefit from the improvement in customer spreads derived from the interest rate hikes.
- Net fees and commissions were lower than the same period of the previous year (-2.0%), as a result of a lower contribution from banking services fees.
- Decrease in the year-on-year NTI contribution (-6.2%), despite the favorable evolution of Global Markets.
- Other operating income and expenses compare negatively with the same period of the previous year, due to the €215m recorded in this line, corresponding to the total annual amount paid for the temporary tax on credit institutions and financial credit establishments. On the other hand, the contribution to SRF was lower than in the same period of the previous year, and the performance of the insurance business improved compared to the same period of 2022.
- Operating expenses continued to increase (+7.3%), although well below the growth of gross income (+26.3%), which allowed a very significant improvement of the efficiency ratio by 695 basis points in the last twelve months. The increase in operating expenses is due to both higher fixed remuneration to personnel, with additional measures that improve those of the sectoral wage increase agreement, and higher general expenses, especially higher IT expenses.
- Impairment on financial assets increased 21.9% due to higher loan-loss provisions, mainly in the retail portfolio, which were affected by a higher rate environment, and together with some positive non-recurring items recorded in the first nine months of 2022. As a result of the above, the cumulative cost of risk at the end of September 2023 increased to 0.31%, which is 4 basis points above the cumulative figure at the end of the first half of the year.
In the third quarter of 2023, Spain generated a net attributable profit of €879m, which represents a growth of +27.4% compared to the previous quarter. The evolution between July and September was marked again by both the favorable performance of the net interest income (+11.0%), as well as by the improvement in the other operating income and expenses line compared to the second quarter, which included the contribution to the SRF.