

4.2.1. Exposure to credit risk
Pursuant to Article 5 of the Solvency Regulations, with respect to the capital requirements for credit risk, exposure is understood to be any asset item and all items included in the Group’s memorandum accounts involving credit risk and not deducted from the Group’s eligible capital. Accordingly, inclusion is made mainly of customer lending items, with their corresponding undrawn balances, letters of credit and collaterals, debt securities and capital instruments, cash and deposits in central banks and credit institutions, assets purchased or sold under a repurchase agreement (asset and liability repos), financial derivatives and fixed assets.
Below is a presentation of the balance of the original exposure and the allowances under the advanced measurement and standardized approaches as of December 31, 2014 and 2013. In accordance with Article 444 e) of the Solvency Regulations, only the exposure net of allowances is presented for those exposures calculated under the standardized approach.
TABLE 14: Exposure to credit risk
2014
(Millions of euros)
|
|
|
|
|
Exposure after applying conversion factors | ||||
|---|---|---|---|---|---|---|---|---|
| Category of exposure | Original exposure (1) | Provisions (2) | Exposure Net of provisions (3) | On-balance-sheet exposure after mitigation techniques | Off-balance-sheet exposure after mitigation techniques | Fully Adjusted Value of the exposure | Average CCF | EAD |
| Central governments or central banks | 103,926 | -18 | 103,909 | 106,406 | 2,498 | 108,904 | 51% | 107,683 |
| Regional governments or local authorities | 7,482 | -15 | 7,467 | 7,236 | 151 | 7,387 | 55% | 7,320 |
| Public sector entities | 5,524 | -29 | 5,496 | 2,181 | 918 | 3,099 | 38% | 2,532 |
| Multilateral Development banks | 93 | 0 | 93 | 92 | 0 | 93 | 0% | 92 |
| International organizations | 16 | 0 | 16 | 16 | 0 | 16 | 2% | 16 |
| Institutions | 20,366 | -22 | 20,344 | 10,337 | 10,040 | 20,377 | 11% | 11,461 |
| Corporates | 107,908 | -163 | 107,744 | 59,464 | 42,678 | 102,143 | 28% | 71,340 |
| Retail | 59,973 | -467 | 59,506 | 40,604 | 16,581 | 57,185 | 16% | 43,338 |
| Secured by mortgages on immovable property | 54,500 | -353 | 54,147 | 51,750 | 732 | 52,482 | 49% | 52,109 |
| Exposures in default | 9,311 | -3,440 | 5,870 | 5,181 | 63 | 5,244 | 68% | 5,224 |
| Items associated with particularly high risk | 380 | -31 | 349 | 174 | 35 | 208 | 7% | 176 |
| Covered bonds | 605 | 0 | 605 | 605 | 0 | 605 | 0% | 605 |
| Short-term claims on institutions and corporate | 2,063 | 0 | 2,063 | 1,834 | 0 | 1,834 | 0% | 1,834 |
| Collective investments undertakings (CIU) | 124 | 0 | 124 | 46 | 4 | 51 | 92% | 50 |
| Other exposures | 27,105 | -84 | 27,020 | 30,801 | 667 | 31,468 | 79% | 31,329 |
| TOTAL STANDARDIZED APPROACH | 399,375 | -4,621 | 394,754 | 316,727 | 74,369 | 391,096 |
|
335,110 |
| Central governments or central banks | 3,001 | -4 | N/A | 4,153 | 749 | 4,902 | 50% | 4,529 |
| Institutions | 112,235 | -78 | N/A | 105,642 | 6,338 | 111,981 | 61% | 109,494 |
| Corporates | 130,154 | -6,711 | N/A | 75,120 | 53,389 | 128,508 | 52% | 102,682 |
| Retail | 96,276 | -1,620 | N/A | 83,698 | 12,577 | 96,276 | 5% | 86,866 |
| Of which: Secured by real estate collateral | 70,113 | -721 | N/A | 69,880 | 233 | 70,113 | 10% | 69,892 |
| Of which: Qualifying revolving retail | 17,943 | -516 | N/A | 6,377 | 11,566 | 17,943 | 24% | 9,134 |
| Of which: Other retail assets | 8,219 | -384 | N/A | 7,441 | 778 | 8,219 | 51% | 7,839 |
| TOTAL ADVANCED MEASUREMENT APPROACH | 341,667 | -8,413 |
|
268,613 | 73,054 | 341,667 |
|
303,570 |
| TOTAL CREDIT RISK DILUTION AND DELIVERY | 741,042 | -13,034 | 394,754 | 585,340 | 147,423 | 732,762 | - | 638,680 |
| Securitized positions | 3,765 | -38 | 2,705 | 3,747 | 0 | 3,747 | 0% | 3,747 |
| Standardized Approach | 2,723 | -18 | 2,705 | 2,705 | 0 | 2,705 | 0% | 2,705 |
| Advanced Measurement Approach | 1,042 | -21 | N/A | 1,042 | 0 | 1,042 | 0% | 1,042 |
| Equity | 10,696 | -61 | N/A | 10,442 | 0 | 10,442 | 0% | 10,696 |
| Simple Method | 3,980 | -40 | N/A | 3,980 | 0 | 3,980 | 0% | 3,980 |
| Non-trading equity instruments in sufficiently diversified portfolios | 3,712 | -34 | N/A | 3,712 | 0 | 3,712 | 0% | 3,712 |
| Exchange-traded equity instruments | 268 | -6 | N/A | 268 | 0 | 268 | 0% | 268 |
| PD/LGD Method | 6,462 | 0 | N/A | 6,462 | 0 | 6,462 | 0% | 6,462 |
| Internal Models | 254 | -21 | N/A | 0 | 0 | 0 | 0% | 254 |
| TOTAL CREDIT RISK | 755,503 | -13,134 | 397,459 | 599,529 | 147,423 | 746,952 | - | 653,124 |
2013
(Millions of euros)
|
|
|
|
|
Exposure after applying conversion factors | ||||
|---|---|---|---|---|---|---|---|---|
| Category of exposure | Original exposure (1) | Provisions (2) | Exposure Net of provisions (3) | On-balance-sheet exposure after mitigation techniques | Off-balance-sheet exposure after mitigation techniques | Fully Adjusted Value of the exposure | Average CCF | EAD |
| Central governments or central banks | 93,548 | -47 | 93,502 | 87,386 | 5,664 | 93,050 | 41% | 89,724 |
| Regional governments or local authorities | 9,195 | 0 | 9,195 | 6,500 | 347 | 6,847 | 47% | 6,663 |
| Public sector entities | 4,486 | 0 | 4,486 | 3,511 | 1,318 | 4,829 | 36% | 3,980 |
| Multilateral Development banks | 50 | 0 | 50 | 50 | 0 | 50 | 0% | 50 |
| International organizations | 8 | 0 | 8 | 8 | 0 | 8 | 1% | 8 |
| Institutions | 20,702 | -12 | 20,690 | 10,606 | 9,728 | 20,334 | 42% | 14,713 |
| Corporates | 93,305 | -806 | 92,499 | 55,710 | 31,152 | 86,862 | 36% | 66,969 |
| Retail | 60,395 | -67 | 60,328 | 41,141 | 16,205 | 57,346 | 14% | 43,372 |
| Secured by mortgages on immovable property | 51,916 | -115 | 51,801 | 49,670 | 795 | 50,465 | 48% | 50,050 |
| Exposures in default | 14,836 | -4,163 | 10,674 | 8,657 | 71 | 8,728 | 25% | 8,675 |
| Items associated with particularly high risk | 1,133 | -16 | 1,118 | 877 | 53 | 930 | 1% | 878 |
| Covered bonds | 911 | 0 | 911 | 911 | 0 | 911 | 0% | 911 |
| Short-term claims on institutions and corporate | 663 | 0 | 663 | 663 | 0 | 663 | 0% | 663 |
| Collective investments undertakings (CIU) | 816 | 0 | 816 | 253 | 8 | 261 | 100% | 261 |
| Other exposures | 22,210 | -98 | 22,112 | 26,860 | 735 | 27,595 | 38% | 27,139 |
| TOTAL STANDARDIZED APPROACH | 374,175 | -5,323 | 368,852 | 292,804 | 66,075 | 358,879 |
|
314,055 |
| Central governments or central banks | 1,581 | -2 | - | 2,707 | 808 | 3,515 | 50% | 3,115 |
| Institutions | 89,458 | -76 | - | 80,993 | 8,161 | 89,155 | 56% | 85,558 |
| Corporates | 114,333 | -6,717 | - | 63,196 | 49,507 | 112,703 | 53% | 89,644 |
| Retail | 96,037 | -1,566 | - | 84,850 | 11,186 | 96,036 | 26% | 86,750 |
| Of which: Secured by real estate collateral | 72,829 | -676 | - | 72,446 | 383 | 72,829 | 6% | 72,470 |
| Of which: Qualifying revolving retail | 17,160 | -532 | - | 6,544 | 10,616 | 17,160 | 26% | 9,273 |
| Of which: Other retail assets | 6,048 | -357 | - | 5,860 | 187 | 6,047 | 56% | 5,006 |
| TOTAL ADVANCED MEASUREMENT APPROACH | 301,409 | -8,362 | 0 | 231,746 | 69,662 | 301,407 |
|
265,066 |
| TOTAL CREDIT RISK DILUTION AND DELIVERY | 675,584 | -13,685 | 368,852 | 524,550 | 135,737 | 660,287 | - | 579,122 |
| Securitized positions | 5,730 | -66 | 4,783 | 5,692 | 0 | 5,692 | 0% | 5,619 |
| Standardized Approach | 4,820 | -37 | 4,783 | 4,783 | - | 4,783 | 0% | 4,710 |
| Advanced Measurement Approach | 910 | -28 |
|
910 | - | 910 | 0% | 910 |
| Equity | 8,818 | -128 | - | 8,443 | - | 8,443 | 0% | 8,818 |
| Simple Method | 830 | -63 | - | 830 | - | 830 | 0% | 830 |
| Non-trading equity instruments in sufficiently diversified portfolios | 620 | -59 | - | 620 | - | 620 | 0% | 620 |
| Exchange-traded equity instruments | 209 | -5 | - | 209 | - | 209 | 0% | 209 |
| PD/LGD Method | 7,613 | 0 | - | 7,613 | - | 7,613 | 0% | 7,613 |
| Internal Models | 375 | -65 | - | 0 | - | 0 | 0% | 375 |
| TOTAL CREDIT RISK | 690,132 | -13,878 | 373,635 | 538,685 | 135,737 | 674,422 | - | 593,559 |
4.2.2. Average value of the exposures throughout 2014 and 2013.
The table below shows the average value of exposure to credit risk in 2014 and 2013 for both the advanced measurement and standardized approaches for each one of the exposure categories:
TABLE 15: Average value of the exposures throughout 2013 and 2014
(Millions of euros)
| Category of exposure | Original average exposure for the period | |
|---|---|---|
| 2014 | 2013 | |
| Central governments or central banks | 96,222 | 97,465 |
| Regional governments or local authorities | 6,575 | 9,900 |
| Public sector entities | 6,059 | 3,728 |
| Multilateral Development banks | 91 | 79 |
| International organizations | 10 | 15 |
| Institutions | 20,217 | 22,879 |
| Corporates | 100,720 | 95,588 |
| Retail | 58,305 | 57,316 |
| Secured by mortgages on immovable property | 54,005 | 53,552 |
| Exposures in default | 10,776 | 13,454 |
| Items associated with particularly high risk | 454 | 1,435 |
| Covered bonds | 4,481 | 775 |
| Short-term claims on institutions and corporate | 2,040 | 734 |
| Collective investments undertakings (CIU) | 169 | 243 |
| Other exposures | 25,388 | 23,228 |
| TOTAL STANDARDIZED APPROACH | 385,512 | 380,388 |
| Central governments or central banks | 2,495 | 1,367 |
| Institutions | 96,324 | 83,660 |
| Corporates | 123,953 | 120,542 |
| Retail | 101,774 | 97,614 |
| Of which: Secured by real estate collateral | 70,895 | 73,971 |
| Of which: Qualifying revolving retail | 17,827 | 17,404 |
| Of which: Other retail assets | 6,526 | 6,240 |
| TOTAL ADVANCED MEASUREMENT APPROACH | 324,546 | 303,183 |
| TOTAL CREDIT RISK DILUTION AND DELIVERY (5) | 710,058 | 683,571 |
| Securitized positions | 3,573 | 6,630 |
| Of which: Standardized Approach | 2,539 | 5,692 |
| Of which: Advanced Measurement Approach | 1,034 | 938 |
| Equity | 10,414 | 7,344 |
| Of which: Simple Method | 4,053 | 874 |
| Equity instruments in sufficiently diversified portfolios | 696 | 646 |
| Exchange Traded equity instruments | 3,357 | 228 |
| Of which: PD/LGD Method | 5,901 | 5,979 |
| Of which: Internal Models | 460 | 491 |
| TOTAL CREDIT RISK | 724,045 | 697,545 |
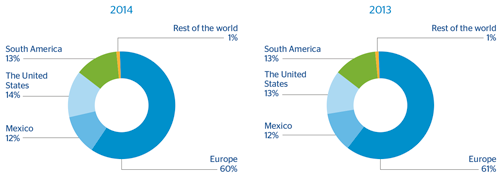
4.2.3. Distribution by geographical area
The following chart shows the distribution by geographical area of the original exposure based on the obligor's country. The breakdown includes exposure under the standardized and advanced measurement approaches, without including positions in securitizations or equity.
TABLE 16: Distribution by geographical area of exposure to credit risk
2014
(Millions of euros)
| Category of exposure | Total | Europe | Mexico | U.S. | South America | Rest of the World |
|---|---|---|---|---|---|---|
| Central governments or central banks | 103,926 | 66,734 | 12,913 | 5,663 | 18,617 | 0 |
| Regional governments or local authorities | 7,482 | 1,920 | 1,014 | 4,461 | 86 | 0 |
| Public sector entities | 5,524 | 385 | 3,148 | 236 | 1,710 | 45 |
| Multilateral Development banks | 93 | 38 | 0 | 12 | 42 | 0 |
| International organizations | 16 | 16 | 0 | 0 | 0 | 0 |
| Institutions | 20,366 | 13,691 | 1,542 | 1,883 | 2,685 | 565 |
| Corporates | 107,908 | 18,794 | 16,159 | 49,601 | 22,853 | 500 |
| Retail | 59,973 | 19,891 | 5,915 | 7,302 | 26,826 | 39 |
| Secured by mortgages on immovable property | 54,500 | 17,747 | 9,799 | 14,024 | 12,926 | 3 |
| Exposures in default | 9,311 | 6,586 | 947 | 528 | 1,224 | 26 |
| Items associated with particularly high risk | 380 | 380 | 0 | 0 | 0 | 0 |
| Covered bonds | 605 | 0 | 605 | 0 | 0 | 0 |
| Short-term claims on institutions and corporate | 2,063 | 211 | 0 | 1,238 | 614 | 0 |
| Collective investments undertakings (CIU) | 124 | 113 | 0 | 7 | 5 | 0 |
| Other exposures | 27,105 | 14,535 | 6,559 | 1,491 | 4,494 | 26 |
| Securitized positions | 2,723 | 867 | 188 | 1,666 | 0 | 1 |
| TOTAL CREDIT RISK BY THE STANDARDIZED APPROACH | 402,098 | 161,910 | 58,790 | 88,112 | 92,082 | 1,205 |
| Central governments or central banks | 3,001 | 152 | 113 | 1,619 | 464 | 654 |
| Institutions | 112,235 | 105,369 | 540 | 3,276 | 172 | 2,878 |
| Corporates | 130,154 | 99,706 | 15,408 | 7,558 | 2,546 | 4,937 |
| Retail | 96,276 | 82,149 | 14,111 | 2 | 8 | 5 |
| Securitized positions | 1,042 | 1,006 | 0 | 34 | 0 | 2 |
| TOTAL CREDIT RISK BY THE ADVANCED MEASUREMENT APPROACH | 342,709 | 288,382 | 30,172 | 12,489 | 3,191 | 8,475 |
| TOTAL CREDIT RISK DILUTION AND DELIVERY | 744,807 | 450,292 | 88,962 | 100,601 | 95,273 | 9,680 |
2013
| Category of exposure | Total | Europe | Mexico | U.S. | South America | Rest of the World |
|---|---|---|---|---|---|---|
| Central governments or central banks | 93,548 | 59,983 | 12,015 | 3,436 | 18,062 | 52 |
| Regional governments or local authorities | 9,195 | 1,657 | 6,142 | 1,113 | 190 | 93 |
| Public sector entities | 4,486 | 1,792 | 0 | 323 | 2,371 | 0 |
| Multilateral Development banks | 50 | 0 | 0 | 0 | 50 | 0 |
| International organizations | 8 | 8 | 0 | 0 | 0 | 0 |
| Institutions | 20,702 | 12,460 | 2,686 | 1,992 | 3,431 | 133 |
| Corporates | 93,305 | 11,920 | 19,465 | 41,147 | 20,198 | 575 |
| Retail | 60,395 | 20,602 | 7,524 | 7,130 | 25,129 | 9 |
| Secured by mortgages on immovable property | 51,916 | 16,986 | 10,531 | 12,714 | 11,677 | 9 |
| Exposures in default | 14,836 | 12,090 | 1,408 | 420 | 915 | 2 |
| Items associated with particularly high risk | 1,133 | 810 | 79 | 86 | 111 | 47 |
| Covered bonds | 911 | 0 | 911 | 0 | 0 | 0 |
| Short-term claims on institutions and corporate | 663 | 196 | 0 | 3 | 464 | 0 |
| Collective investments undertakings (CIU) | 816 | 804 | 0 | 6 | 5 | 0 |
| Other exposures | 22,210 | 7,645 | 7,230 | 1,778 | 5,557 | 0 |
| Securitized positions | 4,820 | 253 | 70 | 4,498 | 0 | 0 |
| TOTAL CREDIT RISK BY THE STANDARDIZED APPROACH | 378,995 | 147,206 | 68,062 | 74,646 | 88,160 | 921 |
| Central governments or central banks | 1,581 | 116 | 2 | 591 | 480 | 392 |
| Institutions | 89,458 | 84,704 | 431 | 2,126 | 196 | 2,003 |
| Corporates | 114,333 | 99,961 | 816 | 6,933 | 2,154 | 4,470 |
| Retail | 96,037 | 82,453 | 13,428 | 18 | 39 | 99 |
| Securitized positions | 910 | 898 | 0 | 0 | 0 | 12 |
| TOTAL CREDIT RISK BY THE ADVANCED MEASUREMENT APPROACH | 302,319 | 268,131 | 14,676 | 9,668 | 2,869 | 6,975 |
| TOTAL CREDIT RISK DILUTION AND DELIVERY | 681,314 | 415,337 | 82,739 | 84,313 | 91,029 | 7,896 |
As can be seen from the above table, the original exposure in Europe under advanced credit risk models accounts for over 60% of the total, while in the remaining countries the percentage is around 20%.
It also shows graphically the distribution of original exposure by geographical area, revealing the Group's high level of geographical diversification, which constitutes one of the key levers for its strategic growth.
CHART 5: Distribution by geographical area of exposure to credit risk
The next table shows the distribution by geographical area of the book balances of the allowances for financial and non-financial asset losses and for contingent liabilities.
TABLE 17: Distribution by geographical area of the book balances of the non-performing and impaired exposures of financial assets and contingent liabilities
2014
(Millions of euros)
|
|
Total | Europe | Mexico | U.S. | South America | Rest of the World |
|---|---|---|---|---|---|---|
| Non-performing and impaired exposures | 24,970 | 21,547 | 1,271 | 576 | 1,501 | 74 |
2013
|
|
Total | Europe | Mexico | U.S. | South America | Rest of the World |
|---|---|---|---|---|---|---|
| Non-performing and impaired exposures | 25,977 | 23,648 | 1,297 | 342 | 680 | 11 |
The next table shows the distribution by geographical area of the book balances of the allowances for financial asset losses and for contingent liabilities:
TABLE 18: Distribution by geographical area of the book balances of the value adjustments for impairment of financial assets and contingent liabilities
2014
(Millions of euros)
|
|
Total | Europe | Mexico | U.S. | South America | Rest of the World |
|---|---|---|---|---|---|---|
| Value adjustments and provisions | 15,254 | 12,419 | 1,486 | 242 | 1,093 | 14 |
2013
|
|
Total | Europe | Mexico | U.S. | South America | Rest of the World |
|---|---|---|---|---|---|---|
| Value adjustments and provisions | 15,914 | 12,213 | 1,606 | 597 | 1,489 | 9 |
4.2.4. Distribution by sector
Below is the distribution by economic sector (standardized and advanced measurement approaches) of the original exposure, excluding equity positions.
TABLE 19: Distribution by sector of exposure to credit risk
2014
(Millions of euros)
| Category of exposure | Original exposure by sector | ||||||||
|---|---|---|---|---|---|---|---|---|---|
| Total | Credit institutions, insurance and brokerage | Public sector | Agriculture | Industry | Construction | Commercial | Individuals | Other sectors | |
| Central governments or central banks | 103,926 | 0.06% | 13.59% | 0.00% | 0.05% | 0.01% | 0.05% | 0.11% | 0.07% |
| Regional governments or local authorities | 7,482 | 0.07% | 0.58% | 0.00% | 0.05% | 0.02% | 0.06% | 0.13% | 0.08% |
| Public sector entities | 5,524 | 0.01% | 0.69% | 0.00% | 0.01% | 0.00% | 0.01% | 0.02% | 0.01% |
| Multilateral Development Banks | 93 | 0.00% | 0.00% | 0.00% | 0.00% | 0.00% | 0.00% | 0.00% | 0.00% |
| International organizations | 16 | 0.00% | 0.00% | 0.00% | 0.00% | 0.00% | 0.00% | 0.00% | 0.00% |
| Institutions | 20,366 | 1.00% | 0.37% | 0.02% | 0.21% | 0.07% | 0.23% | 0.51% | 0.33% |
| Corporates | 107,908 | 0.36% | 0.52% | 0.39% | 2.36% | 1.01% | 6.47% | 0.66% | 2.72% |
| Retail | 59,973 | 0.18% | 0.13% | 0.10% | 0.47% | 0.24% | 0.74% | 4.91% | 1.29% |
| Secured by mortgages on immovable property | 54,500 | 0.10% | 0.13% | 0.04% | 0.18% | 0.10% | 0.32% | 4.47% | 1.98% |
| Exposures in default | 9,311 | 0.02% | 0.03% | 0.02% | 0.07% | 0.12% | 0.13% | 0.41% | 0.44% |
| Items associated with particularly high risk | 380 | 0.00% | 0.00% | 0.00% | 0.01% | 0.00% | 0.00% | 0.02% | 0.02% |
| Covered bonds | 605 | 0.08% | 0.00% | 0.00% | 0.00% | 0.00% | 0.00% | 0.00% | 0.00% |
| Short-term claims on institutions and corporate | 2,063 | 0.01% | 0.01% | 0.00% | 0.01% | 0.00% | 0.18% | 0.01% | 0.06% |
| Collective investments undertakings (CIU) | 124 | 0.02% | 0.00% | 0.00% | 0.00% | 0.00% | 0.00% | 0.00% | 0.00% |
| Other exposures | 27,105 | 0.21% | 0.20% | 0.01% | 0.12% | 0.04% | 0.14% | 0.28% | 2.65% |
| Securitized positions | 2,723 | 0.03% | 0.28% | 0.00% | 0.00% | 0.00% | 0.06% | 0.00% | 0.00% |
| TOTAL CREDIT RISK BY THE STANDARDIZED APPROACH | 402,098 | 2.16% | 16.53% | 0.58% | 3.54% | 1.61% | 8.39% | 11.54% | 9.65% |
| Central governments or central banks | 3,001 | 0.00% | 0.40% | 0.00% | 0.00% | 0.00% | 0.00% | 0.00% | 0.00% |
| Institutions | 112,235 | 11.59% | 0.74% | 0.03% | 0.43% | 0.14% | 0.46% | 1.03% | 0.66% |
| Corporates | 130,154 | 0.87% | 0.06% | 0.12% | 6.49% | 1.54% | 2.35% | 0.18% | 5.86% |
| Retail | 96,276 | 0.00% | 0.00% | 0.01% | 0.08% | 0.03% | 0.12% | 12.59% | 0.08% |
| Securitized positions | 1,042 | 0.14% | 0.00% | 0.00% | 0.00% | 0.00% | 0.00% | 0.00% | 0.00% |
| TOTAL CREDIT RISK BY THE ADVANCED MEASUREMENT APPROACH | 342,708 | 12.60% | 1.19% | 0.16% | 7.00% | 1.71% | 2.93% | 13.80% | 6.60% |
| TOTAL CREDIT RISK | 744,807 | 14.76% | 17.72% | 0.74% | 10.54% | 3.33% | 11.32% | 25.34% | 16.25% |
2013
| Category of exposure | Original exposure by sector | ||||||||
|---|---|---|---|---|---|---|---|---|---|
| Total | Credit institutions, insurance and brokerage | Public sector | Agriculture | Industry | Construction | Commercial | Individuals | Other sectors | |
| Central governments or central banks | 93,548 | 0.00% | 13.73% | 0.00% | 0.00% | 0.00% | 0.00% | 0.00% | 0.00% |
| Regional governments or local authorities | 9,195 | 0.00% | 1.35% | 0.00% | 0.00% | 0.00% | 0.00% | 0.00% | 0.00% |
| Public sector entities | 4,486 | 0.00% | 0.66% | 0.00% | 0.00% | 0.00% | 0.00% | 0.00% | 0.00% |
| Multilateral Development Banks | 50 | 0.00% | 0.01% | 0.00% | 0.00% | 0.00% | 0.00% | 0.00% | 0.00% |
| International organizations | 8 | 0.00% | 0.00% | 0.00% | 0.00% | 0.00% | 0.00% | 0.00% | 0.00% |
| Institutions | 20,702 | 3.04% | 0.00% | 0.00% | 0.00% | 0.00% | 0.00% | 0.00% | 0.00% |
| Corporates | 93,305 | 0.47% | 0.03% | 0.57% | 1.81% | 0.91% | 6.38% | 0.00% | 3.52% |
| Retail | 60,395 | 0.07% | 0.00% | 0.15% | 0.37% | 0.22% | 1.17% | 5.65% | 1.24% |
| Secured by mortgages on immovable property | 51,916 | 0.01% | 0.00% | 0.03% | 0.10% | 0.11% | 0.23% | 5.05% | 2.09% |
| Exposures in default | 14,836 | 0.07% | 0.01% | 0.03% | 0.16% | 0.18% | 0.19% | 0.80% | 0.74% |
| Items associated with particularly high risk | 1,133 | 0.00% | 0.00% | 0.00% | 0.01% | 0.01% | 0.02% | 0.03% | 0.09% |
| Covered bonds | 911 | 0.13% | 0.00% | 0.00% | 0.00% | 0.00% | 0.00% | 0.00% | 0.00% |
| Short-term claims on institutions and corporate | 663 | 0.03% | 0.00% | 0.01% | 0.00% | 0.02% | 0.01% | 0.00% | 0.03% |
| Collective investments undertakings (CIU) | 816 | 0.12% | 0.00% | 0.00% | 0.00% | 0.00% | 0.00% | 0.00% | 0.00% |
| Other exposures | 22,210 | 0.22% | 0.00% | 0.00% | 0.05% | 0.02% | 0.05% | 0.22% | 2.69% |
| Securitized positions | 4,820 | 0.05% | 0.55% | 0.00% | 0.00% | 0.00% | 0.11% | 0.00% | 0.00% |
| TOTAL CREDIT RISK BY THE STANDARDIZED APPROACH | 378,995 | 4.21% | 16.34% | 0.80% | 2.51% | 1.47% | 8.15% | 11.75% | 10.40% |
| Central governments or central banks | 1,581 | 0.00% | 0.23% | 0.00% | 0.00% | 0.00% | 0.00% | 0.00% | 0.00% |
| Institutions | 89,458 | 8.95% | 4.17% | 0.00% | 0.00% | 0.00% | 0.00% | 0.00% | 0.02% |
| Corporates | 114,333 | 1.58% | 0.05% | 0.08% | 5.70% | 1.70% | 2.00% | 0.01% | 5.66% |
| Retail | 96,037 | 0.01% | 0.00% | 0.00% | 0.02% | 0.01% | 0.02% | 14.01% | 0.03% |
| Securitized positions | 910 | 0.13% | 0.00% | 0.00% | 0.00% | 0.00% | 0.00% | 0.00% | 0.00% |
| TOTAL CREDIT RISK BY THE ADVANCED MEASUREMENT APPROACH | 302,319 | 10.67% | 4.45% | 0.09% | 5.72% | 1.70% | 2.02% | 14.02% | 5.71% |
| TOTAL CREDIT RISK | 681,314 | 14.88% | 20.79% | 0.88% | 8.23% | 3.17% | 10.17% | 25.77% | 16.11% |
The following table shows the distribution by counterparty of the book balances of the non-performing and impaired exposures of financial assets and contingent liabilities.
TABLE 20: Distribution by sector of the book balances of the non-performing and impaired exposures of financial assets and contingent liabilities
2014
(Millions of euros)
|
|
Total | Credit institutions, insurance and brokerage | Public sector | Corporates | Retail | Other sectors |
|---|---|---|---|---|---|---|
| Non-performing and impaired exposures | 24,970 | 1.01% | 1.39% | 60.44% | 30.81% | 6.35% |
2013
|
|
Total | Credit institutions, insurance and brokerage | Public sector | Corporates | Retail | Other sectors |
|---|---|---|---|---|---|---|
| Non-performing and impaired exposures | 25,977 | 0.91% | 1.05% | 59.69% | 30.61% | 7.73% |
The next table shows the distribution by counterparty of the book balances of allowances for financial asset losses and for contingent exposures:
TABLE 21: Distribution by sector of the book balances of the value adjustments for impairment of financial assets and contingent liabilities
2014
(Millions of euros)
|
|
Total | Credit institutions, insurance and brokerage | Public sector | Corporates | Retail | Other sectors |
|---|---|---|---|---|---|---|
| Value adjustments and provisions | 15,254 | 2.13% | 1.02% | 58.94% | 27.72% | 10.18% |
2013
|
|
Total | Credit institutions, insurance and brokerage | Public sector | Corporates | Retail | Other sectors |
|---|---|---|---|---|---|---|
| Value adjustments and provisions | 15,914 | 1.99% | 1.98% | 60.55% | 25.78% | 9.71% |
4.2.5. Distribution by residual maturity
The following table shows the distribution of original exposure by residual maturity, broken down by category of exposure under the standardized and advanced measurement approaches, excluding positions in equity:
TABLE 22: Distribution by residual maturity of exposure to credit risk
2014
(Millions of euros)
| Category of exposure | Original exposure by residual maturity | |||
|---|---|---|---|---|
| Total | Less than 1 year | Between 1 and 5 years | Over 5 years | |
| Administraciones Centrales y Bancos Centrales | 103,926 | 48,471 | 29,950 | 25,506 |
| Administraciones regionales y Autoridades Locales | 7,482 | 1,974 | 1,542 | 3,966 |
| Entidades Sector Público y otras Instituciones Públicas | 5,524 | 742 | 1,042 | 3,740 |
| Bancos Multilaterales de Desarrollo | 93 | 5,141 | 6,526 | -11,574 |
| Organizaciones Internacionales | 16 | 2 | 13 | 1 |
| Instituciones | 20,366 | -1,016 | 13,298 | 8,084 |
| Empresas | 107,908 | 20,525 | 49,438 | 37,945 |
| Minoristas | 59,973 | 24,052 | 21,151 | 14,770 |
| Garantizadas con Inmuebles | 54,500 | 3,157 | 6,896 | 44,447 |
| Situación en mora | 9,311 | 2,649 | 3,374 | 3,288 |
| Alto Riesgo | 380 | 54 | 77 | 249 |
| Bonos Garantizados | 605 | 0 | 605 | 0 |
| Instituciones y empresas C/P | 2,063 | 43 | 999 | 1,020 |
| Instituciones de Inversión Colectiva | 124 | 111 | 2 | 11 |
| Otras exposiciones | 27,105 | 7,711 | 9,823 | 9,571 |
| Posiciones en titulización | 2,723 | 3 | 186 | 2,534 |
| TOTAL RIESGO DE CRÉDITO MÉTODO ESTÁNDAR | 402,098 | 113,617 | 144,922 | 143,558 |
| Administraciones Centrales y Bancos Centrales | 3,001 | 883 | 231 | 1,887 |
| Instituciones | 112,235 | 72,927 | 16,934 | 22,374 |
| Empresas | 130,154 | 51,038 | 44,782 | 34,335 |
| Minoristas | 96,276 | 1,492 | 4,328 | 90,456 |
| Posiciones en titulización | 1,042 | 0 | 714 | 328 |
| TOTAL RIESGO DE CRÉDITO MÉTODO AVANZADO | 342,709 | 126,340 | 66,989 | 149,380 |
| TOTAL RIESGO DE CRÉDITO DILUCIÓN Y ENTREGA | 744,807 | 239,957 | 211,911 | 292,938 |
2013
| Category of exposure | Original exposure by residual maturity | |||
|---|---|---|---|---|
| Total | Less than 1 year | Between 1 and 5 years | Over 5 years | |
| Administraciones Centrales y Bancos Centrales | 93,548 | 51,537 | 27,839 | 14,172 |
| Administraciones regionales y Autoridades Locales | 9,195 | 2,617 | 1,241 | 5,337 |
| Entidades Sector Público y otras Instituciones Públicas | 4,486 | 1,916 | 1,765 | 805 |
| Bancos Multilaterales de Desarrollo | 50 | 50 | 0 | 0 |
| Organizaciones Internacionales | 8 | 0 | 8 | 0 |
| Instituciones | 20,702 | 12,030 | 5,481 | 3,191 |
| Empresas | 93,305 | 30,388 | 37,122 | 25,795 |
| Minoristas | 60,395 | 25,034 | 22,522 | 12,839 |
| Garantizadas con Inmuebles | 51,916 | 3,189 | 6,686 | 42,041 |
| Situación en mora | 14,836 | 1,078 | 13,758 | 0 |
| Alto Riesgo | 1,133 | 250 | 459 | 424 |
| Bonos Garantizados | 911 | 0 | 911 | 0 |
| Instituciones y empresas C/P | 663 | 535 | 50 | 78 |
| Instituciones de Inversión Colectiva | 816 | 810 | 0 | 6 |
| Otras exposiciones | 22,210 | 13,361 | 769 | 8,080 |
| Posiciones en titulización | 4,820 | 5 | 143 | 4,671 |
| TOTAL RIESGO DE CRÉDITO MÉTODO ESTÁNDAR | 378,995 | 142,802 | 118,754 | 117,440 |
| Administraciones Centrales y Bancos Centrales | 1,581 | 309 | 279 | 994 |
| Instituciones | 89,458 | 54,088 | 17,393 | 17,978 |
| Empresas | 114,333 | 51,103 | 35,848 | 27,381 |
| Minoristas | 96,037 | 14,876 | 3,944 | 77,217 |
| Posiciones en titulización | 910 | 277 | 434 | 199 |
| TOTAL RIESGO DE CRÉDITO MÉTODO AVANZADO | 302,319 | 120,653 | 57,897 | 123,769 |
| TOTAL RIESGO DE CRÉDITO DILUCIÓN Y ENTREGA | 681,314 | 263,454 | 176,651 | 241,209 |
4.2.6. Value adjustments for impairment losses and allowances for contingent risks and commitments
The following table presents the movement recorded in the years 2014 and 2013 in the value adjustments for allowances and impairment losses of financial assets on the balance sheet and for contingent risks and commitments, including country risk, generic and specific funds.TABLE 23: Value adjustments for impairment losses and allowances for contingent risks and commitments
2014
(Millions of euros)
| Item | Value adjustments and provisions | Provisions for contingent liabilities and commitments | Total |
|---|---|---|---|
| BALANCE AT START OF YEAR | 15,548 | 367 | 15,914 |
| Increase in impairment charged to income | 11,783 | 82 | 11,865 |
| Decrease in impairment credited to income | -6,865 | -67 | -6,932 |
| Institutions acquired by the Group during the year | 0 | 0 | 0 |
| Institutions disposed of during the year | 0 | 0 | 0 |
| Transfers to written-off loans | -4,464 | -1 | -4,464 |
| Exchange differences and others | -1,151 | 23 | -1,129 |
| BALANCE AT END OF YEAR (1) | 14,850 | 404 | 15,254 |
| Of which: |
|
|
|
| For impaired portfolio | 12,037 | 219 | 12,256 |
| For current non-impaired portfolio | 2,813 | 184 | 2,997 |
2013
(Millions of euros)
| Item | Value adjustments and provisions | Provisions for contingent liabilities and commitments | Total |
|---|---|---|---|
| BALANCE AT START OF YEAR | 14,801 | 341 | 15,142 |
| Increase in impairment charged to income | 11,054 | 96 | 11,150 |
| Decrease in impairment credited to income | -4,921 | -52 | -4,973 |
| Institutions acquired by the Group during the year | 0 | 0 | 0 |
| Institutions disposed of during the year | -30 | -1 | -31 |
| Transfers to written-off loans | -3,838 | 0 | -3,838 |
| Exchange differences and others | -1,518 | -18 | -1,521 |
| BALANCE AT END OF YEAR | 15,548 | 367 | 15,914 |
| Of which: |
|
|
|
| For impaired portfolio | 12,987 | 202 | 13,190 |
| For current non-impaired portfolio | 2,560 | 165 | 2,725 |
4.2.7. Total impairment losses for the period
The following table shows details of impairment losses and allowances on financial assets and contingent risks and commitments, as well as derecognition of losses recognized previously in asset write-offs recorded directly in the income statement in 2014 and 2013.
TABLE 24: Total impairment losses for the period
(Millions of euros)
| ITEMS | 2014 | 2013 |
|---|---|---|
| Financial assets | 4,401 | 5,628 |
| Of which: |
|
|
| Recovery of written-off assets | 443 | 362 |
| Contingent exposure and commitments (recoveries) | 15 | 44 |
| Total impairment losses | 4.417 | 5.672 |