

Counterparty exposure involves that part of the original exposure corresponding to derivative instruments, repurchase and resale transactions, securities or commodities lending or borrowing transactions and deferred settlement transactions.
4.3.1. Policies on managing counterparty risk
4.3.1.1. Methodology: allocation of internal capital and limits to exposures subject to counterparty risk
The Group has an economic model for calculating internal capital through exposure to counterparty risk in treasury operations. This model has been implemented in the Risk unit systems in Market areas. It is used to measure the credit exposures for each of the counterparties for which the entity operates.
The generation of exposures is undertaken in a manner that is consistent with those used for the monitoring and control of credit risk limits. The time horizon is divided up into intervals, and the market risk factors (interest rates, exchange rates, etc.) underlying the instruments that determine their valuation are simulated for each interval. The exposures are generated from 500 different scenarios using the Monte Carlo method for risk factors (subject to counterparty risk) and applying the corresponding mitigating factors to each counterparty (i.e. applying collateral and/or netting agreements as applicable).
The correlations, loss given defaults, internal ratings and associated probabilities of default are consistent with the Group’s economic model for general credit risk.
The capital for each counterparty is then calculated using the exposure profile and taking into account the analytical formula adopted by Basel. This figure is modified by an adjustment factor for the possible maturity subsequent to one year of the operations in a similar vein to the general approach adopted by Basel for the treatment of credit risk.
Counterparty limits are specified within the financial programs authorized for each subsidiary within the line item of treasury limits. It stipulates both the limit and the maximum term for the operation. The use of transactions within the limits is measured in terms of mark-to-market valuation plus the potential risk using the Monte Carlo Simulation methodology (95% confidence level) and bearing in mind possible mitigating factors (such as netting, break clauses or collateral contracts).
Management of consumption by lines in the Markets area is carried out through a corporate platform that enables online monitoring of the limits and availabilities established for the different counterparties and clients. This control is completed by independent units of the business area to collateral proper segregation of functions.
4.3.1.2. Policies for ensuring the effectiveness of collaterals and establishing the value adjustments for impairment to cover this risk
The Group has concluded collateral contracts with many of its counterparties that serve as a collateral of the mark-to-market valuation of derivatives operations. The collateral consists mostly of deposits, which means that no situations of impairment are forthcoming.
The MENTOR tool has been specifically designed to store and process the collateral contracts concluded with counterparties. This application enables the existence of collateral to be taken into account at the transaction level (useful for controlling and monitoring the status of specific operations) as well as at the counterparty level. Furthermore, said tool feeds the applications responsible for estimating counterparty risk by providing all the necessary parameters for considering the impact of mitigation in the portfolio due to the agreements signed.
Likewise, there is also an application that reconciles and adjusts the positions serving the Collateral and Risks units.
In order to collateral the effectiveness of collateral contracts, the Group carries out a daily monitoring of the market values of the operations governed by such contracts and of the deposits made by the counterparties. Once the amount of the collateral to be delivered or received is obtained, the collateral demand (margin call), or the demand received, is carried out at the intervals established in the contract, usually daily. If significant variations arise from the process of reconciliation between the counterparties, after a reconciliation in economic terms they are reported by the Collateral unit to the Risks unit for subsequent analysis and monitoring. Within the control process, the Collateral unit issues a daily report on the collaterals which includes a description by counterparty of the exposure and collateral, making special reference to those collateral deficits at or beyond the set warning levels.
Financial assets and liabilities may be the object of netting, in other words presentation for a net amount in the balance sheet, only when the Group's entities comply with the provisions of IAS 32 - Paragraph 42, and thus have the legally obliged right to offset the amounts recognized, and the intention to settle the net amount or to divest the asset and pay the liability at the same time.
In addition, the Group has assets and liabilities on the balance sheet that are not netted and for which there are master netting agreements, but for which there is neither the intention nor the right to settle. The most common types of events that trigger netting of reciprocal obligations include the bankruptcy of the credit institution in question, swiftly accumulating indebtedness, default, restructuring or the winding up of the entity.
In the current market context, derivatives are contracted under different framework contracts, with the most general being those developed by International Swaps and Derivatives Association (ISDA), and for the Spanish market the Framework Financial Operations Contract (CMOF). Practically all portfolio derivative operations have been concluded under these master contracts, including in them the netting clauses referred to in the above point as Master Netting Agreements, considerably reducing the credit exposure in these instruments. In addition, in the contracts concluded with professional counterparties, annexes are included with collateral agreements called Credit Support Annexes (CSA), thus minimizing exposure to a possible counterparty insolvency.
At the same time, in repurchase agreements the volume traded has increased strongly through clearing houses that use mechanisms to reduce counterparty risk, as well as through various master contracts in bilateral operations, the most common being the Global Master Repurchase Agreement (GMRA), which is published by the International Capital Market Association (ICMA). This tends to have clauses added relating to the exchange of collateral within the main body of the master contract itself.
Below are the assets and liabilities subject to contractual netting rights as of December 31, 2014.
TABLE 25: Assets and liabilities subject to contractual netting rights
(Millions of euros)
|
|
|
|
|
Non-offsetted gross balance sheet’s amount |
|
|
|---|---|---|---|---|---|---|
| 2014 | Gross Recognized Amount | Offsetted balance sheet amount | Net amount presented on balance sheet | Amount related to recognized financial instruments | Collateral (including cash) | Net amount |
| Trading and hedging derivatives | 55,277 | 8,497 | 46,780 | 33,196 | 6,844 | 6,740 |
| Total Assets | 55,277 | 8,497 | 46,780 | 33,196 | 6,844 | 6,740 |
| Trading and hedging derivatives | 56,710 | 9,327 | 47,383 | 33,158 | 9,624 | 4,601 |
| Total Liabilities | 56,710 | 9,327 | 47,383 | 33,158 | 9,624 | 4,601 |
4.3.1.3. Policies regarding the risk of adverse effects occurring due to correlations
Derivatives contracts may give rise to potential adverse correlation effects between the exposure to the counterparty and its credit quality (wrong-way-exposures). The Group has strict policies on the treatment of exposures of this nature. First, they follow specific admission processes for each individual operation, and second, they can compute the effects of risk, not for the potential value of the exposure, but for 100% of its nominal value depending on the type of operation.
4.3.1.4. Impact of collaterals in the event of a downgrade in their credit rating
In derivatives operations, as a general policy the Group does not subscribe collateral contracts that involve an increase in the amount to be deposited in the event of the Group being downgraded.
The general criterion applied to date with banking counterparties is to establish a zero threshold within collateral contracts, irrespective of the mutual rating; provision will be made as collateral of any difference that arises through mark-to-market valuation.
4.3.2. Amounts of counterparty risk
The calculation of the original exposure for the counterparty risk of derivatives, according to Part III, Title II, Chapter 6 of the Solvency Regulations, can be made by means of the following methods: original risk, mark-to-market valuation, standardized and internal models.
The Group calculates the value of exposure to risk through the mark-to-market method, obtained as the aggregate of the positive mark-to-market value after contractual netting agreements plus the potential future risk of each transaction or instrument.
There follows a specification of the amounts in million euros involved in the counterparty risk of derivatives as at December 31, 2014 and 2013:
TABLE 26: Counterparty risk. Derivatives exposure. Netting effect and collateral
(Millions of euros)
| Derivatives exposure. Netting effect and collateral | 2014 | 2013 |
|---|---|---|
| Gross positive fair value of the contracts (accounting perimeter) | 46,780 | 40,168 |
| Gross positive fair value of the contracts (solvency perimeter) | 48,911 | 42,101 |
| Add-on | 22,779 | 20,887 |
| Positive effects of netting agreements | -45,467 | -39,503 |
| Credit exposure after netting and before collateral assigned | 26,223 | 23,281 |
| Collateral assigned | -5,356 | -4,691 |
| Credit exposure in derivatives after netting and before collateral assigned | 20,867 | 18,590 |
| RWA | 7,799 | 7,945 |
The total exposure to counterparty risk, composed basically of repo transactions and OTC derivatives, is €93,506 million and €71,978 million, as of December 31, 2014 and 2013, respectively (after applying any netting agreements applicable).
Below are the EAD amounts after netting and collaterals received from the derivatives, broken down by product:
TABLE 27: Counterparty risk. EAD derivatives by product and risk
2014
(Millions of euros)
| Products | Currency risk | Interest rate risk | Equity risk | Commodity risk | Credit risk | Other risks | TOTAL |
|---|---|---|---|---|---|---|---|
| Term operations | 5,479 | 0 | 9 | 0 | 0 | 0 | 5,489 |
| FRAs | 0 | 1 | 0 | 0 | 0 | 0 | 1 |
| Swaps | 0 | 16,904 | 90 | 0 | 0 | 0 | 16,994 |
| Options | 149 | 2,282 | 991 | 1 | 0 | 0 | 3,423 |
| Other products | 0 | 0 | 0 | 0 | 316 | 0 | 316 |
| TOTAL | 5,629 | 19,187 | 1,090 | 1 | 316 | 0 | 26,223 |
2013
| Products | Currency risk | Interest rate risk | Equity risk | Commodity risk | Credit risk | Other risks | TOTAL |
|---|---|---|---|---|---|---|---|
| Term operations | 2,895 | 76 | 95 | 0 | 0 | 0 | 3,066 |
| FRAs | 0 | 117 | 0 | 0 | 0 | 0 | 117 |
| Swaps | 654 | 16,162 | 105 | 9 | 0 | 0 | 16,930 |
| Options | 199 | 1,710 | 957 | 3 | 0 | 2 | 2,872 |
| Other products | 2 | 34 | 0 | 0 | 259 | 0 | 296 |
| TOTAL | 3,750 | 18,099 | 1,158 | 12 | 259 | 3 | 23,281 |
4.3.2.1. Credit derivative transactions
The table below shows the amounts corresponding to transactions with credit derivatives used in intermediation activities:
CHART 6: EAD for derivatives broken down by risk
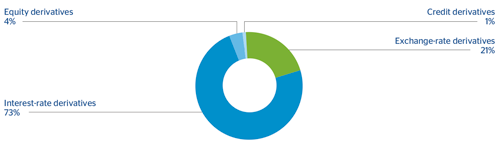
TABLE 28: Counterparty risk. Transactions with credit derivatives used in intermediation activities
2014
(Millions of euros)
| Classification of derivatives | Total notional amount of the transactions | Types of Derivatives | |||
|---|---|---|---|---|---|
| (CDS) on individual names | On indexes (CDSI) | Nth to default baskets | Derivatives on tranches (CDO) | ||
| Protection purchased | 22,843 | 7,817 | 14,300 | 551 | 175 |
| Protection sold | 22,291 | 8,222 | 13,811 | 82 | 175 |
2013
(Millions of euros)
| Classification of derivatives | Total notional amount of the transactions | Types of Derivatives | |||
|---|---|---|---|---|---|
| (CDS) on individual names | Classification of derivatives | Total notional amount of the transactions | (CDS) on individual names | ||
| Protection purchased | 20,692 | 9,381 | 10,173 | 652 | 486 |
| Protection sold | 20,387 | 9,802 | 10,027 | 75 | 483 |
As of year-end 2014 and 2013, the Group did not use credit derivatives in brokerage activities as collateral.