Banking activity in Spain
Highlights
- Ongoing deleveraging and increase in more liquid customer funds and mutual funds.
- Good performance of net fees and commissions.
- Faster pace of decline in operating expenses.
- Further reduction in the cost of risk.
- Positive trend in risk indicators.
Business activity (1)
(Year-on-year change. Data as of 30-09-2017)
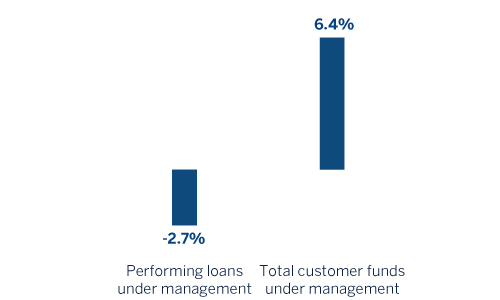
(1) Excluding repos.
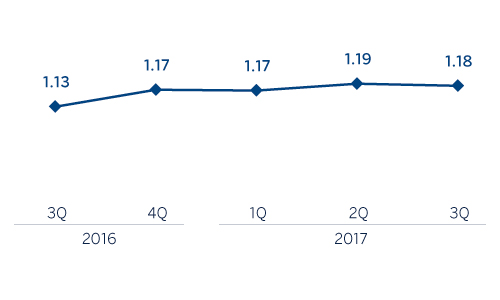
Net interest income/ATAs
(Percentage)
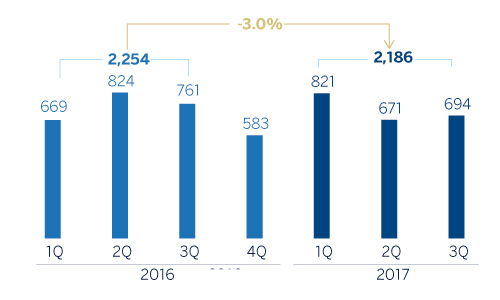
Operating income (Million euros)
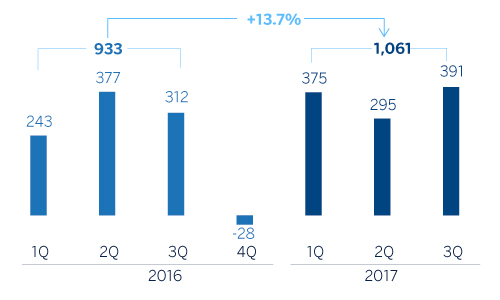
Net attributable profit (Million euros)
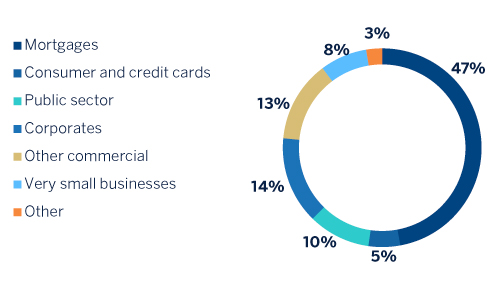
Breakdown of performing loans under management (1)
(30-09-2017)
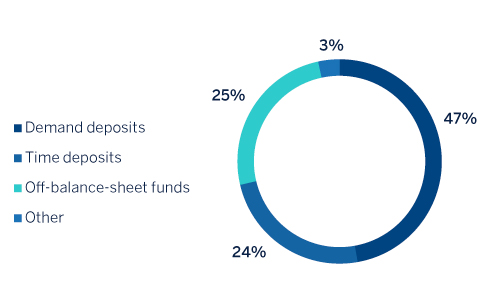
Breakdown of customer funds under management (1)
(30-09-2017)
(1) Excluding repos.
(1) Excluding repos.
Macro and industry trends
According to the latest data from the National Institute for Statistics (INE), the Spanish economy accelerated again in the second quarter of 2017, registering quarterly GDP growth of 0.9%, thanks to stronger domestic demand and a larger contribution from net exports. The latest available data suggest a moderate slowdown in growth in the second half of 2017 amid greater uncertainty. However, the fundamentals of both domestic and global activity remain supportive of robust growth. BBVA Research forecasts GDP growth will remain above 3% in 2017.
The Spanish banking system, continues to operate against the backdrop of a deleveraging economy. According to the latest Bank of Spain data for August, total domestic private-sector lending has fallen by 2.6% over the last twelve months, although cumulative new lending to August rose by 4.4% over the same period (up 6.8% in the case of new lending to households and SMEs, which has risen consistently for 44 consecutive months). Asset quality indicators continue to improve, despite the reduction in lending, thanks to the decline in non-performing loans (down 12.1% year-on-year and 46% on the peak in December 2013). As a result, the NPL ratio for the system as a whole has fallen by 94 basis points over the last twelve months to 8.48% (data as of August 2017). In general, Spanish banks have a comfortable liquidity position. The funding gap (difference between the volume of loans and total deposits) reached a new record low in August, at slightly below 4% of the total balance sheet. Finally, September 2017 data shows that banks increased their recourse to ECB liquidity by 27% over the last twelve months, taking advantage of the final TLTRO (targeted longer-term refinancing operations) auctions.
Activity
Lending (performing loans under management) remains on a downward path, declining by 1.6% to 30-Sep-2017 relative to the end of December 2016 (down 1.2% over the quarter). This was primarily driven by a reduction in the mortgage (down 4.1% over the last nine months and down 0.8% over the quarter) and public sector portfolios (down 8.0% and 6.5% respectively). In contrast, business loans (up 3.6% since 2016 and up 0.9% in the quarter) and consumer finance (up 28.3% and 13.7% respectively) have performed well, driven particularly by the good performance of new loan production with cumulative year-on-year growth figures to September 2017 of 12.3% for companies and 30.7% in consumer finance.
Regarding asset quality, additions to NPLs declined. Despite the decline in lending, this has pushed the NPL ratio for the area down by 8 basis points over the last three months to 5.6%. The coverage ratio stands at 52%.
Customer deposits under management rose 1.4%, relative to the end of December 2016 and the end of the first half of 2017. Time deposits continue to decline (down 19% so far this year and 5.0% over the quarter), once again offset by an increase in current and savings accounts (up 13.1% and 2.4% respectively).
Finally, off-balance-sheet remain on an upward trend with growth of 7.0% over the first nine months and 2.0% over the quarter. This performance continues to be largely driven by the progress made by mutual funds (up 11.1% over the first nine months and 2.7% over the quarter).
Results
The key aspects of the income statement in the area are:
- Third quarter net interest income remains at very similar levels to the second quarter, thanks to good management of the customer spread. However, the 3.9% year-or-year cumulative decline is the result of lower loan volumes and sales of whosale portfolios.
- Good performance of net fees and commissions, thanks mainly to the posive contribution from whosale businesses. They have increased by 4.3% compared with the same period of 2016.
- Smaller contribution from NTI relative to the first nine months of 2016, strongly affected by capital gains (€138m before tax) from the VISA deal in the second quarter of the previous year.
- An increase in the other income/expenses heading of 22,4% year-on-year. A highlight in this category is insurance activities, whose net result (included in this heading) grew by 7.3%, strongly linked to the increase in new policies in the quarter and the low claims ratio. This line also includes a smaller annual contribution to the SRF (€98m before taxes in the second quarter of 2017, compared with €117m in the same period of 2016).
- As a result, gross income in the area declined by 4.3% year-on-year, mainly due to a smaller volume of lending, sales of wholesale portfolios and the NTI generated in the 2016 VISA deal.
- Operating expenses continue to decline, by 5.4% relative to the same period of 2016 (down 1.9% in the last quarter). This reduction is still linked to the synergies related to the integration of Catalunya Banc and the continued implementation of efficiency plans.
- As a result of the above, the efficiency ratio closed at 53.8% (53.4% in the first half of 2017 and 55.8% in 2016) and operating income stands at 3.0% below the first nine months of 2016.
- Impairment losses on financial assets have declined 40.5% year-on-year as a result of lower loan-loss provisioning requirements. The area's cumulative cost of risk continues improving, standing at 0.32% as of 30-Sep-2017.
- Finally, the provisions (net) and other gains (losses) heading increased by 37.9% year-on-year, mainly due to increased restructuring costs, above all during the first half of the year.
As a result, the net attributable profit generated by Banking Activity in Spain in the first nine months of 2017 stands at €1,061m, a year-on-year increase of 13.7%, strongly influenced by the positive performance of operating expenses and loan-loss provisions.
Financial statements and relevant business indicators (Million euros and percentage)
| Income statement | Jan.-Sep. 17 | ∆% | Jan.-Sep. 16 |
|---|---|---|---|
| Net interest income | 2,791 | (3.9) | 2,904 |
| Net fees and commissions | 1,173 | 4.3 | 1,125 |
| Net trading income | 394 | (35.6) | 611 |
| Other income/expenses | 375 | 22.4 | 306 |
| of which insurance activities (1) | 331 | 7.3 | 309 |
| Gross income | 4,733 | (4.3) | 4,946 |
| Operating expenses | (2,547) | (5.4) | (2,692) |
| Personnel expenses | (1,441) | (4.7) | (1,512) |
| Other administrative expenses | (866) | (7.5) | (936) |
| Depreciation | (240) | (1.8) | (244) |
| Operating income | 2,186 | (3.0) | 2,254 |
| Impairment on financial assets (net) | (429) | (40.5) | (721) |
| Provisions (net) and other gains (losses) | (290) | 37.9 | (210) |
| Profit/(loss) before tax | 1,467 | 10.9 | 1,323 |
| Income tax | (404) | 4.0 | (388) |
| Profit/(loss) for the year | 1,063 | 13.7 | 935 |
| Non-controlling interests | (2) | 3.0 | (2) |
| Net attributable profit | 1,061 | 13.7 | 933 |
- (1) Includes premiums received net of estimated technical insurance reserves.
| Balance sheets | 30-09-17 | ∆% | 31-12-16 |
|---|---|---|---|
| Cash, cash balances at central banks and other demand deposits | 9,543 | (22.0) | 12,230 |
| Financial assets | 89,526 | (10.8) | 100,394 |
| Loans and receivables | 207,216 | (3.4) | 214,497 |
| of which loans and advances to customers | 177,302 | (2.1) | 181,137 |
| Inter-area positions | 3,443 | (26.1) | 4,658 |
| Tangible assets | 995 | (30.7) | 1,435 |
| Other assets | 2,224 | (15.5) | 2,632 |
| Total assets/liabilities and equity | 312,948 | (6.8) | 335,847 |
| Financial liabilities held for trading and designated at fair value through profit or loss | 35,885 | (11.4) | 40,490 |
| Deposits from central banks and credit institutions | 50,599 | (23.4) | 66,029 |
| Deposits from customers | 183,314 | 1.5 | 180,544 |
| Debt certificates | 33,788 | (11.8) | 38,322 |
| Inter-area positions | - | - | - |
| Other liabilities | 463 | (62.1) | 1,220 |
| Economic capital allocated | 8,898 | (3.7) | 9,242 |
| Relevant business indicators | 30-09-17 | ∆% | 31-12-16 |
|---|---|---|---|
| Loans and advances to customers (gross) (1) | 177,249 | (1.9) | 180,595 |
| Non-performing loans and guarantees given | 11,245 | (4.9) | 11,819 |
| Customer deposits under management (1) | 177,173 | 1.4 | 174,809 |
| Off-balance sheet funds (2) | 60,049 | 7.0 | 56,147 |
| Risk-weighted assets | 106,302 | (6.1) | 113,194 |
| Efficiency ratio (%) | 53.8 | 55.8 | |
| NPL ratio (%) | 5.6 | 5.8 | |
| NPL coverage ratio (%) | 52 | 53 | |
| Cost of risk (%) | 0.32 | 0.32 |
- (1) Excluding repos.
- (2) Includes mutual funds. pension funds and other off-balance sheet funds.