South America
Highlights
- Activity continues to grow at a good pace.
- More recurring revenue items performing very well.
- Expenses increasing below inflation and the growth in gross income.
- Stable risk indicators.
Business activity (1)
(Year-on-year change at constant exchange rate. Data as of 30-09-2017)
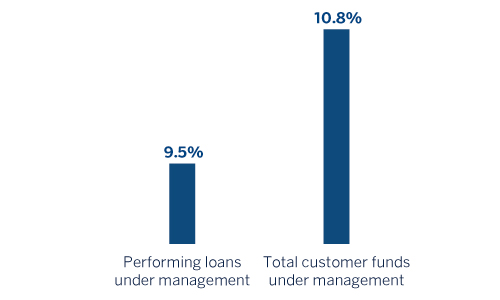
(1) Excluding repos.
Net interest income/ATAs
(Percentage. Constant exchange rate)
Operating income
(Million euros at constant exchange rate)

(1)At current exchange rate: +13.8%.
Net attributable profit
(Million euros at constant exchange rate)

(1) At current exchange rate: +6.9%.
Breakdown of performing loans under management (1)
(30-09-2017)

(1) Excluding repos.
Breakdown of customer funds under management (1)
(30-09-2017)

(1) Excluding repos.
Macro and industry trends
South America is starting to show signs of a moderate recovery. Most countries in BBVA's regional footprint have been registering growth since the first quarter of 2017, reflecting the good performance of the export sector, fueled by an improvement in commodity prices. On top of this, uncertainty has eased, leading to a slight improvement in confidence levels, which are still weak. BBVA Research expects the export sector to continue driving the current recovery, supported by investment and, to a lesser degree, by consumption. This will lead to an slight positive increase in growth this year. The region's economy is expected to gather momentum over the coming years, with growth approaching its potential.
Most South American countries are experiencing a downward adjustment in inflation due to recent exchange rate stability and stronger commodity prices (except Argentina). Against this backdrop of low inflation, and with the goal of supporting the recovery, central banks in the region are continuing to implement expansive monetary policy.
As regards the financial systems within BBVA's regional footprint, the macroeconomic backdrop and reduced levels of banking penetration in these countries in aggregate terms (obviously with differences between countries) are producing strong results in terms of the main indicators of profitability and solvency, while non-performing loans remain under control. In addition, there has been sustained growth in lending and deposits.
Activity
All the comments below on rates of change, for both activity and earnings, will be given at constant exchange rate, unless expressly stated otherwise. These rates, together with changes at the current exchange rate, can be seen in the attached tables of financial statements and relevant business indicators.
Lending (performing loans under management) increased by 5.7% relative to December 2016 and 4.6% over the quarter. By segments, the strong performance of the individual customer segment (particularly consumer finance, credit cards and, to a lesser degree, mortgages) outpaced growth in the commercial and public sectors. By country, the fastest growth continues to be in Argentina (up 39.4%), Chile (up 4.9%) and Colombia (up 4.4%). Overall, year-on-year growth in the area's loan book accelerated to 9.5%.
In terms of asset quality, the NPL ratio closed 30-Sep-2017 at 3.5%. This was practically the same level as the close of the first half of 2017. The NPL coverage ratio also held steady relative to June 2017 at 94%.
Customer funds have grown over the course of the year by 6.2% (up 10.8% year-on-year). This trend is explained by the good performance of transactional funds (up 6.9% since December and up 16.6% year-on-year in current and savings accounts) and off-balance-sheet funds (up 15.2% and 15.3% respectively). The trends are particularly positive in Argentina (up 17.8% relative to December 2016), Paraguay (up 7.1%), Colombia (up 6.0%) and, to a lesser degree, Peru (up 0.6%).
Results
South America posted a cumulative net attributable profit of €616m, up 5.4% year-on-year (up 6.9% at current exchange rates). The key aspects of the year-on-year changes in the income statement in the area are:
- Gross income has grown by 13.1%, thanks to the strong capacity to generate recurring revenues in the area. Net interest income outpaced growth in the loan book (up 12.9%), on the back of greater volumes and effective price management, while net fees and commissions rose by 15.9%. There was a slight reduction in NTI, which was affected by more buoyant earnings from capital gains on the sale of holdings during the same period of 2016.
- Operating expenses increased by less than gross income (up 10.8%) due to cost controls implemented in all the countries. In fact, growth in this heading outpaced the inflation rate in most of the countries.
- The pace of growth in impairment losses on financial assets slowed to 44.5%. This heading is affected by the impact of provisions associated with one particular customer. However, the slowdown puts the cumulative cost of risk at 1.51% to the end of September, slightly below the first half of 2017 (1.52%).
By country, recurring revenues performed well in Argentina: growth in net interest income continues accelerating and cumulative net fees and commissions are performing excellently. However, expenses remain affected by high inflation. In July, BBVA Francés carried out a USD 400m share capital increase to finance the bank's organic growth, given the good economic outlook for the country, which has resulted in a higher charge under the non-controlling interests heading. As a result of the above, net attributable profit increased by 1.6% year-on-year. In Chile, positive developments in gross income (net interest income is growing thanks to growth in lending and effective management of customer spreads) and the decline in expenses comfortably offset the rise in loan-loss provisioning and the increase in the nominal tax rate. Accordingly, the country recorded 32.0% higher net attributable profit relative to January-September 2016. In Colombia gross income performed strongly, thanks to positive figures from net interest income and net fees and commissions, albeit mitigated by smaller NTI (the same period of 2016 included capital gains from the disposal of equity holdings) and an increase in loan-loss provisioning. As a result, net attributable profit was 22.3% lower than in the same period of 2016. In Peru, net attributable profit grew by 4.5% when compared to the figure for the first nine months of last year. However, the good NTI performance and a reduction in expenses were largely mitigated by moderate growth in recurring revenues and greater loan-loss provisions.
Financial statements and relevant business indicators (Million euros and percentage)
| Income statement | Jan.-Sep. 17 | ∆% | ∆%(1) | Jan.-Sep. 16 |
|---|---|---|---|---|
| Net interest income | 2,393 | 9.7 | 12.9 | 2,182 |
| Net fees and commissions | 532 | 13.0 | 15.9 | 470 |
| Net trading income | 350 | (21.2) | (0.4) | 444 |
| Other income/expenses | 65 | n.s. | 165.6 | (81) |
| Gross income | 3,340 | 10.7 | 13.1 | 3,016 |
| Operating expenses | (1,513) | 7.3 | 10.8 | (1,410) |
| Personnel expenses | (782) | 6.8 | 9.4 | (732) |
| Other administrative expenses | (641) | 6.0 | 10.2 | (604) |
| Depreciation | (91) | 22.2 | 30.5 | (74) |
| Operating income | 1,827 | 13.8 | 15.0 | 1,606 |
| Impairment on financial assets (net) | (555) | 44.7 | 44.5 | (383) |
| Provisions (net) and other gains (losses) | (63) | 137.3 | 12.4 | (27) |
| Profit/(loss) before tax | 1,209 | 1.1 | 5.3 | 1,196 |
| Income tax | (347) | (15.0) | 0.9 | (408) |
| Profit/(loss) for the year | 862 | 9.5 | 7.1 | 788 |
| Non-controlling interests | (246) | 16.5 | 11.6 | (212) |
| Net attributable profit | 616 | 6.9 | 5.4 | 576 |
| Balance sheets | 30-09-17 | ∆% | ∆%(1) | 31-12-16 |
|---|---|---|---|---|
| Cash, cash balances at central banks and other demand deposits | 6,814 | (35.6) | (24.0) | 10,586 |
| Financial assets | 12,110 | 12.8 | 23.3 | 10,739 |
| Loans and receivables | 52,144 | (3.5) | 6.8 | 54,057 |
| of which loans and advances to customers | 46,990 | (3.5) | 6.8 | 48,718 |
| Tangible assets | 726 | (10.0) | 8.1 | 807 |
| Other assets | 1,689 | (2.4) | 8.6 | 1,729 |
| Total assets/liabilities and equity | 73,483 | (5.7) | 5.2 | 77,918 |
| Financial liabilities held for trading and designated at fair value through profit or loss | 2,476 | (4.2) | 2.9 | 2,585 |
| Deposits from central banks and credit institutions | 7,776 | 16.8 | 27.1 | 6,656 |
| Deposits from customers | 44,374 | (7.4) | 4.4 | 47,927 |
| Debt certificates | 7,029 | (5.6) | 1.9 | 7,447 |
| Other liabilities | 9,004 | (15.1) | 5.3 | 10,600 |
| Economic capital allocated | 2,826 | 4.5 | 18.0 | 2,703 |
| Relevant business indicators | 30-09-17 | ∆% | ∆%(1) | 31-12-16 |
|---|---|---|---|---|
| Loans and advances to customers (gross) (2) | 48,608 | (3.4) | 7.0 | 50,316 |
| Non-performing loans and guarantees given | 1,865 | 14.0 | 24.4 | 1,637 |
| Customer deposits under management (3) | 44,586 | (7.8) | 4.0 | 48,334 |
| Off-balance sheet funds (4) | 12,249 | 2.9 | 15.2 | 11,902 |
| Risk-weighted assets | 53,923 | (6.1) | 5.8 | 57,443 |
| Efficiency ratio (%) | 45.3 | 46.7 | ||
| NPL ratio (%) | 3.5 | 2.9 | ||
| NPL coverage ratio (%) | 94 | 103 | ||
| Cost of risk (%) | 1.51 | 1.15 |
- (1) Figures at constant exchange rate.
- (2) Excluding repos.
- (3) Excluding repos and including specific marketable debt securities.
- (4) Includes mutual funds, pension funds and other off-balance sheet funds.
South America. Data per country (Million euros)
| Operating income | Net attributable profit | |||||||
|---|---|---|---|---|---|---|---|---|
| Country | Jan.-Sep 17 | ∆% | ∆% (1) | Jan.-Sep 16 | Jan-Sep 17 | ∆% | ∆% (1) | Jan-Sep 16 |
| Argentina | 381 | (4.6) | 6.5 | 400 | 163 | (9.0) | 1.6 | 179 |
| Chile | 316 | 27.2 | 22.1 | 249 | 138 | 37.5 | 32.0 | 100 |
| Colombia | 476 | 26.5 | 21.5 | 377 | 133 | (19.1) | (22.3) | 164 |
| Peru | 547 | 9.4 | 5.9 | 500 | 130 | 8.0 | 4.5 | 120 |
| Other countries (1) | 106 | 31.1 | 68.6 | 81 | 52 | n.s. | 116.4 | 13 |
| Total | 1,827 | 13.8 | 15.0 | 1,606 | 616 | 6.9 | 5.4 | 576 |
- (1) Figures at constant exchange rate.
- (2) Venezuela, Paraguay, Uruguay and Bolivia. Additionally, it includes eliminations and other charges.
South America. Relevant business indicators per country (Million euros)
| Argentina | Chile | Colombia | Peru | |||||
|---|---|---|---|---|---|---|---|---|
| 30-09-17 | 31-12-16 | 30-09-17 | 31-12-16 | 30-09-17 | 31-12-16 | 30-09-17 | 31-12-16 | |
| Loans and advances to customers (gross) (1.2) | 5,396 | 3,696 | 14,472 | 13,769 | 12,320 | 11.603 | 13,259 | 13,334 |
| Deposits from customers | 43 | 36 | 385 | 404 | 685 | 455 | 651 | 649 |
| Customer deposits under management (1.3) | 6,230 | 5,498 | 9,146 | 9,441 | 11,991 | 11,584 | 12,206 | 12,266 |
| Off-balance sheet funds (1.4) | 1,278 | 877 | 1,609 | 1,402 | 1,004 | 676 | 1,537 | 1,394 |
| Risk-weighted assets | 8,540 | 8,717 | 13,652 | 14,300 | 12,001 | 12,185 | 15,203 | 17,400 |
| Efficiency ratio (%) | 56.7 | 53.8 | 45.2 | 49.1 | 36.6 | 38.9 | 35.6 | 35.8 |
| NPL ratio (%) | 0.8 | 0.8 | 2.4 | 2.6 | 5.4 | 3.5 | 3.9 | 3.4 |
| NPL coverage ratio (%) | 288 | 391 | 66 | 66 | 87 | 105 | 103 | 106 |
| Cost of risk (%) | 1.12 | 1.48 | 0.78 | 0.74 | 2.74 | 1.34 | 1.48 | 1.31 |
- (1) Figures at constant exchange rates.
- (2) Excluding repos.
- (3) Excluding repos and including specific marketable debt securities.
- (4) Includes mutual funds, pension funds and other off-balance sheet funds.