Mexico
Highlights
- Good performance in activity.
- Positive trend in customer spreads.
- Costs still increasing below gross income, and double-digit year-on-year growth in net attributable profit.
- Stable asset quality indicators.
Business activity (1)
(Year-on-year change at constant exchange rate. Data as of 30-09-2017)
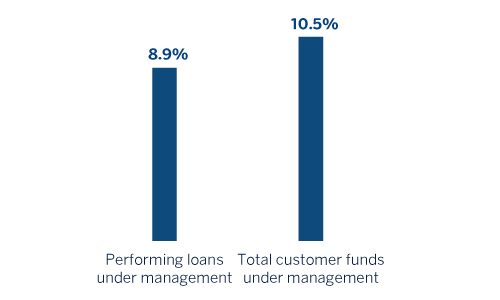
(1) Excluding repos.
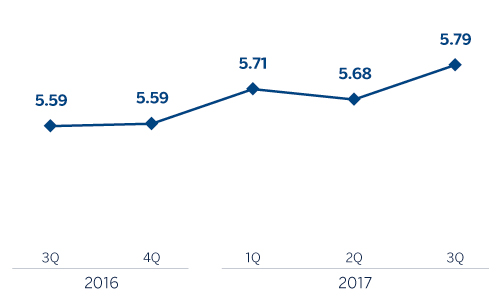
Net interest income/ATAs
(Percentage. Constant exchange rate)
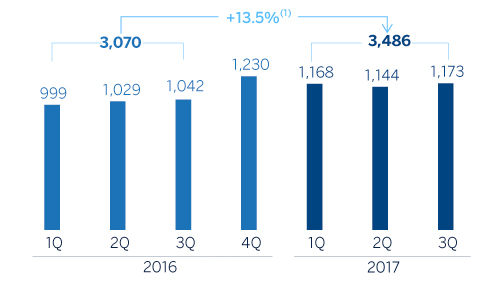
Operating income
(Million euros at constant exchange rate)
Net attributable profit
(Million euros at constant exchange rate)
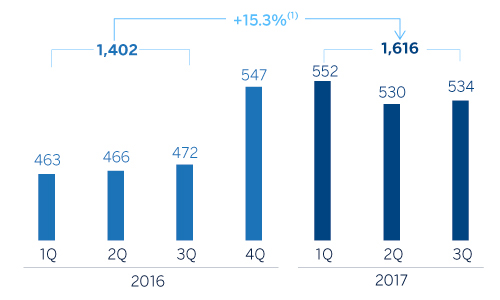
(1) At current exchange rate: +10.4%.
(1) At current exchange rate: +12.1%.
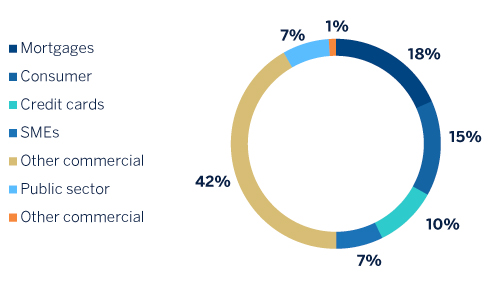
Breakdown of performing loans under management (1)
(30-09-2017)
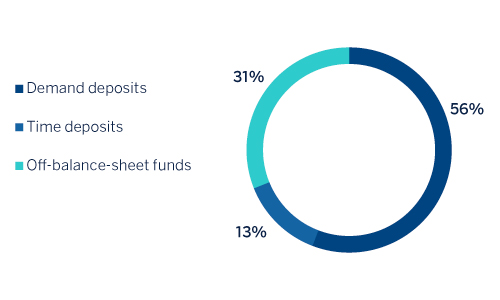
Breakdown of customer funds under management (1)
(30-09-2017)
(1) Excluding repos.
(1) Excluding repos.
Macro and industry trends
Activity growth in Mexico was stronger than expected in the first six months of the year. Dynamic private consumption and, on the supply side, the strength of the services sector (compared to a more subdued industrial sector) were the main drivers of growth. The negative impacts of the recent earthquakes are not expected to be very significant. In fact, they could have a positive impact on activity over the medium-term, primarily due to the reconstruction effort. Given this situation, BBVA Research is more optimistic about the level of expected growth in 2017, although the economy is set to slow in the second half of the year relative to the first six months.
Headline inflation appears to have peaked in August, while core inflation continues to stabilize. A gradual deceleration is expected for the rest of the year. Against this backdrop, with Banxico maintaining the key policy rate on hold, the monetary policy stance is hardening.
The Mexican banking system has sustained very favorable capital adequacy and asset quality indicators for a number of years. According to the latest data released by the National Securities Banking Commission (CNBV), the capital adequacy ratio stood at 15.65% at the close of July 2017, well above minimum requirements. The total volume of lending in the system increased by 10.9% year-on-year through August 2017, with a lower NPL ratio of 2.12% (30 basis points below last year) and a coverage ratio of 159% (11 percentage points above August 2016). All the main loan portfolios saw year-on-year growth of close to or slightly above 10%. Deposits from customers in the system (demand and time) rose by 10.0% year-on-year, also through August 2017.
Activity
All rates of change given below, for both activity and earnings, will be given at constant exchange rate, unless expressly stated otherwise. These rates, together with changes at current exchange rate, can be seen in the attached tables of financial statements and relevant business indicators.
BBVA's loan book (performing loans under management) in Mexico increased by 4.5% since December 2016 and 2.1% over the third quarter. As a result, BBVA Bancomer retains its leadership position, with a market share for its performing portfolio of 23.2% (according to the latest local information from the CNBV as of August 2017).
The weight of the retail and wholesale portfolios was practically equal at the end of September (50% and 50% respectively). Wholesale lending was up 4.1% since December and 3.0% over the quarter. Business loans continue to perform particularly well, including loans to corporate clients and mid-sized companies, rising by 7.3% so far this year excluding developer loans. Meanwhile lending to housing developers has remained on a positive trend since last year, with an increase of 6.3% in the first nine months of the year.
The retail portfolio has registered growth of 4.9% since December 2016 and 1.2% over the third quarter. This portfolio continues to be buoyed mainly by lending to SMEs and for auto finance, which rose 10.6% and 9.1% respectively over the last nine months. Meanwhile, credit cards declined by 0.7% over the same period, though new production during the first nine months of the year rose by 9.1% year-on-year. The mortgage portfolio continues to show the effect of maturities on the overall amount, which has increased by 4.7% since December 2016.
These developments in lending have been accompanied by asset quality indicators which remained stable relative to June 30, 2017 and March 31, 2017. Accordingly, the NPL and NPL coverage ratios stood at 2.3% and 126% respectively at the end of September.
Total customer funds (customer deposits under management, mutual funds and other off-balance-sheet funds) posted year-on-year growth of 10.0% over the first nine months (up 6.1% in the third quarter). All items continued to perform positively: current and savings accounts rose 9.8% year-on-year (up 6.0% over the quarter), and time deposits grew by 12.6% (up 8.9% over the quarter). BBVA in Mexico has a profitable funding mix with low-cost items continuing to account for over 80% of total customer deposits under management. Mutual funds registered growth of 8.3% on the close of 2016 and 4.7% relative to the end of the second quarter of 2017.
Results
The highlights of Mexico's cumulative income statement to September 2017 are summarized below:
- Positive performance of net interest income, with a year-on-year increase of 9.5%, driven primarily by greater activity volumes and the favorable development of customer spreads.
- Good performance of net fees and commissions, with growth of 9.7% over the last twelve months. These remain strongly influenced by an increased volume of transactions with credit card customers and fees from online and investment banking.
- Strong growth in NTI (up 31.5% year-on-year), thanks to a very good performance from the Global Markets unit in the first part of the year.
- In other income/expenses heading (up 18.7% year-on-year), earnings from insurance activity performed strongly , partly due to the change introduced at the end of 2016 relating to the method for calculating mathematical reserves.
- Operating expenses continued to grow at a controlled pace (up 4.9% year-on-year), below both the area's gross income growth (up 10.4%) and the country's inflation rate. As a result, the efficiency ratio stood at 34.4% through September 2017.
- Impairment losses on financial assets grew by 8.9% year-on-year, in line with the increase in the loan-book over the same period (up 8.9%). The above puts the area's cumulative cost of risk at 3.36%.
Overall, BBVA in Mexico posted a net attributable profit for the first nine months of the year of €1,616m, a year-on-year increase of 15.3%.
Financial statements and relevant business indicators (Million euros and percentage)
| Income statement | Jan.-Sep. 17 | ∆% | ∆%(1) | Jan.-Sep. 16 |
|---|---|---|---|---|
| Net interest income | 4,078 | 6.5 | 9.5 | 3,829 |
| Net fees and commissions | 906 | 6.6 | 9.7 | 849 |
| Net trading income | 180 | 27.9 | 31.5 | 141 |
| Other income/expenses | 152 | 15.5 | 18.7 | 132 |
| Gross income | 5,317 | 7.4 | 10.4 | 4,952 |
| Operating expenses | (1,831) | 2.0 | 4.9 | (1,795) |
| Personnel expenses | (789) | 2.1 | 4.9 | (773) |
| Other administrative expenses | (847) | 1.1 | 3.9 | (838) |
| Depreciation | (195) | 6.1 | 9.1 | (183) |
| Operating income | 3,486 | 10.4 | 13.5 | 3,157 |
| Impairment on financial assets (net) | (1,269) | 6.0 | 8.9 | (1,198) |
| Provisions (net) and other gains (losses) | (9) | (44.0) | (42.4) | (16) |
| Profit/(loss) before tax | 2,208 | 13.7 | 16.9 | 1,943 |
| Income tax | (592) | 18.2 | 21.5 | (501) |
| Profit/(loss) for the year | 1,616 | 12.1 | 15.2 | 1,442 |
| Non-controlling interests | (0) | (50.4) | (49.0) | (1) |
| Net attributable profit | 1,616 | 12.1 | 15.3 | 1,441 |
| Balance sheets | 30-09-17 | ∆% | ∆%(1) | 31-12-16 |
|---|---|---|---|---|
| Cash. cash balances at central banks and other demand deposits | 4,228 | (18.6) | (19.7) | 5,192 |
| Financial assets | 29,910 | (4.4) | (5.7) | 31,273 |
| Loans and receivables | 51,302 | 6.9 | 5.4 | 47,997 |
| of which loans and advances to customers | 49,338 | 6.2 | 4.6 | 46,474 |
| Tangible assets | 1,897 | (3.1) | (4.5) | 1,957 |
| Other assets | 9,905 | 43.6 | 41.5 | 6,900 |
| Total assets/liabilities and equity | 97,242 | 4.2 | 2.7 | 93,318 |
| Financial liabilities held for trading and designated at fair value through profit or loss | 8,322 | (16.4) | (17.6) | 9,961 |
| Deposits from central banks and credit institutions | 7,657 | 29.3 | 27.4 | 5,923 |
| Deposits from customers | 54,932 | 8.6 | 7.1 | 50,571 |
| Debt certificates | 7,973 | (7.4) | (8.7) | 8,611 |
| Other liabilities | 14,416 | 3.4 | 1.9 | 13,941 |
| Economic capital allocated | 3,942 | (8.6) | (9.9) | 4,311 |
| Relevant business indicators | 30-09-17 | ∆% | ∆%(1) | 31-12-16 |
|---|---|---|---|---|
| Loans and advances to customers (gross) (2) | 50,779 | 6.1 | 4.6 | 47,865 |
| Non-performing loans and guarantees given | 1,225 | 6.3 | 4.8 | 1,152 |
| Customer deposits under management (2) | 46,991 | 11.9 | 10.3 | 41,989 |
| Off-balance sheet funds (3) | 21,192 | 10.9 | 9.3 | 19,111 |
| Risk-weighted assets | 47,624 | (0.5) | (1.9) | 47,863 |
| Efficiency ratio (%) | 34.4 | 35.4 | ||
| NPL ratio (%) | 2.3 | 2.3 | ||
| NPL coverage ratio (%) | 126 | 127 | ||
| Cost of risk (%) | 3.36 | 3.40 |
(1) Figures at constant exchange rate.
(2) Excluding repos.
(3) Includes mutual funds, pension funds and other off-balance sheet funds.