Outstanding results in 2019
in a challenging environment thanks to record-high recurring revenue and exemplary cost management
EFFICIENCY RATIO
(At constant exchange rates)
NET ATTRIBUTABLE PROFIT
(€ Mill)
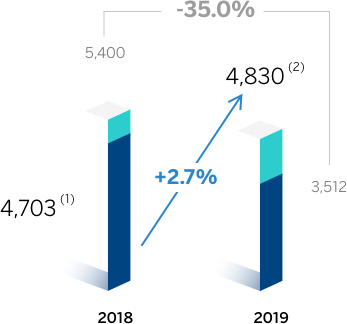
(1) Excluding earnings generated by BBVA Chile until its sale on July 6, 2018 and the net capital gains from the operation.
(2) Excluding the goodwil impairment in the United States.
BBVA Group highlights
Consolidated figures
| IFRS 9 | IAS 39 | |||
|---|---|---|---|---|
| 31-12-19 | ∆% | 31-12-18 | 31-12-17 | |
| Balance sheet (millions of euros) | ||||
| Total assets | 698,690 | 3.3 | 676,689 | 690,059 |
| Loans and advances to customers (gross) | 394,763 | 2.2 | 386,225 | 400,369 |
| Deposits from customers | 384,219 | 2.2 | 375,970 | 376,379 |
| Total customer funds | 492,022 | 3.8 | 474,120 | 473,088 |
| Total equity | 54,925 | 3.9 | 52,874 | 53,323 |
| Income statement (millions of euros) | ||||
| Net interest income | 18,202 | 3.5 | 17,591 | 17,758 |
| Gross income | 24,542 | 3.3 | 23,747 | 25,270 |
| Operating income | 12,639 | 4.9 | 12,045 | 12,770 |
| Net attributable profit (1) | 4,830 | 2.7 | 4,703 | 4,637 |
| The BBVA share and share performance ratios | ||||
| Number of shares (millions) | 6,668 | - | 6,668 | 6,668 |
| Share price (euros) | 4.98 | 7.5 | 4.64 | 7.11 |
| Earning per share (euros) (1)(2) | 0.66 | 3.4 | 0.64 | 0.63 |
| Book value per share (euros) | 7.32 | 2.8 | 7.12 | 6.96 |
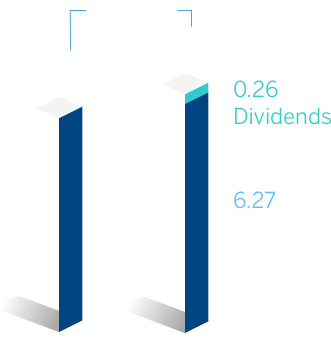
| Tangible book value per share (euros) | 6.27 | 7.1 | 5.86 | 5.69 |
| Market capitalization (millions of euros) | 33,226 | 7.5 | 30,909 | 47,422 |
| Yield (dividend/price; %) | 5.2 | 5.4 | 4.2 | |
| Significant ratios (%) | ||||
| ROE (net attributable profit/average shareholders’ funds +/- average accumulated other comprehensive income) (1) | 9.9 | 10.2 | 9.7 | |
| ROTE (net attributable profit/average shareholders’ funds excluding average intangible assets +/- average accumulated other comprehensive income) ( (1) | 11.9 | 12.4 | 12.0 | |
| ROA (Profit or loss for the year/average total assets) (1) | 0.82 | 0.81 | 0.84 | |
| RORWA (Profit or loss for the year/average risk-weighted assets - RWA) (1) | 1.57 | 1.56 | 1.57 | |
| Efficiency ratio | 48.5 | 49.3 | 49.5 | |
| Cost of risk | 1.04 | 1.01 | 0.89 | |
| NPL ratio | 3.8 | 3.9 | 4.6 | |
| NPL coverage ratio | 77 | 73 | 65 | |
| Capital adequacy ratios (%) | ||||
| CET1 fully-loaded | 11.74 | 11.34 | 11.08 | |
| CET1 phased-in (3) | 11.98 | 11.58 | 11.71 | |
| Total ratio phased-in (3) | 15.92 | 15.71 | 15.51 | |
| Other information | ||||
| Number of clients (millions) | 78.1 | 4.4 | 74.8 | 72.8 |
| Number of shareholders | 874,148 | (3.2) | 902,708 | 891,453 |
| Number of employees | 126,973 | 1.1 | 125,627 | 131,856 |
| Number of branches | 7,744 | (2.8) | 7,963 | 8,271 |
| Number of ATMs | 32,658 | 0.5 | 32,502 | 32,327 |
General note: as a result of the amendment to IAS 12 “Income Taxes”, and in order to make the information comparable, the 2018 and 2017 income statements have been restated.
(1) Excluding the goodwill impairment in the United States in 2019, BBVA Chile in 2018 and Telefónica impairment in 2017.
(2) Adjusted by additional Tier 1 instrument remuneration.
(3) Phased-in ratios include the temporary treatment on the impact of IFRS 9, calculated in accordance with Article 473 bis of the Capital Requirements Regulation (CRR).
Financial performance in 2019
Robust core revenues growth
Net interest income
(At constant exchange rates)
+4.3%
vs. 2018
Fees
(At constant exchange rates)
+3.6%
vs. 2018
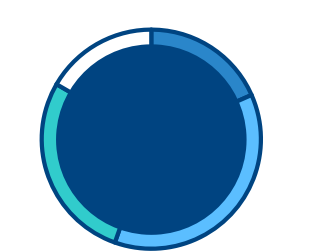
Further improvement in best-in-class efficiency
Efficiency ratio
(At constant exchange rates)
48.5%
-92
basis points
vs. 2018
Sound risk indicators
NPL ratio
3.8%
-15 basis points
vs. Dec 2018
NPL coverage ratio
77%
+349 basis points
vs. Dec 2018
Cost of risk
1.04%
+3 basis points
vs. 2018
Strong capital position
CET1 fully-loaded
11.74%
+40 basis points
vs. Dec 2018
Leading profitability metrics
ROTE
11.9%
ROE
9.9%
Focus on shareholder value creation
TANGIBLE BOOK VALUE + DIVIDENDS
(€ per share)
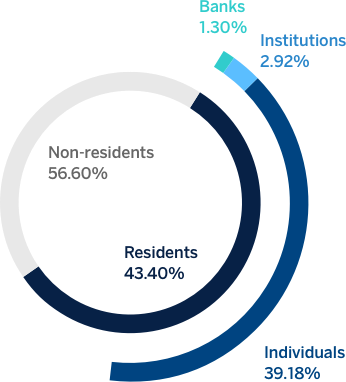
SHAREHOLDER BREAKDOWN
(31/12/2019)
Shareholders
874,148
CLEAR, SUSTAINABLE AND PREDICTABLE DIVIDEND POLICY

Cash 1
26
€ cents/share
(gross)
(1) €10 cents / share paid in October 2019 plus €16 cents / share as final dividend for the year 2019 which, if approved, would be paid on April 9, 2020.

Dividend yield 2
5.2%
(2) Calculated with the share closing price as of December 31, 2019.
Consolidated Income Statement. BBVA Group
Millions of euros
| 2019 | ∆% | ∆% at constant exchange rates |
2018 | |
|---|---|---|---|---|
| Net interest income | 18,202 | 3.5 | 4.3 | 17,591 |
| Net fees and commissions | 5,033 | 3.2 | 3.6 | 4,879 |
| Net trading income | 1.383 | 13.1 | 15.4 | 1.223 |
| Other operating income & expenses | (77) | n.s. | n.s. | 54 |
| Gross income | 24,542 | 3.3 | 4.2 | 23,747 |
| Operating expenses | (11,902) | 1.7 | 2.2 | (11,702) |
| Operating income | 12,639 | 4.9 | 6.1 | 12,045 |
| Impairment on financial assets | (4,151) | 4.3 | 6.0 | (3,981) |
| Provisions and other gains (losses) | (2,090) | n.s. | n.s. | 383 |
| Profit /(loss) before tax | 6,398 | (24.2) | (23.8) | 8,446 |
| Income tax (1) | (2,053) | (7.5) | (7.4) | (2,219) |
| Profit /(loss) for the year (1) | 4,345 | (30.2) | (29.7) | 6,227 |
| Non-controlling interests | (833) | 0.8 | 11.6 | (827) |
| Net attributable profit (1) | 3,512 | (35.0) | (35.3) | 5,400 |
| Of which: | ||||
| Goodwill impairment in the United States | (1,318) | |||
| BBVA Chile (2) | 697 | |||
| Net attributable profit excluding the goodwill impairment in the United States and BBVA Chile | 4,830 | 2.7 | 2.0 | 4,703 |
(1) As a result of the amendment to IAS 12 “Income Taxes”, and in order to make the information comparable, the 2018 income statement has been restated.
(2) Earnings generated by BBVA Chile until its sale on July 6, 2018 and the capital gains from the operation.
Business areas
For more information, please click on each area
Banking (3)
Spain
€5,734M
-3.9%
Millions of euros. Year-on-year changes.
Highlights
- Growth in consumer, retail and commercial portfolios.
- Net interest income influenced by the impact of IFRS 16 “Leases”.
- Continued decrease in operating expenses.
- Positive impact of the sale of non-performing and write-off portfolios on loan loss provisions and risk indicators.
Results
Net interest income
3,645Gross income
5,734Operating income
2,480Net attributable profit
1,386ACTIVITY (1)(2)
Performing loans under management
-1.4%Total customer funds under management
+1.2%
(1) Variación interanual, saldos puntuales a 31-12-2019.
(2) Préstamos y anticipos a la clientela no dudosos en gestión excluye las adquisiciones temporales de activos. Total recursos en gestión se compone de la suma de los depósitos de clientes en gestión sin cesiones temporales de activos más los fondos de inversión, fondos de pensiones y otros recursos fuera de balance
RISKS
NPL coverage ratio
NPL ratio
Cost of risk
The United States
€3,223M
+2.3%
Millions of euros. Year-on-year changes at constant exchange rate.
Highlights
- Activity impacted by Fed´s interest-rate cuts.
- Good performance of net fees and commissions and net trading income.
- Continued improvement of the efficiency ratio.
- Net attributable profit affected by the impairment on financial assets.
Results
Net interest income
2,395Gross income
3,223Operating income
1,257Net attributable profit
590ACTIVITY (1)(2)
Performing loans under management
+2.1%Total customer funds under management
+3.7%
(1) Variación interanual a tipo de cambio constante, saldos puntuales a 31-12-2019
(2) Préstamos y anticipos a la clientela no dudosos en gestión excluye las adquisiciones temporales de activos. Total recursos en gestión se compone de la suma de los depósitos de clientes en gestión sin cesiones temporales de activos más los fondos de inversión, fondos de pensiones y otros recursos fuera de balance.
RISKS
NPL coverage ratio
NPL ratio
Cost of risk
Mexico
€8,029M
+6.0%
Millions of euros. Year-on-year changes at constant exchange rate.
Highlights
- Good performance of the lending activity, boosted by growth in the retail portfolio.
- Positive trend of customer funds especially in demand deposits.
- Net interest income growth in line with activity.
- Excellent performance of the net trading income.
- Cumulative cost of risk at historically low levels.
Results
Net interest income
6,209Gross income
8,029Operating income
5,384Net attributable profit
2,699ACTIVITY (1)(2)
Performing loans under management
+7.6%Total customer funds under management
+7.0%
(1) Variación interanual a tipo de cambio constante, saldos puntuales a 31-12-2019
(2) Préstamos y anticipos a la clientela no dudosos en gestión excluye las adquisiciones temporales de activos. Total recursos en gestión se compone de la suma de los depósitos de clientes en gestión sin cesiones temporales de activos más los fondos de inversión, fondos de pensiones y otros recursos fuera de balance.
RISKS
NPL coverage ratio
NPL ratio
Cost of risk
Turkey
€3,590M
+2.6%
Year-on-year changes at constant exchange rate.
Highlights
- In Turkish lira, positive activity performance and relevant improvement in the spread.
- Operating expenses growth below the inflation rate.
- Positive evolution of net fees and commissions and lower requirements for loan-loss provisions on financial assets.
Results
Net interest income
2,814Gross income
3,590Operating income
2,375Net attributable profit
506ACTIVITY (1)(2)
Performing loans under management
+6.7%Total customer funds under management
+16.6%
(1) Variación interanual a tipo de cambio constante, saldos puntuales a 31-12-2019
(2) Préstamos y anticipos a la clientela no dudosos en gestión excluye las adquisiciones temporales de activos. Total recursos en gestión se compone de la suma de los depósitos de clientes en gestión sin cesiones temporales de activos más los fondos de inversión, fondos de pensiones y otros recursos fuera de balance.
RISKS
NPL coverage ratio
NPL ratio
Cost of risk
South America
€3,850M*
+14.3%
Millions of euros. Year-on-year changes at constant exchange rates.
Highlights
- Positive evolution of activity in the main countries: Argentina, Colombia and Peru.
- Improved efficiency ratio, supported by the growth in net interest income and the control in operating expenses.
- Greater net trading income contribution in the year due to the positive effect derived from the positive contribution of foreign exchange transactions and Prisma sale in Argentina.
- Net attributable profit negatively impacted by Argentina´s inflation adjustment.
Results
Net interest income
3,196Gross income
3,850Operating income
2,276Net attributable profit
721ACTIVITY (1)(2)
Performing loans under management
+7.0%Total customer funds under management
+7.2%
(1) Variación interanual a tipo de cambio constante, saldos puntuales a 31-12-2019
(2) Préstamos y anticipos a la clientela no dudosos en gestión excluye las adquisiciones temporales de activos. Total recursos en gestión se compone de la suma de los depósitos de clientes en gestión sin cesiones temporales de activos más los fondos de inversión, fondos de pensiones y otros recursos fuera de balance.
RISKS
NPL coverage ratio
NPL ratio
Cost of risk
Argentina, Colombia and Peru
Net attributable profit breakdown.
Millions of euros
* Rest includes Venezuela, Paraguay, Uruguay, Bolivia and Forum (Chile).
Argentina
Positive contribution to the area’s result thanks to excellent revenues’ performance.
Colombia
Remarkable year-on-year growth of the net attributable profit, boosted by activity, efficiency improvement and lower impairments on financial assets.
Peru
Net attributable profit growth favoured by revenues and offset by higher impairments on financial assets.
Rest of Eurasia
€454M
+9.6%
Millions of euros. Year-on-year changes.
Highlights
- Good performance in lending, especially in Asia.
- Flattish recurring revenue and positive performance of the net trading income.
- Controlled growth of operating expenses.
- Improved risk indicators.
Results
Net interest income
175Gross income
454Operating income
161Net attributable profit
127ACTIVITY (1)(2)
Performing loans under management
+18.7%Total customer funds under management
-1.1%
(1) Variación interanual a tipos de cambio constantes, saldos puntuales a 31-12-2019
(2) Préstamos y anticipos a la clientela no dudosos en gestión excluye las adquisiciones temporales de activos. Total recursos en gestión se compone de la suma de los depósitos de clientes en gestión sin cesiones temporales de activos más los fondos de inversión, fondos de pensiones y otros recursos fuera de balance.
RISKS
NPL coverage ratio
NPL ratio
Cost of risk
Corporate & Investment Banking
€454M
+9.6%
Millions of euros. Year-on-year changes at constant exchange rates.
Highlights
- Good performance of activity with customers.
- Leadership position in green and sustainable loans.
- Positive evolution of net interest income, linked to the activity.
- Net attributable profit positively impacted by good performance in the fourth quarter.
Results
Gross income
3,055Operating income
1,988Net attributable profit
1,031ACTIVITY (1)
Performing loans under management
+11.9%Total customer funds under management
-1.7%CLIENT´S REVENUE
€ Mill, Year-on-year changes at constant exchange rates
2,894Wholesale banking
recurrent business (2)
95%
(1) Gross income. Year-on-year changes.
(2) Gross income. Year-on-year changes at constant exchange rate.
(3) Gross income. Year-on-year changes at constant exchange rates