Outstanding results in a challenging environment
Solid operating income growth (up 11.7% at constant exchange rates) and a very strong cost control
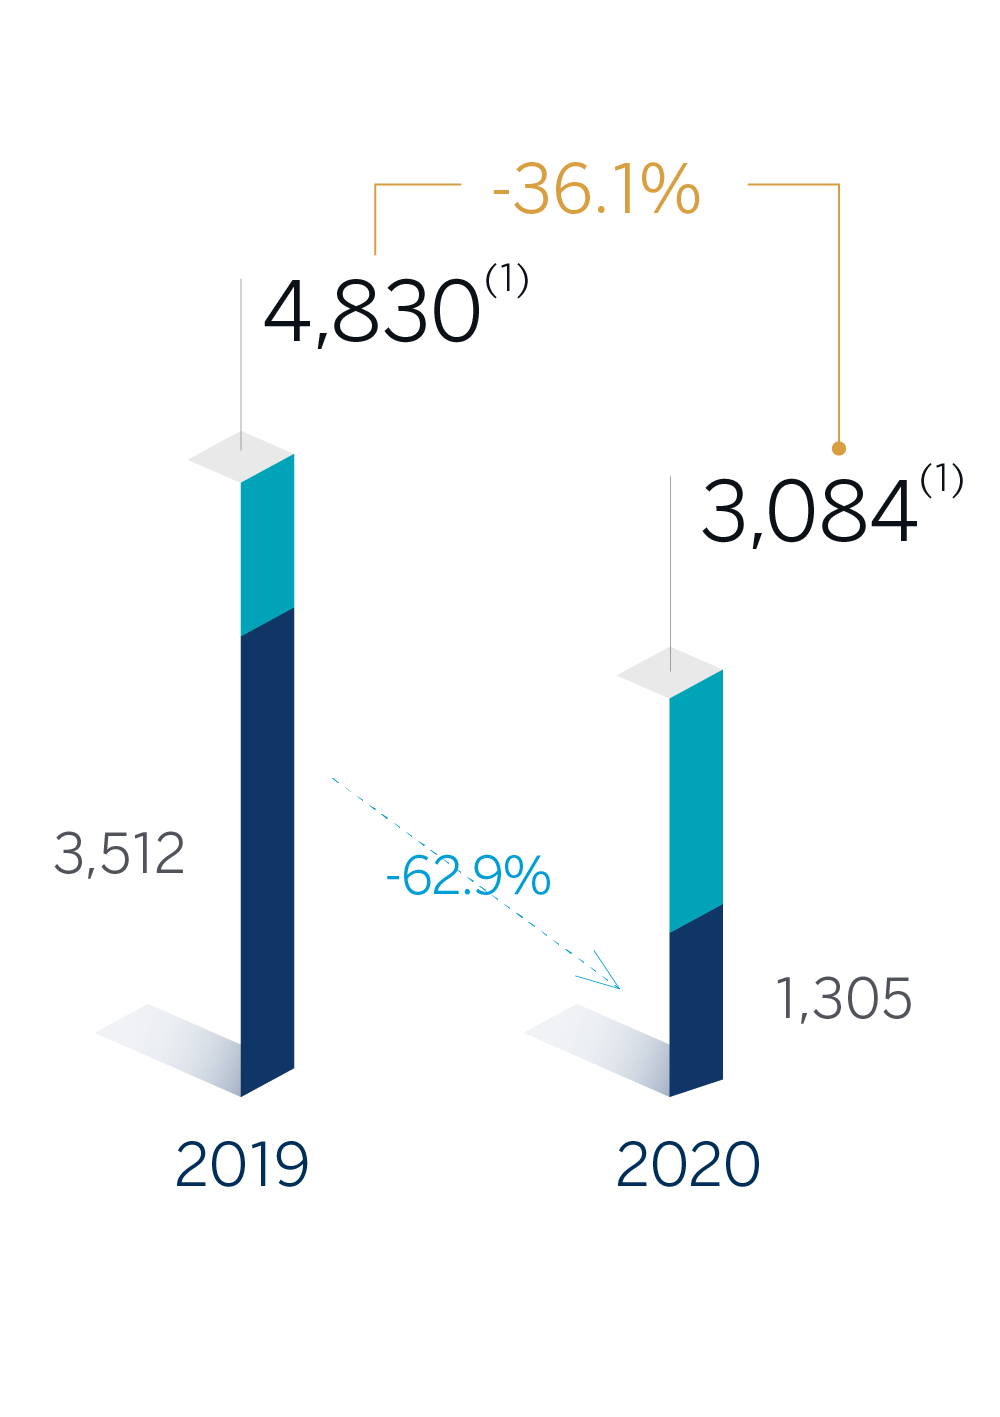
NET ATTRIBUTABLE PROFIT
(€ MILL)
EFFICIENCY RATIO
(At constant exchange rates)

(1) Excluding the goodwill impairment in the United States, registered in 2019 and 2020 and the net capital gain from the bancassurance operation with Allianz in 2020.
Focus on shareholder value creation
Sale of BBVA USA: LARGE SIZE TRANSACTION AT A VERY ATTRACTIVE PRICE
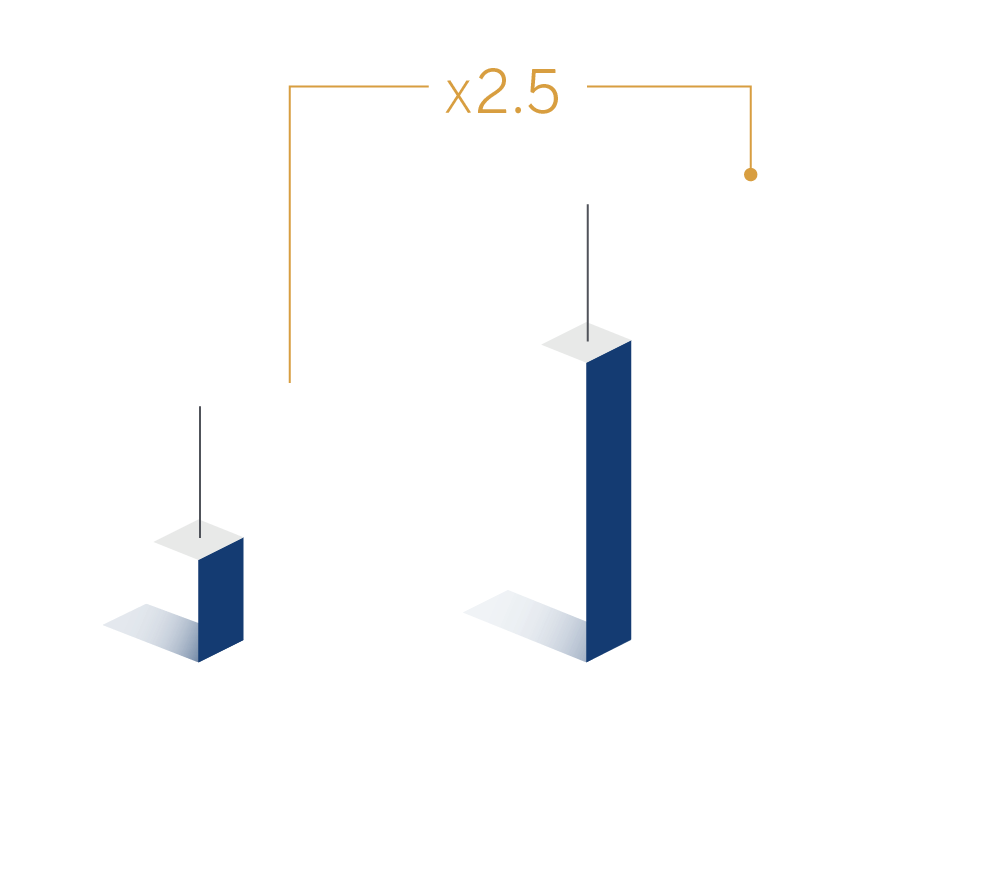
(1) Exchange rate €/USD 1.20.

BBVA USA sale will generate €8.5Bn in capital (2)
EXTRAORDINARY DISTRIBUTIONS

Targeting a buyback of around 10% of the ordinary shares, after the closing of BBVA USA transaction (3)
(2) CET1 fully-loaded generation based on post-deal figures.
(3) Any potential repurchase of shares would, at the earliest, take place after the expected close of the BBVA USA transaction in mid 2021, and the ECB recommendation on distribution to shareholders has been lifted.. Any decision on a repurchase of ordinary shares would (i) require certain shareholders resolutions and supervisors approval and the lifting on the ECB recommendation on distributions to shareholders, and (ii) take into consideration share prices, among other factors.

2020 DIVIDEND (4)
5.9
€ cents/ share
(gross) in cash
(4) Maximum allowed according to the ECB recommendation, subject to shareholders approval. If approved, it would be paid in April 2021.

INTENTION TO RECOVER THE DIVIDEND POLICY (5): CLEAR, SUSTAINABLE AND PREDICTABLE
35-40% pay-out
100% in cash
Payments in October 2021 and in April 2022
(5) Once the restrictions are lifted (expected in September 2021) and subject to the approval of shareholders and supervisors.
BBVA Group main data
| Consolidated Figures | 31-12-20 | ∆% | 31-12-19 | 31-12-18 |
|---|---|---|---|---|
| Balance sheet (millions of euros) | ||||
| Total assets | 736,176 | 5.5 | 697,737 | 675,675 |
| Loans and advances to customers (gross) | 378,139 | (4.5) | 396,012 | 386,225 |
| Deposits from customers | 409,122 | 6.1 | 385,686 | 375,970 |
| Total customer funds | 512,068 | 3.8 | 493,488 | 474,085 |
| Total equity | 50,020 | (8.9) | 54,925 | 52,874 |
| Income statement (millions of euros) | ||||
| Net interest income | 16,801 | (7.3) | 18,124 | 17,511 |
| Gross income | 22,974 | (6.1) | 24,463 | 23,667 |
| Operating income | 12,219 | (2.7) | 12,561 | 11,965 |
| Net attributable profit or (loss) (1) | 3,084 | (36.1) | 4,830 | 4,703 |
| The BBVA share and share performance ratios | ||||
| Number of shares (millions) | 6,668 | - | 6,668 | 6,668 |
| Share price (euros) | 4.04 | (19.0) | 4.98 | 4.64 |
| Earning per share (euros) (1)(2) | 0.41 | (38.9) | 0.66 | 0.64 |
| Book value per share (euros) | 6.70 | (8.5) | 7.32 | 7.12 |
| Tangible book value per share (euros) | 6.05 | (3.6) | 6.27 | 5.86 |
| Market capitalization (millions of euros) | 26,905 | (19.0) | 33,226 | 30,909 |
| Yield (dividend/price; %) (3) | 4.0 | 5.2 | 5.4 | |
| Significant ratios (%) | ||||
| ROE (net attributable profit or (loss)/average shareholders' funds +/- average accumulated other comprehensive income) (1) | 6.9 | 9.9 | 10.2 | |
| ROTE (net attributable profit or (loss)/average shareholders' funds excluding average intangible assets +/- average accumulated other comprehensive income) ( (1) | 7.8 | 11.9 | 12.5 | |
| ROA (Profit or (loss) for the year/average total assets) (1) | 0.53 | 0.82 | 0.81 | |
| RORWA (Profit or (loss) for the year/average risk-weighted assets - RWA) (1) | 1.07 | 1.57 | 1.56 | |
| Efficiency ratio | 46.8 | 48.7 | 49.4 | |
| Cost of risk | 1.51 | 1.02 | 0.99 | |
| NPL ratio | 4.0 | 3.8 | 3.9 | |
| NPL coverage ratio | 81 | 77 | 73 | |
| Capital adequacy ratios (%) | ||||
| CET1 fully-loaded | 11.73 | 11.74 | 11.34 | |
| CET1 phased-in (4) | 12.15 | 11.98 | 11.58 | |
| Total ratio phased-in (4) | 16.46 | 15.92 | 15.71 | |
| Other information | ||||
| Number of clients (millions) | 80.7 | 3.6 | 77.9 | 74.6 |
| Number of shareholders | 879,226 | 0.6 | 874,148 | 902,708 |
| Number of employees | 123,174 | (3.0) | 126,973 | 125,627 |
| Number of branches | 7,432 | (4.0) | 7,744 | 7,963 |
| Number of ATMs | 31,000 | (5.1) | 32,658 | 32,502 |
General note: as a result of the interpretation issued by the International Financial Reporting Standards Interpretations Committee (IFRIC) regarding the collecting of interests of written-off financial assets for the purpose of IFRS 9, those collections are presented as reduction of the credit allowances and not as a higher interest income, recognition method applied until December 2019. Therefore, and in order to make the information comparable, the information of the 2019 and 2018 income statements has been restated.
(1) Excluding the net capital gain from the bancassurance transaction in 2020 and BBVA Chile in 2018 and the goodwill impairments in the United States registered in 2020 and 2019.
(2) Adjusted by additional Tier 1 instrument remuneration.
(3) Calculated by dividing shareholder remuneration over the last twelve months by the closing price of the period.
(4) Phased-in ratios include the temporary treatment on the impact of IFRS 9, calculated in accordance with Article 473 bis amendments of the Capital Requirements Regulation (CRR), introduced by the Regulation (EU) 2020/873.
Financial performance in 2020
Robust operating income growth
Operating income
+11.7%
vs. 2019
(At constant exchange rates)
Further improvement in best-in-class efficiency
EFFICIENCY RATIO
46.8%
342 basis points improvement
vs. 2019
(At constant exchange rates)
Risk indicators impacted by COVID-19
NPL RATIO
4.0%
+17 basis points
vs. 2019
NPL COVERAGE RATIO
81%
+488 basis points
vs. 2019
COST OF RISK
1.51%
+49 basis points
vs. 2019
Strong capital position
CET1 fully-loaded (1)
14.58%
(1) Pro-forma: including the positive impact from the sale of BBVA USA.
Leading profitability metrics
ROTE (2)
7.8%
ROE (2)
6.9%
(2) Excluding the goodwill impairment in the United States and the net capital gain from the bancassurance operation with Allianz.
| Consolidated Income Statement. BBVA Group (Millions of euros) | 2020 | ∆% | ∆% at constant exchange rates |
2019 |
|---|---|---|---|---|
| Net interest income | 16,801 | (7.3) | 3.6 | 18,124 |
| Net fees and commissions | 4,616 | (8.3) | (0.4) | 5,033 |
| Net trading income | 1,692 | 22.3 | 37.6 | 1,383 |
| Other operating income & expenses | (135) | 76.2 | 46.3 | (77) |
| Gross income | 22,974 | (6.1) | 4.5 | 24,463 |
| Operating expenses | (10,755) | (9.6) | (2.6) | (11,902) |
| Operating income | 12,219 | (2.7) | 11.7 | 12,561 |
| Impairment on financial assets | (5,908) | 45.1 | 67.3 | (4,073) |
| Provisions or reversal of provisions and other gains / (losses) | (1,085) | 40.6 | 51.4 | (772) |
| Profit /(loss) before tax | 5,225 | (32.3) | (21.9) | 7,716 |
| Income tax | (1,385) | (32.5) | (22.4) | (2,053) |
| Profit/(loss) after tax | 3,840 | (32.2) | (21.7) | 5,663 |
| Goodwill impairment in the United States and corporate operations (1) | (1,780) | 35.0 | 35.0 | (1,318) |
| Profit/(loss) for the year | 2,060 | (52.6) | (42.6) | 4,345 |
| Non-controlling interests | (756) | (9.3) | 13.0 | (833) |
| Net attributable profit/(loss) | 1,305 | (62.9) | (55.3) | 3,512 |
| Net attributable profit/(loss) excluding the goodwill impairment in the United States and corporate operations (1) | 3,084 | (36.1) | (27.2) | 4,830 |
General note: as a result of the interpretation issued by the International Financial Reporting Standards Interpretations Committee (IFRIC) regarding the collecting of interests of written-off financial assets for the purpose of IFRS 9, those collections are presented as reduction of the credit allowances and not as a higher interest income, recognition method applied until December 2019. Therefore, and in order to make the information comparable, the information of the 2019 income statements has been restated.
(1) Include the net capital gain from the sale to Allianz the half plus one share of the company created to jointly develop the non-life insurance business in Spain, excluding the health insurance line.
Business areas
GEOGRAPHIC DIVERSIFICATION
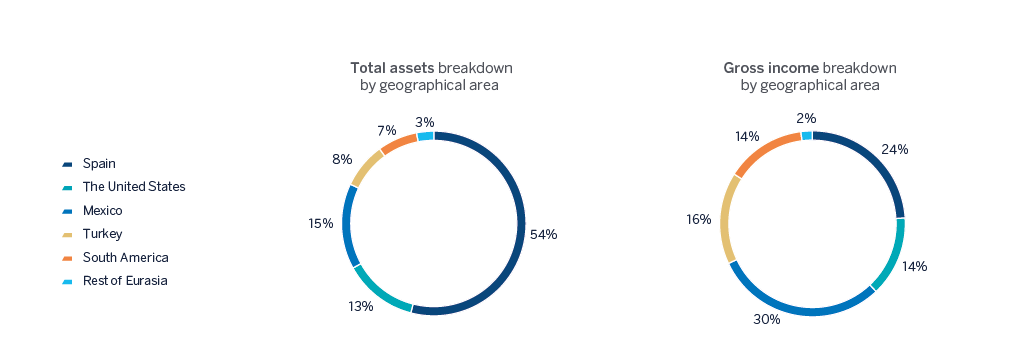
General note: excluding the Corporate Center.
For more information, please click on each area
Banking (3)
Spain
€5,554M
-1.8%
Millions of euros. Year-on-year changes.
Highlights
- Activity growth driven by corporate and investment banking operations and government support programs.
- Risk indicators contained.
- Improved efficiency ratio, driven by controlled operating expenses.
- Net attributable profit affected by the level of impairment on financial assets.
Results
Net interest income
3,553Gross income
5,554Operating income
2,515Net attributable profit
606ACTIVITY (1)
Year on year changes. Balances as of 31-12-2020
Performing loans and advances to customers under management
+0.8%Customers funds under management
+8.1%
(1) Performing loans under management excluding repos. Total customer funds under management are made up of the sum of customer deposits under amanagement excluding repos plus mutual funds, pension funds and other off balance-sheet funds.
RISKS
NPL coverage ratio
NPL ratio
Cost of risk
The United States
€3,152M
-0.0%
Millions of euros. Year-on-year changes at constant exchange rate.
Highlights
- Agreement with PNC for the sale of BBVA USA and other companies of BBVA Group with activities related to this banking business in the country.
- Flat lending activity and strong increase in customer deposits in the year.
- Positive evolution of fees and commissions and net trading income.
- Net attributable profit impacted by the Fed rate reduction and the significant increase in the impairment on financial assets line.
Results
Net interest income
2,284Gross income
3,152Operating income
1,281Net attributable profit
429ACTIVITY (1)
Year on year changes at constant exchange rate. Balances as of 31-12-2020
Performing loans and advances to customers under management
-0.0%Customers funds under management
+13.1%
(1) Performing loans under management excluding repos. Total customer funds under management are made up of the sum of customer deposits under amanagement excluding repos plus mutual funds, pension funds and other off balance-sheet funds.
RISKS
NPL coverage ratio
NPL ratio
Cost of risk
Mexico
€7,017M
-0.5%
Millions of euros. Year-on-year changes at constant exchange rate.
Highlights
- Slight deceleration of activity, impacted by the macroeconomic environment.
- Solid liquidity position.
- Controlled expenses and strength of the gross income.
- Net attributable profit affected by the significant increase in the impairment on financial assets line.
Results
Net interest income
5,415Gross income
7,017Operating income
4,677Net attributable profit
1,759ACTIVITY (1)
Year on year changes at constant exchange rate. Balances as of 31-12-2020
Performing loans and advances to customers under management
-1.0%Customers funds under management
+10.0%
(1) Performing loans under management excluding repos. Total customer funds under management are made up of the sum of customer deposits under amanagement excluding repos plus mutual funds, pension funds and other off balance-sheet funds.
RISKS
NPL coverage ratio
NPL ratio
Cost of risk
Turkey
€3,573M
+26.0%
Year-on-year changes at constant exchange rate.
Highlights
- Significant credit growth driven by Turkish lira loans. Strong growth in foreign currency demand deposits.
- Reduction in the NPL ratio year-to date.
- Outstanding performance of the net interest income and fees and commissions and efficiency ratio improvement.
- Double digit growth in the main income statement margins.
Results
Net interest income
2,783Gross income
3,573Operating income
2,544Net attributable profit
563ACTIVITY (1)
Year on year changes at constant exchange rate. Balances as of 31-12-2020
Performing loans and advances to customers under management
+25.9%Customers funds under management
+28.9%
(1) Performing loans under management excluding repos. Total customer funds under management are made up of the sum of customer deposits under amanagement excluding repos plus mutual funds, pension funds and other off balance-sheet funds.
RISKS
NPL coverage ratio
NPL ratio
Cost of risk
South America
€3,225M*
+1.7%
Millions of euros. Year-on-year changes at constant exchange rates.
Highlights
- Argentina: good perfomance of the net interest income and fees and commissions.
- Colombia: strong operating income due to higher income generation from the net interest income and net trading income. Controlled expenses growing under the inflation.
- Peru: net interest income impacted by the drop in official rates and customer support measures.
Results
Net interest income
2,701Gross income
3,225Operating income
1,853Net attributable profit
446ACTIVITY (1)
Year on year changes at constant exchange rates. Balances as of 31-12-2020
Performing loans and advances to customers under management
+12.6%Customers funds under management
+22.5%
(1) Performing loans under management excluding repos. Total customer funds under management are made up of the sum of customer deposits under amanagement excluding repos plus mutual funds, pension funds and other off balance-sheet funds.
RISKS
NPL coverage ratio
NPL ratio
Cost of risk
Rest of Eurasia
€510M
+12.3%
Millions of euros. Year-on-year changes.
Highlights
- Activity affected by the loans amortizations made during the second half of the year.
- Contained risk indicators.
- Increased net interest income, fees & commissions and net trading income.
- Reduction of operating expenses.
Results
Net interest income
214Gross income
510Operating income
225Net attributable profit
137ACTIVITY (1)
Year on year changes. Balances as of 31-12-2020
Performing loans and advances to customers under management
-3.8%Customers funds under management
-1.2%
(1) Performing loans under management excluding repos. Total customer funds under management are made up of the sum of customer deposits under amanagement excluding repos plus mutual funds, pension funds and other off balance-sheet funds.
RISKS
NPL coverage ratio
NPL ratio
Cost of risk
Corporate & Investment Banking
€3,135M
+15.1%
Millions of euros. Year-on-year changes at constant exchange rates.
Highlights
- Good performance of customer activity, which is reflected in net interest income and fees and commissions.
- Good evolution of net trading income.
- Leadership position in green and sustainable loans.
- Net attributable profit affected by the significant increase in the impairment on financial assets line.
Results
Gross income
3,135Operating income
2,143Net attributable profit
877ACTIVITY (1)
Year on year changes at constant exchange rates. Balances as of 31-12-2020
Performing loans and advances to customers under management
+1.6%Customers funds under management
+31.5%
(1) Performing loans under management excluding repos. Total customer funds under management are made up of the sum of customer deposits under amanagement excluding repos plus mutual funds, pension funds and other off balance-sheet funds.
CLIENT´S REVENUE
€ Mill. Year-on-year changes at constant exchange rates
2,950Wholesale banking
recurrent business (2)
94%
(2) Client´s revenue / Gross income.
(1) Gross income. Year-on-year changes.
(2) Gross income. Year-on-year changes at constant exchange rate.
(3) Gross income. Year-on-year changes at constant exchange rates.