
- Loading...
Introduction, basis for the presentation of the Consolidated Financial Statements, Internal Control over Financial Reporting and other information
1.1 Introduction
Banco Bilbao Vizcaya Argentaria, S.A. (hereinafter “the Bank”, “BBVA" or “BBVA, S.A.”) is a private-law entity subject to the laws and regulations governing banking entities operating in Spain. It carries out its activity through branches and agencies across the country and abroad.
The Bylaws and other public information are available for inspection at the Bank’s registered address (Plaza San Nicolás, 4 Bilbao) as noted on its web site (www.bbva.com).
In addition to the activities it carries out directly, the Bank heads a group of subsidiaries, joint ventures and associates which perform a wide range of activities and which together with the Bank constitute the Banco Bilbao Vizcaya Argentaria Group (hereinafter, the “Group” or the “BBVA Group”). In addition to its own separate financial statements, the Bank is required to prepare Consolidated Financial Statements comprising all consolidated subsidiaries of the Group.
As of December 31, 2021, the BBVA Group had 205 consolidated entities and 45 entities accounted for using the equity method (see Notes 3 and 16 and Appendix I to V).
The Consolidated Financial Statements of the BBVA Group for the year ended December 31, 2020 were approved by the shareholders at the Annual General Meeting (“AGM”) held on April 20, 2021.
BBVA Group’s Consolidated Financial Statements and the Financial Statements for the Bank and the majority of the remaining entities within the Group have been prepared for the year ended December 31, 2021, and are pending approval by their respective AGMs. However, the Board of Directors of the Bank believes that said financial statements will be approved without changes.
1.2 Basis for the presentation of the Consolidated Financial Statements
The BBVA Group’s Consolidated Financial Statements are presented in compliance with IFRS-IASB (International Financial Reporting Standards as issued by the International Accounting Standards Board), as well as in accordance with the International Financial Reporting Standards endorsed by the European Union (hereinafter, “EU-IFRS”) applicable as of December 31, 2021, considering the Bank of Spain Circular 4/2017, and with any other legislation governing financial reporting which is applicable and with the format and mark-up requirements established in the EU Delegated Regulation 2019/815 of the European Commission.
The BBVA Group’s accompanying Consolidated Financial Statements for the year ended December 31, 2021 were prepared by the Group’s Directors (through the Board of Directors meeting held on February 9, 2022) by applying the principles of consolidation, accounting policies and valuation criteria described in Note 2, so that they present fairly the Group’s total consolidated equity and financial position as of December 31, 2021, together with the consolidated results of its operations and cash flows generated during the year ended December 31, 2021.
These Consolidated Financial Statements were prepared on the basis of the accounting records kept by the Bank and each of the other entities in the Group. Moreover, they include the adjustments and reclassifications required to harmonize the accounting policies and valuation criteria used by the Group (see Note 2.2).
All effective accounting standards and valuation criteria with a significant effect in the Consolidated Financial Statements were applied in their preparation.
The amounts reflected in the accompanying Consolidated Financial Statements are presented in millions of euros, unless it is more appropriate to use smaller units. Some items that appear without a balance in these Consolidated Financial Statements are due to how the units are expressed. Also, in presenting amounts in millions of euros, the accounting balances have been rounded up or down. It is therefore possible that the totals appearing in some tables are not the exact arithmetical sum of their component figures.
The percentage changes in amounts have been calculated using figures expressed in thousands of euros.
1.3 Comparative information
The information included in the accompanying consolidated financial statements for the years ended December 31, 2020 and 2019, is presented in accordance with the applicable regulation, for the purpose of comparison with the information for the year ended December 31, 2021.
Sale of BBVA’s U.S. subsidiary
As mentioned in Note 3, in 2020, BBVA reached an agreement to sell its entire stake in BBVA USA Bancshares, Inc., which in turn owned all the capital stock of the bank BBVA USA, as well as other companies of the BBVA Group in the United States with activities related to this banking business. On June 1, 2021 and once the mandatory authorizations had been obtained, BBVA completed this sale (the USA Sale).
As required by IFRS 5 "Non-current assets held for sale and discontinued operations", the balances of assets and liabilities corresponding to such companies for sale were reclassified from their corresponding accounting headings to the headings "Non-current assets and disposal groups classified as held for sale” and “Liabilities included in disposal groups classified as held for sale” respectively, in the consolidated balance sheet as of December 31, 2020. Similarly, as required by the aforementioned IFRS 5, the results generated by these companies for the first five months of 2021 and for 2020 are presented in the heading “Profit (loss) after tax from discontinued operations” of the consolidated income statement for such period, and in the heading "Non-current assets and disposal groups classified as held for sale" of the consolidated statements of recognized income and expense for 2021 and 2020, respectively. Additionally, the results corresponding to the year ended December 31, 2019 were reclassified, to facilitate the comparison between periods, to those same headings of the consolidated income statement and consolidated statement of recognized income and expense for that year. Finally, the total consideration received in cash for the USA Sale has been recorded under the heading of “Divestments - Non-current assets classified as held for sale and associated liabilities” of the consolidated statements of cash flows for the year ended December 31, 2021.
Note 21 shows a breakdown of the financial information of the companies sold in the United States for the dates and periods indicated.
(Reverse) Repurchase Agreements Recognition
Beginning in 2021, certain repurchase agreements and reverse repurchase agreements began to be presented on a net basis in the consolidated balance sheet. In order to make the information as of December 31, 2020 and 2019 comparable with the information as of December 31, 2021, the information as of December 31, 2020 and 2019 was adjusted by reducing Total assets and Total liabilities by €2,379 and €2,266 million in 2020 and 2019, respectively.
1.4 Seasonal nature of income and expense
The nature of the most significant activities carried out by the BBVA Group’s entities is mainly related to typical activities carried out by financial institutions, and are not significantly affected by seasonal factors within the same year.
1.5 Management and impacts of the COVID-19 pandemic
In 2020, the COVID-19 pandemic had adverse effects on the Group's results and capital base. During 2021, the pandemic has continued to evolve with gradual improvements in the global economic conditions, mainly due to the vaccination progress against the coronavirus and the significant economic stimuli adopted by authorities, which have supported the improvement in the 2021 results of the Group. However, there are still uncertainties about the future final impact of the COVID-19 pandemic, mainly in consideration of the increasing number of infections caused by new variants of the coronavirus. The Group continuously monitors these changes and their impacts on the business.
The main impacts of COVID-19 pandemic in the BBVA Group's Consolidated Financial Statements are detailed in the following Notes:
- Note 1.6 includes information on the consideration of the COVID-19 pandemic in the estimates made.
- Note 7.1 details the main risks associated with the pandemic as well as information on its evolution and its impact in the macroeconomic forecasts.
- Note 7.2 includes information related to the initiatives carried out by the Group to help the most affected clients, jointly with the corresponding government measures. Likewise, it contains, among others, information regarding the level of activity and the amount corresponding to moratorium measures, both public and private, granted by the Group worldwide. Additionally, the measures applied to the treatment of forward looking information used in the calculation of expected losses are detailed.
- Note 7.5 presents information regarding the impact on liquidity and funding risk.
- Note 18.1 includes information concerning the impairment of the goodwill in the United States recorded during the first quarter of 2020, mainly due to the impact of COVID-19 in updating the macroeconomic scenario and the expected evolution of interest rates.
- Note 47 includes information on the impact of the update of the macroeconomic scenario affected by the COVID-19 pandemic mainly during the year ended December 31, 2020.
1.6 Responsibility for the information and for the estimates made
The information contained in the BBVA Group’s Consolidated Financial Statements is the responsibility of the Group’s Directors.
Estimates were required to be made at times when preparing these Consolidated Financial Statements in order to calculate recorded or disclosed amount of some assets, liabilities, income, expense and commitments. These estimates relate mainly to the following:
- Loss allowances on certain financial assets (see Notes 7, 12, 13, 14 and 16).
- The assumptions used to quantify certain provisions (see Notes 23 and 24) and for the actuarial calculation of post-employment benefit liabilities and commitments (see Note 25).
- The useful life and impairment losses of tangible and intangible assets (see Notes 17, 18, and 21)
- The valuation of goodwill and price allocation of business combinations (see Note 18).
- The fair value of certain unlisted financial assets and liabilities (see Notes 7, 8, 10, 11, 12 and 13).
- The recoverability of deferred tax assets (see Note 19).
As mentioned above, in 2021, the pandemic has continued to evolve with gradual improvements in the global economic conditions, although there is still uncertainty about the final future impact (see Note 1.5). The increased uncertainty associated with the unprecedented nature of this pandemic has entailed greater complexity in developing reliable estimates and applying judgment.
Therefore, these estimates were made on the basis of the best available information on the matters analyzed, as of December 31, 2021. However, it is possible that events may take place in the future which could make it necessary to amend these estimations (upward or downward). Any such changes would be recorded prospectively, recognizing the effects of the change in estimation in the corresponding consolidated financial statements.
During 2021 there have been no significant changes in the estimates made as of December 31, 2020 and 2019, with the exception of those indicated in these Consolidated Financial Statements.
1.7 BBVA Group’s Internal Control over Financial Reporting
BBVA Group’s Consolidated Financial Statements are prepared under an Internal Control over Financial Reporting Model (ICFR). It provides reasonable assurance with respect to the reliability and the integrity of the consolidated financial statements. It is also aimed to ensure that the transactions are processed in accordance with the applicable laws and regulations.
The ICFR model is compliant with the control framework established in 2013 by the “Committee of Sponsoring Organizations of the Treadway Commission” (hereinafter, "COSO"). The COSO 2013 framework sets out five components that constitute the basis of the effectiveness and efficiency of the internal control systems:
- The establishment of an appropriate control framework.
- The assessment of the risks that could arise during the preparation of the financial information.
- The design of the necessary controls to mitigate the identified risks.
- The establishment of an appropriate system of information to detect and report system weaknesses.
- The monitoring over the controls to ensure they perform correctly and are effective over time.
The ICFR model is a dynamic model that continuously evolves over time to reflect the reality of the BBVA Group’s businesses and processes, as well as the risks and controls designed to mitigate them. It is subject to a continuous evaluation by the internal control units located in the different entities of BBVA Group.
These control units are integrated within the BBVA internal control model, defined and led by Regulation & Internal Control, and which is based in two pillars:
- A control system organized into three lines of defense that has been updated and strengthened, as described below:
- The first line of defense (1LoD) is located within the business and support units, which are responsible for identifying risks associated with their processes, as well as for implementing and executing the necessary controls to mitigate them. The Risk Control Assurer (RCA) role was created to reinforce the adequate risk management in each area’s processes.
- The second line of defense (2LoD) comprises the specialized control units for each type of risk (Risk Control Specialists - RCS- among others Finance, Legal, IT, Third Party, Compliance or Processes). This second line defines the mitigation and control frameworks for their areas of responsibility across the entire organization and performs challenge to the control model (supervises the implementation and design of the controls and assesses their effectiveness).
- The third line of defense (3LoD) is the Internal Audit unit, which conducts an independent review of the model, verifying the compliance and effectiveness of the model.
- A committee structure in the Group, called Corporate Assurance, which enables the escalation of possible weaknesses and internal control issues to the management at a Group level and also in each of the countries where the Group operates.
The Internal Control Finance (RCS Finance) units within Finance comply with a common and standard methodology established at the Group level, as set out in the following diagram:
BBVA's INTERNAL CONTROL OVER FINANCIAL REPORTING
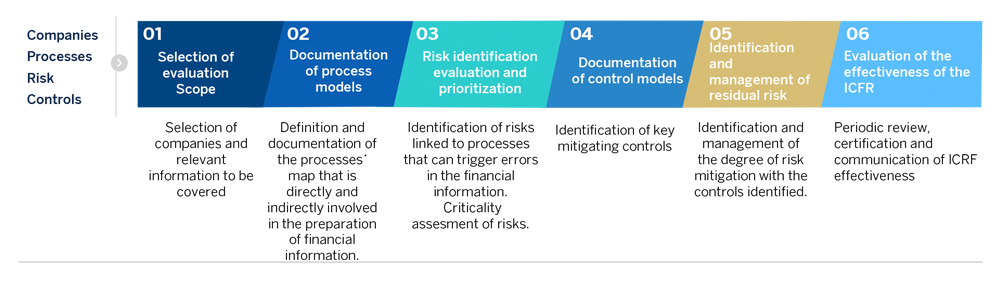
The ICFR model is subject to annual evaluations by the Group’s Internal Audit Unit. It is also supervised by the Audit Committee of the Bank’s Board of Directors.
The BBVA Group is also required to comply with the Sarbanes-Oxley Act (hereafter “SOX”) as a registered company with the U.S. Securities and Exchange Commission (“SEC”). The main senior executives of the Group are involved in the design, compliance and implementation of the internal control model to make it effective and to ensure the quality and accuracy of the financial information.
The description of the ICFR model is included in the Corporate Governance Annual Report within the Management Report attached to the consolidated financial statements for the year ended December 31, 2021.
2. Principles of consolidation, accounting policies and measurement bases applied and recent IFRS pronouncements
The Glossary includes the definition of some of the financial and economic terms used in Note 2 and subsequent Notes of the accompanying Consolidated Financial Statements.
2.1 Principles of consolidation
In terms of its consolidation, in accordance with the criteria established by IFRS, the BBVA Group is made up of four types of entities: subsidiaries, joint ventures, associates and structured entities, defined as follows:
- Subsidiaries
- Subsidiaries are entities controlled by the Group (for definition of control, see Glossary). The financial statements of the subsidiaries are fully consolidated with those of the Bank. The share of non-controlling interests from subsidiaries in the Group’s consolidated total equity is presented under the heading “Minority interests (Non-controlling interests)” in the consolidated balance sheet. Their share in the profit or loss for the period or year is presented under the heading “Attributable to minority interest (non-controlling interests)” in the accompanying consolidated income statement (see Note 31).
- Note 3 includes information related to the main subsidiaries in the Group as of December 31, 2021. Appendix I includes other significant information on all entities.
- Joint ventures
- Joint ventures are those entities for which there is a joint control arrangement with third parties other than the Group (for definitions of joint arrangement, joint control and joint venture, refer to Glossary).
- The investments in joint ventures are accounted for using the equity method (see Note 16). Appendix II shows the main figures for joint ventures accounted for using the equity method as of December 31, 2021.
- Associates
- Associates are entities in which the Group is able to exercise significant influence (for definition of significant influence, see Glossary). Significant influence is deemed to exist when the Group owns 20% or more of the voting rights of an investee directly or indirectly, unless it can be clearly demonstrated that this is not the case.
- Certain entities in which the Group owns 20% or more of the voting rights are not included as Group associates, since the Group does not have the ability to exercise significant influence over these entities. Investments in these entities, which do not represent material amounts for the Group, are classified as “Financial assets at fair value through other comprehensive income” or “Non-trading financial assets mandatorily at fair value through profit or loss”.
- In contrast, some investments in entities in which the Group holds less than 20% of the voting rights are accounted for as Group associates, as the Group is considered to have the ability to exercise significant influence over these entities. As of December 31, 2021, these entities are not significant to the Group.
- Appendix II shows the most significant information related to the associates (see Note 16), which are accounted for using the equity method.
- Structured Entities
- A structured entity is an entity that has been designed so that voting or similar rights are not the dominant factor in deciding who controls the entity, such as when the voting rights relate to administrative matters only and the relevant activities are directed by means of contractual arrangements (see Glossary).
- In those cases where the Group sets up entities or has a holding in such entities, in order to allow its customers access to certain investments, to transfer risks or for other purposes, in accordance with internal criteria and procedures and with applicable regulations, the Group determines whether control over the entity in question actually exists and therefore whether it should be subject to consolidation.
- Such methods and procedures determine whether there is control by the Group, considering how the decisions are made about the relevant activities, assessing whether the Group has control over the relevant elements, exposure to variable returns from involvement with the investee and the ability to use control over the investee to affect the amount of the investor’s returns.
- Structured entities subject to consolidation
- To determine if a structured entity is controlled by the Group, and therefore should be consolidated into the Group, the existing contractual rights (different from the voting rights) are analyzed. For this reason, an analysis of the structure and purpose of each investee is performed and, among others, the following factors will be considered:
- Evidence of the current ability to manage the relevant activities of the investee according to the specific business needs (including any decisions that may arise only in particular circumstances).
- Potential existence of a special relationship with the investee.
- Implicit or explicit Group commitments to support the investee.
- The ability to use the Group´s power over the investee to affect the amount of the Group’s returns.
- These types of entities include cases where the Group has a high exposure to variable returns and retains decision-making power over the investee, either directly or through an agent.
- The main structured entities of the Group are the asset securitization funds, to which the BBVA Group transfers loans and advances, and other vehicles, which allow the Group’s customers to gain access to certain investments or to allow for the transfer of risks or for other purposes (see Appendices I and V). The BBVA Group maintains the decision-making power over the relevant activities of these vehicles and financial support through securitized market standard contracts. The most common ones are: investment positions in equity note tranches, funding through subordinated debt, credit enhancements through derivative instruments or liquidity lines, management rights of defaulted securitized assets, “clean-up” call derivatives, and asset repurchase clauses by the grantor.
- For these reasons, the loans and receivable portfolios related to the vast majority of the securitizations carried out by the Bank or Group subsidiaries are not derecognized in the books of said entity and the issuances of the related debt securities are recorded as liabilities within the Group’s consolidated balance sheet.
- For additional information on the accounting treatment for the transfer and derecognition of financial instruments, see Note 2.2.2. “Transfers and derecognition of financial assets and liabilities”.
- Non-consolidated structured entities
- The Group owns other vehicles also for the purpose of allowing customers access to certain investments, to transfer risks, and for other purposes, but without the Group having control of the vehicles, which are not consolidated in accordance with IFRS 10 – “Consolidated Financial Statements”. The balance of assets and liabilities of these vehicles is not material in relation to the Group’s Consolidated Financial Statements.
- As of December 31, 2021, there was no material financial support from the Bank or its subsidiaries to unconsolidated structured entities.
- The Group does not consolidate any of the mutual funds it manages since the necessary control conditions are not met. Particularly, the BBVA Group does not act as arranger but as agent since it operates the mutual funds on behalf and for the benefit of investors or parties (arranger or arrangers) and, for this reason it does not control the mutual funds when exercising its authority for decision making.
- The mutual funds managed by the Group are not considered structured entities (generally, retail funds without corporate identity over which investors have participations which gives them ownership of said managed equity). These funds are not dependent on a capital structure that could prevent them from carrying out activities without additional financial support, being in any case insufficient as far as the activities themselves are concerned. Additionally, the risk of the investment is absorbed by the fund participants, and the Group is only exposed when it becomes a participant, and as such, there is no other risk for the Group.
In all cases, the operating results of equity method investees acquired by the BBVA Group in a particular period only include the period from the date of acquisition to the financial statements date. Similarly, the results of entities disposed of during any year only include the period from the start of the year to the date of disposal.
The consolidated financial statements of subsidiaries, associates and joint ventures used in the preparation of the Consolidated Financial Statements of the Group have the same presentation date as the Consolidated Financial Statements. If financial statements at those same dates are not available, the most recent will be used, as long as these are not older than three months, and adjusted to take into account the most significant transactions. As of December 31, 2021, financial statements as of December 31 of all Group entities were utilized except for the case of the consolidated financial statements of six associates deemed non-significant for which financial statements as of November 30, 2021 were used.
Separate financial statements
The separate financial statements of the parent company of the Group are prepared under Spanish regulations (Circular 4/2017 of the Bank of Spain, and following other regulatory requirements of financial information applicable to the Bank). The Bank uses the cost method to account in its separate financial statements for its investments in subsidiaries, associates and joint venture entities, which are consistent with the requirements of Bank of Spain Circular 4/2017.
Appendix IX shows BBVA’s financial statements as of and for the years ended December 31, 2021 and 2020.
2.2 Accounting principles and policies and applied valuation methods
The accounting principles and policies and the valuation methods applied in the preparation of the consolidated financial statements may differ from those used, at the individual level, by some of the entities that are part of the BBVA Group; This is why, in the consolidation process, the necessary adjustments and reclassifications are made to standardize such principles and criteria among themselves and bring them into line with the EU-IFRS.
In preparing the accompanying Consolidated Financial Statements, the following accounting principles and policies and assessment criteria have been applied:
2.2.1 Financial instruments
IFRS 9 became effective as of January 1, 2018 and replaced IAS 39 regarding the classification and measurement of financial assets and liabilities, the impairment of financial assets and hedge accounting. However, the Group has chosen to continue applying IAS 39 for accounting for hedges as permitted by IFRS 9.
Classification and measurement of financial assets
Classification of financial assets
IFRS 9 contains three main categories for financial assets classification: measured at amortized cost, measured at fair value with changes through other comprehensive income, and measured at fair value through profit or loss.
The classification of financial instruments in the categories of amortized cost or fair value depends on the business model with which the entity manages the assets and the contractual characteristics of the cash flows, commonly known as the "solely payments of principal and interest" criterion (hereinafter, the SPPI).
The assessment of the business model should reflect the way the Group manages groups of financial assets and does not depend on the intention for an individual instrument. Thus, for each entity within the BBVA Group there are different business models for managing assets.
In order to determine the business model, the following aspects are taken into account:
- The way in which the performance of the business model (and that of the assets which comprise such business model) is evaluated and reported to the entity's key personnel;
- The risks and the way in which the risks that affect the performance of the business model are managed;
- The way in which business model managers are remunerated;
- The frequency, amount and timing of sales in previous years, the reasons for such sales and expectations regarding future sales.
Regarding the SPPI test, the analysis of the cash flows aims to determine whether the contractual cash flows of the assets correspond only to payments of principal and interest on the principal amount outstanding at the beginning of the transaction. Interest is understood here as the consideration for the time value of money; and for the credit risk associated with the principal amount outstanding during a specific period; and for financing and structure costs, plus a profit margin.
The most significant judgments used by the Group in evaluating compliance with the conditions of the SPPI test are the following:
- Modified time value: in the event that a financial asset includes a periodic interest rate adjustment but the frequency of this adjustment does not coincide with the term of the reference interest rate (for example, the interest rate reset every six months to a one-year rate), the Group assesses, at the time of the initial recognition, this mismatch to determine whether the contractual cash flows (undiscounted) differ significantly or not from the cash flows (undiscounted) of a benchmark financial asset, for which there would be no change in the time value of money. The defined tolerance thresholds are 10% for the differences in each period and 5% for the analysis accumulated throughout the financial asset life.
- Contractual clauses: The contractual clauses that can modify the calendar or the amount of the contractual cash flows are analyzed to verify if the contractual cash flows that would be generated during the life of the instrument due to the exercise of those clauses are only payments of principal and interest on the principal amount outstanding. To do this, the contractual cash flows that may be generated before and after the modification are analyzed.
- The main criteria taken into account in the analysis are:
- Early termination clauses: generally a contractual clause that permits the debtor to prepay a debt instrument before maturity is consistent with SPPI when the prepayment amount substantially represents unpaid amounts of principal and interest on the principal amount outstanding (which may include reasonable additional compensation for the early termination of the contract).
- Instruments with an interest rate linked to contingent events:
- An instrument whose interest rate is reset to a higher rate if the debtor misses a particular payment may meet the SPPI criterion because of the relationship between missed payments and an increase in credit risk.
- An instrument with contractual cash flows that are indexed to the debtor’s performance – e.g. net income or is adjusted based on a certain index or stock market value would not meet the SPPI criterion.
- Perpetual instruments: to the extent that they can be considered instruments with continuous (multiple) extension options, they meet the SPPI test if the contractual flows meet it. When the issuer can defer the payment of interest, if such payment would affect their solvency, they would meet the SPPI test if the deferred interest accrues additional interest, while if they do not, they would not meet the test.
- Non-recourse financial instruments: In the case of debt instruments that are repaid primarily with the cash flows of specific assets or projects and the debtor has no legal responsibility, the underlying assets or cash flows are evaluated to determine whether the contractual cash flows of the instrument are consistent with payments of principal and interest on the principal amount outstanding.
- If the contractual terms do not give rise to additional cash flows to payments of principal and interest on the amount of principal outstanding or limitations to these payments, the SPPI test is met.
- If the debt instrument effectively represents an investment in the underlying assets and its cash flows are inconsistent with principal and interest (because they depend on the performance of a business), the SPPI test is not met.
- Contractually linked instruments: a look-through analysis is carried out in the case of transactions that are set through the issuance of multiple financial instruments forming tranches that create concentrations of credit risk in which there is an order of priority that specifies how the flows of cash generated by the underlying set of financial instruments are allocated to the different tranches. The debt tranches of the instrument will comply with the requirement that their cash flows represent only payment of principal and interest on the outstanding principal if:
- The contractual terms of the tranche being assessed for classification (without looking through to the underlying pool of financial instruments) give rise to cash flows that are solely payments of principal and interest on the principal amount outstanding,
- The underlying pool of financial instruments comprises instruments with cash flow that are solely payments of principal and interest on the principal amount outstanding, and
- The exposure to credit risk in the underlying pool of financial instruments inherent in the tranche is equal to or lower than the exposure to credit risk of the underlying pool of financial instruments (for example, the credit rating of the tranche being assessed for classification is equal to or higher than the credit rating that would apply to a single tranche that funded the underlying pool of financial instruments).
In any event, the contractual conditions that, at the time of the initial recognition, have a minimal effect on cash flows or depend on the occurrence of exceptional and highly unlikely events do not prevent compliance with the conditions of the SPPI test.
Based on the above characteristics, financial assets will be classified and valued as described below.
A debt instrument will be classified in the amortized cost portfolio if the two following conditions are fulfilled:
- The financial asset is managed within a business model whose purpose is to maintain the financial assets to maturity, to receive contractual cash flows; and
- The contractual conditions of the financial asset give rise to cash flows that are only payments of principal and interest.
A debt instrument will be classified in the portfolio of financial assets at fair value with changes through other comprehensive income if the two following conditions are fulfilled:
- The financial asset is managed with a business model whose purpose combines collection of the contractual cash flows and sale of the assets, and
- The contractual characteristics of the instrument generate cash flows which only represent the return of the principal and interest.
A debt instrument will be classified at fair value with changes in profit and loss provided that the entity's business model for their management or the contractual characteristics of its cash flows do not require classification into one of the portfolios described above.
In general, equity instruments will be measured at fair value through profit or loss. However the Group may make an irrevocable election, at initial recognition to present subsequent changes in the fair value through “other comprehensive income”.
Financial assets will only be reclassified when BBVA Group decides to change the business model. In this case, all of the financial assets assigned to this business model will be reclassified. The change of the objective of the business model should occur before the date of the reclassification.
Measurement of financial assets
All financial instruments are initially recognized at fair value, plus, those transaction costs which are directly attributable to the issue of the particular instrument, with the exception of those financial assets which are classified at fair value through profit or loss.
All changes in the value of financial assets due to the interest accrual and similar items are recorded in the headings "Interest and other income" or "Interest expense", of the consolidated income statement of the year in which the accrual occurred (see Note 37), except for trading derivatives that are not economic and accounting hedges.
The changes in fair value after the initial recognition, for reasons other than those mentioned in the preceding paragraph, are treated as described below, according to the categories of financial assets.
“Financial assets held for trading”, “Non-trading financial assets mandatorily at fair value through profit or loss” and “Financial assets designated at fair value through profit or loss”
Financial assets are recorded under the heading “Financial assets held for trading” if the objective of the business model is to generate gains by buying and selling these financial instruments or generate short-term results. The financial assets recorded in the heading “Non-trading financial assets mandatorily at fair value through profit or loss” are derived from a business model which objective is to obtain the contractual cash flows and / or to sell those instruments but its contractual cash flows do not comply with the requirements of the SPPI test. Financial assets are classified in “Financial assets designated at fair value through profit or loss” only if it eliminates or significantly reduces a measurement or recognition inconsistency (an ‘accounting mismatch’) that would otherwise arise from measuring financial assets or financial liabilities, or recognizing gains or losses on them, on different bases.
The assets recognized under these headings of the consolidated balance sheet are measured upon acquisition at fair value and changes in the fair value (gains or losses) are recognized as their net value under the headings “Gains (losses) on financial assets and liabilities held for trading, net”, “Gains (losses) on non-trading financial assets mandatorily at fair value through profit or loss, net” and “Gains (losses) on financial assets designated at fair value through profit or loss, net” in the accompanying consolidated income statement (see Note 41). Changes in fair value resulting from variations in foreign exchange rates are recognized under the heading “Exchange differences, net” in the accompanying consolidated income statements (Note 41).
”Financial assets at fair value through other comprehensive income”
- Debt instruments
Assets recognized under this heading in the consolidated balance sheets are measured at their fair value. This category of valuation implies the recognition of the information in the income statement as if it were an instrument valued at amortized cost, while the instrument is valued at fair value in the balance sheet. Thus, both interest income on these instruments and the exchange differences and impairment that arise in their case are recorded in the profit and loss account, while subsequent changes in its fair value (gains or losses) are recognized temporarily (by the amount net of tax effect) under the heading “Accumulated other comprehensive income (loss) - Items that may be reclassified to profit or loss - Fair value changes of debt instruments measured at fair value through other comprehensive income” in the consolidated balance sheets (see Note 30).
The amounts recognized under the headings “Accumulated other comprehensive income (loss) - Items that may be reclassified to profit or loss - Fair value changes of debt instruments measured at fair value through other comprehensive income” continue to form part of the Group's consolidated equity until the corresponding asset is derecognized from the consolidated balance sheet or until a loss allowance is recognized on the corresponding financial instrument. If these assets are sold, these amounts are derecognized and included under the headings “Gains (losses) on derecognition of financial assets and liabilities not measured at fair value through profit or loss, net” (see Note 41).
The net loss allowances in “Financial assets at fair value through other comprehensive income” over the year are recognized under the heading “Impairment or reversal of impairment on financial assets not measured at fair value through profit or loss or net gains by modification - Financial assets at fair value through other comprehensive income” (see Note 47) in the consolidated income statement for the year. Interest income on these instruments is recorded in the consolidated profit and loss account (see Note 37). Changes in foreign exchange rates are recognized under the heading “Exchange differences, net" in the accompanying consolidated income statements (see Note 41).
- Equity instruments
At the time of initial recognition of specific investments in equity instruments, the BBVA Group may make the irrevocable decision to present subsequent changes in fair value in other comprehensive income. Subsequent changes in this valuation will be recognized in "Accumulated other comprehensive income - Items that will not be reclassified to profit or loss - Fair value changes of equity instruments measured at fair value through other comprehensive income" (see Note 30). Dividends received from these investments are recorded in the heading "Dividend income" in the consolidated income statement (see Note 38). These instruments are not subject to the impairment model of IFRS 9.
“Financial assets at amortized cost”
The assets under this category are subsequently measured at amortized cost, after initial recognition, using the effective interest rate method.
Net loss allowances of assets recorded under these headings arising in each period are recognized under the heading “Impairment or reversal of impairment on financial assets not measured at fair value through profit or loss or net gains by modification – Financial assets measured at amortized cost” in the consolidated income statement for such year (see Note 47).
Classification and measurement of financial liabilities
Classification of financial liabilities
Financial liabilities are classified in the following categories:
- Financial liabilities at amortized cost;
- Financial liabilities that are held for trading, including derivatives, are financial instruments which are recorded in this category when the Group’s objective is to generate gains by buying and selling these financial instruments;
- – Financial liabilities that are designated at fair value through profit or loss on initial recognition under the Fair Value Option. The Group has the option to designate irrevocably, on the initial moment of recognition, a financial liability at fair value through profit or loss provided that doing so results in the elimination or significant reduction of measurement or recognition inconsistency, or if a group of financial liabilities, or a group of financial assets and financial liabilities, has to be managed, and its performance evaluated, on a fair value basis in accordance with a documented risk management or investment strategy.
Measurement of financial liabilities
Financial liabilities are initially recorded at fair value, less transaction costs that are directly attributable to the issuance of instruments, except for financial instruments that are classified at fair value through profit or loss.
Variations in the value of financial liabilities due to the interest accrual and similar items are recorded in the headings “Interest and other income” or “Interest expense”, of the consolidated income statement for the year in which the accrual occurred (see Note 37), except for trading derivatives that are not economic and accounting hedges.
The changes in fair value after the initial recognition, for reasons other than those mentioned in the preceding paragraph, are treated as described below, according to the categories of financial liabilities.
“Financial liabilities held for trading” and “Financial liabilities designated at fair value through profit or loss“
The subsequent changes in the fair value (gains or losses) of the liabilities recognized under these headings of the consolidated balance sheets are recognized as their net value under the headings “Gains (losses) on financial assets and liabilities held for trading, net” and “Gains (losses) on financial assets and liabilities designated at fair value through profit or loss, net” in the accompanying consolidated income statements (see Note 41). The changes in the own credit risk of the liabilities designated under the fair value option is presented in “Accumulated other comprehensive income (loss) – Items that will not be reclassified to profit or loss – Fair value changes of financial liabilities at fair value through profit or loss attributable to changes in their credit risk”, unless this treatment brings about or increases an asymmetry in the income statement. Changes in fair value resulting from variations in foreign exchange rates are recognized under the heading “Exchange differences, net” in the accompanying consolidated income statements (Note 41).
“Financial liabilities at amortized cost”
The liabilities under this category are subsequently measured at amortized cost, using the “effective interest rate” method.
Hybrid financial liabilities
When a financial liability contains an embedded derivative, the Group analyzes whether the economic characteristics and risks of the embedded derivative and the host instrument are closely related.
If the characteristics and risks of the host and the derivative are closely related, the instrument as a whole will be classified and measured according to the general rules for financial liabilities. If, on the other hand, the economic characteristics and risks of the embedded derivative are not closely related to the economic characteristics and risks of the host, its terms meet the definition of a derivative and the hybrid contract is not measured at fair value with changes in fair value recognized in profit or loss, the embedded derivative shall be separated from the host and accounted for as a derivative separately at fair value with changes in profit and loss and the host instrument classified and measured according to its nature.
“Derivatives-Hedge Accounting” and “Fair value changes of the hedged items in portfolio hedges of interest-rate risk”
The Group uses financial derivatives as a tool for managing financial risks, mainly interest rates and exchange rates (See Note 7).
When these transactions meet certain requirements, they are considered "hedging instruments".
Changes occurring subsequent to the designation of the hedging relationship in the measurement of financial instruments designated as hedged items as well as financial instruments designated as hedge accounting instruments are recognized as follows:
- In fair value hedges, the changes in the fair value of the derivative and the hedged item attributable to the hedged risk are recognized under the heading “Gains (losses) from hedge accounting, net” in the consolidated income statement, with a corresponding offset under the headings where hedging items ("Hedging derivatives") and the hedged items are recognized, as applicable, except for interest-rate risks hedges (which are almost all of the hedges used by the Group), for which the valuation changes are recognized under the headings “Interest and other income” or “Interest expense”, as appropriate, in the accompanying consolidated income statement (see Note 37).
- In fair value hedges of interest rate risk of a portfolio of financial instruments (portfolio-hedges), the gains or losses that arise in the measurement of the hedging instrument are recognized in the consolidated income statement, with the corresponding offset on the headings “Derivatives-Hedge Accounting” and the gains or losses that arise from the change in the fair value of the hedged item (attributable to the hedged risk) are also recognized in the consolidated income statement (in both cases under the heading “Gains (losses) from hedge accounting, net”, using, as a corresponding offset, the headings "Fair value changes of the hedged items in portfolio hedges of interest rate risk" in the consolidated balance sheets, as applicable).
- In cash flow hedges, the gain or loss on the hedging instruments relating to the effective portion is recognized temporarily under the heading “Accumulated other comprehensive income (loss) - Items that may be reclassified to profit or loss - Hedging derivatives. Cash flow hedges (effective portion)” in the consolidated balance sheets, with a corresponding offset under the heading “Hedging derivatives” of the Assets or Liabilities of the consolidated balance sheets as applicable. These differences are recognized under the headings “Interest and other income” or “Interest expense” at the time when the gain or loss in the hedged instrument affects profit or loss, when the forecast transaction is executed or at the maturity date of the hedged item. Almost all of the cash flow hedges carried out by the Group are for interest rate risk and inflation of financial instruments, so their differences are recognized under the heading "Interest and other income" or "Interest expense” in the consolidated income statement (see Note 37).
- Differences in the measurement of the hedging items corresponding to the ineffective portions of cash flow hedges are recognized directly in the heading “Gains (losses) from hedge accounting, net” in the consolidated income statement (see Note 41).
- In the hedges of net investments in foreign operations, the differences attributable to the effective portions of hedging items are recognized temporarily under the heading "Accumulated other comprehensive income (loss) - Items that may be reclassified to profit or loss – Hedging of net investments in foreign operations (effective portion)" in the consolidated balance sheets with a corresponding offset entry under the heading “Hedging derivatives” of the Assets or Liabilities of the consolidated balance sheets as applicable. These differences in valuation are recognized in the consolidated income statement when the investment in a foreign operation is disposed of or derecognized (see Note 41).
Loss allowances on financial assets
The “expected losses” impairment model is applied to financial assets valued at amortized cost, debt instruments valued at fair value with changes in accumulated other comprehensive income, financial guarantee contracts and other commitments. All financial instruments valued at fair value through profit or loss are excluded from the impairment model.
The standard classifies financial instruments into three categories, which depend on the evolution of their credit risk from the moment of initial recognition and which establish the calculation of the credit risk allowance.
- Stage 1– without significant increase in credit risk
Financial assets which are not considered to have significantly increased in credit risk have loss allowances measured at an amount equal to the expected credit loss that arises from all possible default events within 12 months following the presentation date of the financial statements (12 month expected credit losses).
- Stage 2– significant increases in credit risk
When the credit risk of a financial asset has increased significantly since the initial recognition, the loss allowances of that financial instrument is calculated as the expected credit loss during the entire life of the asset. That is, they are the expected credit losses that result from all possible default events during the expected life of the financial instrument.
- Stage 3 – Impaired
When there is objective evidence that the instrument is credit impaired, the financial asset is transferred to this category in which the provision for losses of that financial instrument is calculated, as in Stage 2, as the expected credit loss during the entire life of the asset.
When the recovery of any recognized amount is considered remote, such amount is written-off on the consolidated balance sheet, without prejudice to any actions that may be taken in order to collect the amount until the rights extinguish in full either because it is time-barred debt, the debt is forgiven, or other reasons.
The BBVA Group has applied the following definitions:
- Credit impaired asset
An asset is credit- impaired (stage 3) if one or more events have occurred and they have a detrimental impact on the estimated future cash flows of the asset.
Historically, the definition of credit impaired asset under IFRS 9 has been substantially aligned with the definition of default used by the Group for internal credit risk management, which is also the definition used for regulatory purposes. In 2021 the Group updated its definition of default to conform to that set forth in the European Banking Authority (hereinafter EBA) Guidelines, in compliance with article 178 of Regulation (EU) No 575/2013 (CRR). The Group has consequently updated the definition of credit impaired asset (Stage 3), considering it a change in accounting estimates, re-establishing the consistency with the definition of default and guaranteeing the integration of both definitions in credit risk management.
The determination of an asset as impaired and its classification in Stage 3 is based exclusively on the risk of default, without considering the effects of credit risk mitigating measures such as guarantees and collaterals. Specifically, the following financial assets are classified in Stage 3:
-
Impaired assets for objective reasons or delinquency: when there are unpaid amounts of principal or interest for more than 90 days.
According to IFRS 9, the 90-days past due default is a presumption that can be rebutted in those cases where the entity considers, based on reasonable and supportable information, that it is appropriate to use a longer term. As of December 31, 2021, the Group has not used terms exceeding 90 days past due.
- Impaired assets for subjective reasons (other than delinquency): when circumstances are identified that show, even in the absence of defaults, that it is not probable that the debtor will fully comply with its financial obligations. For this purpose, the following indicators are considered, among others:
- Significant financial difficulties of the issuer or the borrower.
- Granting by the lender or lenders to the borrower, for economic or contractual reasons related to the latter's financial difficulties, of concessions or advantages that they would not have otherwise granted.
- Breach of contractual clauses, such as events of default or default.
- Increasing probability that the borrower will go into bankruptcy or some other situation of financial reorganization.
- Disappearance of an active market for the financial asset due to financial difficulties.
- Others that may affect the committed cash flows such as the loss of the debtor's license or that it has committed fraud.
- Generalized delay in payments. In any case, this circumstance exists when, during a continuous period of 90 days prior to the reporting date, a material amount has remained unpaid.
- Sales of credit exposures of a client with a significant economic loss will imply that the rest of its operations are considered impaired.
- Relating to the granting of concessions due to financial difficulties, it is considered that there is an indicator of unlikeliness to pay, and therefore the client must be considered impaired, when the refinancing or restructuring measures may result in a diminished financial obligation caused by a forgiveness or material deferral of principal, interest or fees. Specifically, unless proven otherwise, transactions that meet any of the following criteria will be reclassified to the category of impaired assets:
- Irregular repayment schedule.
- Contractual clauses that delay the repayment of the loan through regular payments. Among others, grace periods of more than two years for the amortization of the principal will be considered clauses with these characteristics.
- Amounts of principal or interest written off from the balance sheet as its recovery is considered remote.
- In any case, a restructuring will be considered impaired when the reduction in the net present value of the financial obligation is greater than 1% in accordance with the new management criteria introduced during 2021.
Credit risk management for wholesale counterparties is carried out at the customer (or group) level. For this reason, the classification of any of a client's material exposures as impaired, whether due to more than 90 days of default or due to any of the subjective criteria, implies the classification as impaired of all the client's exposures.
Regarding retail clients, which are managed at the individual loan level, the scoring systems review their score, among other factors, in the event of a breach in any of their operations or incurring generalized delays in payments, which also triggers the necessary recovery actions. Among them are the refinancing measures that, where appropriate, may lead to all the client's operations being considered impaired. Furthermore, given the granularity of the retail portfolios, the differential behavior of these clients in relation to their products and collateral provided, as well as the time necessary to find the best solution, the Group has established as an indicator that when a transaction of a retail client is in default in excess of 90 days or shows a general delay in payments and this represents more than 20% of the client's total balance, all its transactions are considered impaired.
When operations by entities related to the client fall into Stage 3, including both entities of the same group and those with which there is a relationship of economic or financial dependence, the transactions of the holder will also be classified as Stage 3 if after the analysis it is concluded that there are reasonable doubts about the full payment of the loans.
The Stage 3 classification will be maintained for a cure period of 3 months from the disappearance of all indicators of impairment during which the client must demonstrate good payment behavior and an improvement in their credit quality in order to corroborate the disappearance of the causes that motivated the classification of the debt as impaired. In the case of refinancing and restructuring, the cure period is one year (see Note 7.2.7 for more details).
These criteria are aligned in all the geographies of the Group, maintaining only minor differences to facilitate the integration of management at the local level.
- Significant increase in credit risk
The objective of the impairment requirements is to recognize lifetime expected credit losses for financial instruments for which there have been significant increases in credit risk since initial recognition considering all reasonable and supportable information, including that which is forward-looking.
The model developed by the Group for assessing the significant increase in credit risk has a two-prong approach that is applied globally (for more detail on the methodology used, see Note 7.2.1):
- Quantitative criterion: the Group uses a quantitative analysis based on comparing the current expected probability of default over the life of the transaction with the original adjusted expected probability of default, so that both values are comparable in terms of expected default probability for their residual life (see Note 7.2.1).
- Qualitative criterion: most indicators for detecting significant risk increase are included in the Group's systems through rating and scoring systems or macroeconomic scenarios, so the quantitative analysis covers the majority of circumstances. The Group uses additional qualitative criteria to identify significant increase in credit risk and thus, to include circumstances that are not reflected in the rating/score systems or macroeconomic scenarios used. Such qualitative criteria are the following:
- More than 30 days past due. According to IFRS 9, default of more than 30 days is a presumption that can be rebutted in those cases in which the entity considers, based on reasonable and documented information, that such non-payment does not represent a significant increase in risk. As of December 31, 2021, the Group has not considered periods higher than 30 days.
- Watch list: They are subject to special watch by the Risk units because they show negative signs in their credit quality, even though there may be no objective evidence of impairment.
- Refinance or restructuring that does not show evidence of impairment, or that, having been previously identified, the existence of significant increase in credit risk may still exist.
Although the standard introduces a series of operational simplifications, also known as practical solutions, for analyzing the increase in significant risk, the Group does not use them as a general rule. However, for high-quality assets, mainly related to certain government institutions and bodies, the standard allows for considering that their credit risk has not increased significantly because they have a low credit risk at the presentation date. This possibility is limited to those financial instruments that are classified as having high credit quality and high liquidity to comply with the liquidity coverage ratio (LCR). This does not prevent these assets from being assigned the credit risk coverage that corresponds to their classification as Stage 1 based on their credit rating and macroeconomic expectations.
Method for calculating Expected Credit Loss (ECL)
Method for calculating expected loss
The measurement of expected losses must reflect:
- A considered and unbiased amount, determined by evaluating a range of possible results;
- The time value of money, and
- Reasonable and supportable information that is available without undue cost or effort and that reflects current conditions and forecasts of future economic conditions.
Expected losses are measured both individually and collectively
The individualized estimate of credit losses results from calculating the difference between the expected cash flows discounted at the effective interest rate of the transaction and the carrying amount of the instrument (see Note 7.2.1).
For the collective measurement of expected losses the instruments are classified into groups of assets based on their risk characteristics. Exposure within each group is segmented according to credit risk common characteristics, which indicate the payment capacity of the borrower according to the contractual conditions. These risk characteristics have to be relevant in estimating the future flows of each group. The characteristics of credit risk may consider, among others, the following factors (See Note 7.2.1):
- Type of instrument.
- Rating or scoring tools.
- Credit risk scoring or rating.
- Type of collateral.
- Amount of time at default for stage 3.
- Segment.
- Qualitative criteria which can have a significant increase in risk.
- Collateral value if it has an impact on the probability of a default event.
The estimated losses are derived from the following parameters:
- PD: estimate of the probability of default in each period.
- EAD: estimate of the exposure in case of default at each future period, taking into account the changes in exposure after the closing date of the financial statements.
- LGD: estimate of the loss in case of default, calculated as the difference between the contractual cash flows and receivables, including guarantees. For these purposes, the probability of executing the guarantee, the moment until its ownership and subsequent realization are achieved, the expected cash flows and the acquisition and sale costs, are considered in the estimation.
- CCF: cash conversion factor is the estimate made on off-balance sheet contractual arrangements to determine the exposure subject to credit risk in the event of a default.
At the BBVA Group, the calculated expected credit losses are based on internal models developed for all portfolios within the IFRS 9 scope, except for the cases that are subject to individual analysis.
The calculation and recognition of expected credit losses includes exposures with governments and credit institutions, for which, despite having a reduced number of defaults in the information databases, internal models have been developed, considering, as sources of information, the data provided by external rating agencies or other observed in the market, such as changes in bond yields, prices of credit default swaps or any other public information on them.
Use of present, past and future information
IFRS 9 requires incorporation of present, past and future information to detect any significant increase in risk and measure expected loss, which must be carried out on a weighted probability basis.
The standard does not require identification of all possible scenarios for measuring expected loss. However, the probability of a loss event occurring and the probability it will not occur have to be considered, even though the possibility of a loss may be very low. To achieve this, the Group generally evaluates the linear relationship between its estimated loss parameters (PD, LGD and EAD) with the historical and future forecasts of the macroeconomic scenarios.
Additionally, when there is no linear relation between the different future economic scenarios and their associated expected losses, more than one future economic scenario must be used for the measurement.
The approach taken by the Group consists of using a methodology based on the use of three scenarios. The first is the most probable scenario (base scenario) that is consistent with that used in the Group's internal management processes, and two additional ones, one more positive and the other more negative. The combined outcome of these three scenarios is calculated considering the weight given to each of them. The main macroeconomic variables that are valued in each of the scenarios for each of the geographies in which the Group operates are the Gross Domestic Product (GDP), the real estate price index, interest rates and the unemployment rate. The main goal of the Group's approach is seeking the greatest predictive capacity with respect to the first two variables (see Note 7.2.1).
2.2.2 Transfers and derecognition of financial assets and liabilities
The accounting treatment of transfers of financial assets is determined by the form in which risks and benefits associated with the financial assets involved are transferred to third parties. Financial assets are only derecognized from the consolidated balance sheet when the cash flows that they generate are extinguished, when their implicit risks and benefits have been substantially transferred to third parties or when the control of financial asset is transferred even in case of no physical transfer or substantial retention of such assets. In the latter case, the financial asset transferred is derecognized from the consolidated balance sheet, and any right or obligation retained or created as a result of the transfer is simultaneously recognized.
Similarly, financial liabilities are derecognized from the consolidated balance sheet only if their obligations are extinguished or acquired (with a view to subsequent cancellation or renewed placement).
The Group is considered to have transferred substantially all the risks and benefits if such risks and benefits account for the majority of the risks and benefits involved in ownership of the transferred financial assets. If substantially all the risks and benefits associated with the transferred financial asset are retained:
- The transferred financial asset is not derecognized from the consolidated balance sheet and continues to be measured using the same criteria as those used before the transfer.
- A financial liability is recognized at the amount equal to the amount received, which is subsequently measured at amortized cost or fair value with changes in the income statement, whichever the case.
- Both the income generated on the transferred (but not derecognized) financial asset and the expense of the new financial liability continue to be recognized.
Treatment of securitizations
The securitizations funds to which the Group entities transfer their credit portfolios are consolidated entities of the Group. For more information, refer to Note 2.1 “Principles of consolidation”.
The Group considers that the risks and benefits of the securitizations are substantially retained if the subordinated bonds are held and/ or if subordination funding has been granted to those securitization funds, which means that the credit loss risk of the securitized assets will be assumed. Consequently, the Group is not derecognizing those transferred loan portfolios.
Synthetic securitizations are transactions where risk is transferred through derivatives or financial guarantees and in which the exposure of these securitizations remains in the balance sheet of the Group. The Group has established the synthetic securitizations through received financial guarantees. As for the commissions paid, they are accrued during the term of the financial guarantee.
2.2.3 Financial guarantees
Financial guarantees are considered to be those contracts that require their issuer to make specific payments to reimburse the holder of the financial guarantee for a loss incurred when a specific borrower breaches its payment obligations on the terms – whether original or subsequently modified – of a debt instrument, irrespective of the legal form it may take. Financial guarantees may take the form of a deposit, bank guarantee, insurance contract or credit derivative, among others.
In their initial recognition, financial guarantees are recognized as liabilities in the consolidated balance sheet at fair value, which is generally the present value of the fees, commissions and interest receivable from these contracts over the term thereof, and the Group simultaneously recognizes a corresponding asset in the consolidated balance sheet for the amount of the fees and commissions received at the inception of the transactions and the amounts receivable at the present value of the fees, commissions and interest outstanding.
Financial guarantees, irrespective of the guarantor, instrumentation or other circumstances, are reviewed periodically so as to determine the credit risk to which they are exposed and, if appropriate, to consider whether a provision is required for them. The credit risk is determined by application of criteria similar to those established for quantifying loss allowances on debt instruments measured at amortized cost (see Note 2.2.1).
The provisions recognized for financial guarantees are recognized under the heading “Provisions - Provisions for contingent risks and commitments” on the liability side in the consolidated balance sheets (see Note 24). These provisions are recognized and reversed with a charge or credit, respectively to “Provisions or reversal of provision” in the consolidated income statements (see Note 46).
Income from financial guarantees is recorded under the heading “Fee and commission income” in the consolidated income statement and is calculated by applying the rate established in the related contract to the nominal amount of the guarantee (see Note 40).
Synthetic securitizations made by the Group to date meet the requirements of the accounting regulations for accounting as guarantees. Consideration as a financial guarantee means recognition of the commission paid for it over the period.
2.2.4 Non-current assets and disposal groups classified as held for sale and liabilities included in disposal groups classified as held for sale
The heading “Non-current assets and disposal groups classified as held for sale” in the consolidated balance sheet includes the carrying amount of individual items or items integrated in a group ("disposal group") or that form part of a significant business line or geographic area that is intended to be disposed of (“discontinued operation”) whose sale is highly probable to take place under the current conditions within a period of one year from the date to which the financial statements refer. Additionally, assets that were expected to be disposed of within a year but which disposal is delayed due to events and circumstances beyond the control of the Group can be classified as held for sale (see Note 21).
Symmetrically, the heading “Liabilities included in disposal groups classified as held for sale” in the consolidated balance sheet reflects the balances payable arising from disposal groups and discontinued operations.
With respect to the subsidiaries of the BBVA Group, the heading "Non-current assets and disposal groups classified as held for sale" includes the assets received by the subsidiaries for the satisfaction, in whole or in part, of the payment obligations of their debtors (foreclosed or received in payment of debt or recoveries from financial leasing transactions, unless the Group has decided to make continued use of those assets). The BBVA Group has specific units focused on real estate management and sale of these types of assets.
Non-current assets and disposal groups classified as held for sale are measured, at the acquisition date and at any later date deemed necessary, at either their carrying amount or the fair value of the property (less costs to sell), whichever is lower. An impairment or reversal of impairment for the difference is recognized if applicable. When the amount of the sale less estimated costs of sale is higher than the carrying value, the gain is not recognized until the moment of disposal and derecognition from the balance sheet.
Non-current assets and disposal groups classified as held for sale are not depreciated while included under the heading “Non-current assets and disposal groups classified as held for sale”.
In the case of real estate assets foreclosed or received in payment of debts, they are initially recognized at the lower of: the restated carrying amount of the financial asset and the fair value at the time of the foreclosure or receipt of the asset less estimated sales costs. The carrying amount of the financial asset is updated at the time of the foreclosure, treating the real property received as a secured collateral and taking into account the credit risk coverage that would correspond to it according to its classification prior to the delivery. For these purposes, the collateral will be valued at its current fair value (less sale costs) at the time of foreclosure. This carrying amount will be compared with the previous carrying amount and the difference will be recognized as a provision increase, if applicable. On the other hand, the fair value of the foreclosed assets is based mainly on appraisals or valuations carried out by independent experts on an annual basis or more frequently if there are indications of impairment by appraisal, evaluating the need to apply a discount on the asset derived from the specific conditions of the asset or the market situation for these assets and in any case, deducting the company’s estimated sale costs.
Gains and losses generated on the disposal of assets and liabilities classified as non-current held for sale, and liabilities included in disposal groups classified as held for sale as well as impairment losses and, where pertinent, the related recoveries, are recognized in “Gains (losses) from non-current assets and disposal groups classified as held for sale not qualifying as discontinued operations” in the consolidated income statement (see Note 50). The remaining income and expense items associated with these assets and liabilities are classified within the relevant consolidated income statement headings.
Income and expense for discontinued operations, whatever their nature, generated during the year, even if they have occurred before their classification as discontinued operations, are presented net of the tax effect as a single amount under the heading “Profit (loss) after tax from discontinued operations” in the consolidated income statement (see Notes 1.3, 3 and 21). This heading includes the earnings from their sale or other disposal (net of tax effects).
2.2.5 Tangible Assets
Property, plant and equipment for own use
This heading includes the assets under ownership or acquired under lease terms (right to use), intended for future or current use by the BBVA Group and that it expects to hold for more than one year. It also includes tangible assets received by the consolidated entities in full or partial settlement of financial assets representing receivables from third parties which are expected to be held for continuing use.
For more information regarding the accounting treatment of right to use assets under lease terms, see Note 2.2.18 "Leases".
Property, plant and equipment for own use are presented in the consolidated balance sheets at acquisition cost, less any accumulated depreciation and, where appropriate, any estimated impairment losses resulting from comparing the net carrying amount of each item with its corresponding recoverable amount (see Note 17).
Depreciation is calculated using the straight-line method, during the useful life of the asset, on the basis of the acquisition cost of the assets less their residual value; the land is considered to have an indefinite life and is therefore not depreciated.
The tangible asset depreciation charges are recognized in the accompanying consolidated income statements under the heading "Depreciation and Amortization" (see Note 45) and are based on the application of the following depreciation rates (determined on the basis of the average years of estimated useful life of the various assets):
Depreciation rates for tangible assets
| Type of assets | Annual Percentage |
|---|---|
| Buildings for own use | 1% - 4% |
| Furniture | 8% - 10% |
| Fixtures | 6% - 12% |
| Office supplies and hardware | 8% - 25% |
| Lease use rights | The lesser of the lease term or the useful life of the underlying asset |
At each reporting date, the Group entities analyze whether there are internal or external indicators that a tangible asset may be impaired. When there is evidence of impairment, the Group analyzes whether this impairment actually exists by comparing the asset’s net carrying amount with its recoverable amount (defined as the higher between its recoverable amount less disposal costs and its value in use). When the carrying amount exceeds the recoverable amount, the carrying amount is written down to the recoverable amount and depreciation charges going forward are adjusted to reflect the asset’s remaining useful life.
Similarly, if there is any indication that the value of a previously impaired tangible asset is now recoverable, the consolidated entities will estimate the recoverable amounts of the asset and recognize it in the consolidated income statement, recording the reversal of the impairment loss recognized in previous years and thus adjusting future depreciation charges. Under no circumstances may the reversal of an impairment loss on an asset raise its carrying amount above that which it would have if no impairment losses had been recognized in prior years.
In the BBVA Group, most of the buildings held for own use are assigned to the different Cash Generating Units (CGU) to which they belong. The corresponding impairment analyses are performed for these CGU to check whether sufficient cash flows are generated to support the value of the assets comprised within.
Operating and maintenance expense relating to tangible assets held for own use are recognized as an expense in the year they are incurred and recognized in the consolidated income statements under the heading "Administration costs - Other administrative expense - Property, fixtures and materials" (see Note 44.2).
Other assets leased out under an operating lease
The criteria used to recognize the acquisition cost of assets leased out under operating leases, to calculate their depreciation and their respective estimated useful lives and to recognize the impairment losses on them, are the same as those described in relation to tangible assets for own use.
Investment properties
The heading “Tangible assets - Investment properties” in the consolidated balance sheets reflects the net values (purchase cost minus the corresponding accumulated depreciation and, if appropriate, estimated impairment losses) of the land, buildings and other structures that are held either to earn rental income or for capital appreciation through sale and that are neither expected to be sold off in the ordinary course of business nor are destined for own use (see Note 17).
The criteria used to recognize the acquisition cost of investment properties, calculate their depreciation and their respective estimated useful lives and recognize the impairment losses on them, are the same as those described in relation to tangible assets held for own use.
2.2.6 Business combinations
A business combination is a transaction, or any other deal, by which the Group obtains control of one or more businesses. It is accounted for by applying the “acquisition method”.
According to this method, the acquirer has to recognize the assets acquired and the liabilities and contingent liabilities assumed, including those that the acquired entity had not recognized in the accounts. The method involves the measurement of the consideration received for the business combination and its allocation to the assets, liabilities and contingent liabilities measured according to their fair value, at the purchase date, as well as the recognition of any non-controlling participation (minority interests) that may arise from the transaction.
In a business combination achieved in stages, the acquirer shall measure its previously held equity interest in the acquiree at its acquisition-date fair value and recognize the resulting gain or loss, if any, in profit or loss under the heading “Gains (losses) on derecognition of non-financial assets and subsidiaries, net” of the consolidated income statements. In prior reporting periods, the acquirer may have recognized changes in the value of its equity interest in the acquiree in other comprehensive income. If so, the amount that was recognized in other comprehensive income shall be recognized on the same basis as would be required if the acquirer had disposed directly of the previously held equity interest.
In addition, the acquirer shall recognize an asset in the consolidated balance sheet under the heading “Intangible asset - Goodwill” if on the acquisition date there is a positive difference between:
- the sum of the consideration transferred, the amount of all the non-controlling interests and the fair value of stock previously held in the acquired business; and
- the net fair value of the assets acquired and liabilities assumed.
If this difference is negative, it shall be recognized directly in the income statement under the heading “Negative goodwill recognized in profit or loss”.
Non-controlling interests in the acquired entity may be measured in two ways: either at their fair value; or at the proportional percentage of net assets identified in the acquired entity. The method of valuing non-controlling interest may be elected in each business combination. BBVA Group has always elected the second method.
2.2.7 Intangible assets
Goodwill
Goodwill represents a portion of consideration transferred in advance by the acquiring entity for the future economic benefits from assets that cannot be individually identified and separately recognized. Goodwill is never amortized. It is subject periodically to an impairment analysis, and is written down if there has been impairment (see Note 18).
Goodwill is assigned to one or more CGU that expect to be the beneficiaries of the synergies derived from the business combinations. The CGU represent the Group’s smallest identifiable asset groups that generate cash flows for the Group and that are largely independent of the flows generated from the Group’s other assets or groups of assets. Each unit or units to which goodwill is allocated:
- Is the lowest level at which the entity manages goodwill internally.
- Is not larger than an operating segment.
The CGU to which goodwill has been allocated are tested for impairment (including the allocated goodwill in their carrying amount). This analysis is performed at least annually or more frequently if there is any indication of impairment.
For the purpose of determining the impairment of a CGU to which a part of goodwill has been allocated, the carrying amount of that CGU, adjusted by the theoretical amount of the goodwill attributable to the non-controlling interests, in the event they are not valued at fair value, is compared with its recoverable amount.
The recoverable amount of a CGU is equal to the fair value less sale costs or its value in use, whichever is greater. Value in use is calculated as the discounted value of the cash flow projections that the unit’s management estimates and is based on the latest budgets approved for the coming years. The main assumptions used in its calculation are: a growth rate to extrapolate the cash flows indefinitely, and the discount rate used to discount the cash flows, which is equal to the cost of the capital assigned to each CGU, and equivalent to the sum of the risk-free rate plus a risk premium inherent to the CGU being evaluated for impairment.
If the carrying amount of the CGU exceeds the related recoverable amount, the Group recognizes an impairment loss; the resulting loss is apportioned by reducing, first, the carrying amount of the goodwill allocated to that unit and, second, if there are still impairment losses remaining to be recognized, the carrying amount of the remainder of the assets. This is done by allocating the remaining loss in proportion to the carrying amount of each of the assets in the unit. In the event the non-controlling interests are measured at fair value, the deterioration of goodwill attributable to non-controlling interests will be recognized. In any case, an impairment loss recognized for goodwill shall not be reversed in a subsequent period.
Goodwill impairment losses are recognized under the heading "Impairment or reversal of impairment on non-financial assets – Intangible assets” (see Note 49).
Other intangible assets
These assets may have an indefinite useful life if, based on an analysis of all relevant factors, it is concluded that there is no foreseeable limit to the period over which the asset is expected to generate net cash flows for the consolidated entities. In all other cases they have a finite useful life (see Note 18).
Intangible assets with a finite useful life are amortized according to the duration of this useful life, using methods similar to those used to depreciate tangible assets. The defined useful life intangible asset is made up mainly of IT applications acquisition costs which have a useful life of 3 to 5 years. The amortization charge of these assets is recognized in the accompanying consolidated income statements under the heading "Depreciation and amortization" (see Note 45).
The consolidated entities recognize any impairment losses on the carrying amount of these assets with a charge to the heading “Impairment or reversal of impairment on non-financial assets- Intangible assets” in the accompanying consolidated income statements (see Note 49). The criteria used to recognize the impairment losses on these assets and, where applicable, the recovery of impairment losses recognized in prior years, are similar to those used for tangible assets.
2.2.8 Insurance and reinsurance contracts
The assets and liabilities of the BBVA Group’s insurance subsidiaries are recognized according to their nature under the corresponding headings of the consolidated balance sheet.
The heading “Insurance and reinsurance assets” in the accompanying consolidated balance sheets includes the amounts that the consolidated insurance subsidiaries are entitled to receive under the reinsurance contracts entered into by them with third parties and, more specifically, the reinsurer´s share of the technical provisions recognized by the consolidated insurance subsidiaries.
The heading “Liabilities under insurance and reinsurance contracts” in the accompanying consolidated balance sheets includes the technical provisions for direct insurance and inward reinsurance recognized by the consolidated insurance subsidiaries to cover claims arising from insurance contracts open at period-end (see Note 23).
The income or expense reported by the BBVA Group’s consolidated insurance subsidiaries on their insurance activities is recognized, in accordance with their nature, in the corresponding items of the consolidated income statements.
The consolidated insurance entities of the BBVA Group recognize the amounts of the premiums written and a charge for the estimated cost of the claims that will be incurred at their final settlement to their consolidated income statements. At the close of each year the amounts collected and unearned, as well as the costs incurred and unpaid, are accrued.
The most significant provisions recorded by consolidated insurance entities with respect to insurance policies issued by them are set out by their nature in Note 23.
According to the type of product, the provisions may be as follows:
- Life insurance provisions:
- Represents the value of the net obligations undertaken with the life insurance policyholder. These provisions include:
- Provisions for unearned premiums. These are intended for the accrual, at the date of calculation, of the premiums written. Their balance reflects the portion of the premiums received until the closing date that has to be allocated to the period from year-end to the end of the insurance policy period.
- Mathematical reserves: Represents the value of the life insurance obligations of the insurance entities at year-end, net of the policyholder’s obligations, arising from life insurance contracted.
- Non-life insurance provisions:
- Provisions for unearned premiums. These provisions are intended for the accrual, at the date of calculation, of the premiums written. Their balance reflects the portion of the premiums received until the closing date that has to be allocated to the period between the year-end and the end of the policy period.
- Provisions for unexpired risks: The provision for unexpired risks supplements the provision for unearned premiums by the amount by which that provision is not sufficient to reflect the assessed risks and expenses to be covered by the consolidated insurance subsidiaries in the policy period not elapsed at year-end.
- Provision for claims:
- This reflects the total amount of the outstanding obligations arising from claims incurred prior to year-end. Insurance subsidiaries calculate this provision as the difference between the total estimated or certain cost of the claims not yet reported, settled or paid, and the total amounts already paid in relation to these claims.
- Provision for bonuses and rebates:
- This provision includes the amount of the bonuses accruing to policyholders, insurees or beneficiaries and the premiums to be returned to policyholders or insurees, as the case may be, based on the behavior of the risk insured, to the extent that such amounts have not been individually assigned to each of them.
- Technical provisions for reinsurance ceded:
- Calculated by applying the criteria indicated above for direct insurance, taking account of the assignment conditions established in the open reinsurance contracts.
- Other technical provisions:
- Insurance entities have recognized provisions to cover the probable mismatches in the market reinvestment interest rates with respect to those used in the valuation of the technical provisions.
2.2.9 Tax assets and liabilities
Expenses on corporate income tax applicable to the BBVA Group’s Spanish entities and on similar income taxes applicable to consolidated foreign entities are recognized in the consolidated income statement, except when they result from transactions on which the profits or losses are recognized directly in equity, in which case the related tax effect is also recognized in equity.
The total corporate income tax expense is calculated by aggregating the current tax arising from the application of the corresponding tax rate as per the tax base for the year (after deducting the tax credits or discounts allowable for tax purposes) and the change in deferred tax assets and liabilities recognized in the consolidated income statement.
Deferred tax assets and liabilities include temporary differences, defined as the amounts to be payable or recoverable in future years arising from the differences between the carrying amount of assets and liabilities and their tax bases (the “tax value”), and tax loss and tax credit or discount carry forwards. These amounts are calculated by applying to each temporary difference the tax rates that are expected to apply when the asset is realized or the liability settled (see Note 19).
The "Tax Assets" line item in the accompanying consolidated balance sheets includes the amount of all the assets of a tax nature, broken down into: "Current” (amounts of tax recoverable in the next twelve months) and "Deferred" (which includes the amount of tax to be recovered in future years, including those arising from tax losses or credits for deductions or rebates that can be compensated). The "Tax Liabilities" line item in the accompanying consolidated balance sheets includes the amount of all the liabilities of a tax nature, except for provisions for taxes, broken down into: "Current” (income tax payable on taxable profit for the year and other taxes payable in the next twelve months) and "Deferred" (the amount of corporate tax payable in subsequent years).
Deferred tax liabilities attributable to taxable temporary differences associated with investments in subsidiaries, associates or joint venture entities are recognized as such, except where the Group can control the timing of the reversal of the temporary difference and it is unlikely that it will reverse in the future. Deferred tax assets are recognized to the extent that it is probable that the consolidated entities will generate enough taxable profits to make deferred tax assets effective and do not correspond to those from initial recognition (except in the case of business combinations), which also does not affect the fiscal outcome.
The deferred tax assets and liabilities recognized are reassessed by the consolidated entities at each balance sheet date in order to ascertain whether they still qualify as deferred tax assets and liabilities, and the appropriate adjustments are made on the basis of the findings of the analyses performed. In those circumstances in which it is unclear how a specific requirement of the tax law applies to a particular transaction or circumstance, and the acceptability of the definitive tax treatment depends on the decisions taken by the relevant taxation authority in future, the entity recognizes current and deferred tax liabilities and assets considering whether it is probable or not that a taxation authority will accept an uncertain tax treatment. Thus, if the entity concludes that it is not probable that the taxation authority will accept an uncertain tax treatment, the entity uses the amount expected to be paid to (recovered from) the taxation authorities.
The income and expense directly recognized in consolidated equity that do not increase or decrease taxable income are accounted for as temporary differences.
2.2.10 Provisions, contingent assets and contingent liabilities
The heading “Provisions” in the consolidated balance sheets includes amounts recognized to cover the BBVA Group’s current obligations arising as a result of past events. These are certain in terms of nature but uncertain in terms of amount and/or settlement date. The settlement of these obligations is deemed likely to entail an outflow of resources embodying economic benefits (see Note 24). The obligations may arise in connection with legal or contractual provisions, valid expectations formed by Group entities relative to third parties in relation to the assumption of certain responsibilities or through virtually certain developments of particular aspects of the regulations applicable to the operation of the entities; and, specifically, future legislation to which the Group will certainly be subject. The provisions are recognized in the consolidated balance sheets when each and every one of the following requirements is met:
- They represent a current obligation that has arisen from a past event. At the date of the Consolidated Financial Statements, there is more probability that the obligation will have to be met than that it will not.
- It is probable that an outflow of resources embodying economic benefits will be required to settle the obligation.
- The amount of the obligation can be reasonably estimated.
Among other items, these provisions include the commitments made to employees by some of the Group entities mentioned in Note 2.2.11, as well as provisions for tax and legal litigation.
Contingent assets are possible assets that arise from past events and whose existence is conditional on, and will be confirmed only by, the occurrence or non-occurrence of events beyond the control of the Group. Contingent assets are not recognized in the consolidated balance sheet or in the consolidated income statement; however, they will be disclosed, should they exist, in the Notes to the Consolidated Financial Statements, provided that it is probable they will give rise to an increase in resources embodying economic benefits (see Note 34).
Contingent liabilities are possible obligations of the Group that arise from past events and whose existence is conditional on the occurrence or non-occurrence of one or more future events beyond the control of the Group. They also include the existing obligations of the Group when it is not probable that an outflow of resources embodying economic benefits will be required to settle them; or when, in extremely rare cases, their amount cannot be measured with sufficient reliability.
Contingent liabilities are not recognized in the consolidated balance sheet or the income statement (excluding contingent liabilities from business combinations) but are disclosed in the Notes to the Consolidated Financial Statements, unless the possibility of an outflow of resources embodying economic benefits is remote.
2.2.11 Pensions and other post-employment commitments
Below we provide a description of the most significant accounting policies relating to post-employment and other employee benefit commitments assumed by BBVA Group entities (see Note 25).
Short-term employee benefits
Benefits for current active employees which are accrued and settled during the year and for which a provision is not required in the entity´s accounts. These include wages and salaries, social security charges and other personnel expense.
Costs are charged and recognized under the heading “Administration costs – Personnel expense – Other personnel expense” of the consolidated income statement (see Note 44.1).
Post-employment benefits – Defined-contribution plans
The Group sponsors defined-contribution plans for the majority of its active employees. The amount of these benefits is established as a percentage of remuneration and/or as a fixed amount.
The contributions made to these plans in each year by BBVA Group entities are charged and recognized under the heading “Administration costs – Personnel expense– Defined-contribution plan expense” of the consolidated income statement (see Note 44.1).
Post-employment benefits – Defined-benefit plans
Some Group entities maintain pension commitments with employees who have already retired or taken early retirement, certain closed groups of active employees still accruing defined benefit pensions, and in-service death and disability benefits provided to most active employees. These commitments are covered by insurance contracts, pension funds and internal provisions.
In addition, some of the Spanish entities have offered certain employees the option to retire before their normal retirement age, recognizing the necessary provisions to cover the costs of the associated benefit commitments, which include both the liability for the benefit payments due as well as the contributions payable to external pension funds during the early retirement period.
Furthermore, certain Group entities provide welfare and medical benefits which extend beyond the date of retirement of the employees entitled to the benefits.
All of these commitments are quantified based on actuarial valuations, with the amounts recorded under the heading “Provisions – Provisions for pensions and similar obligations” in the consolidated balance sheet and determined as the difference between the value of the defined-benefit commitments and the fair value of plan assets at the date of the Consolidated Financial Statements (see Note 25).
Current service cost is charged and recognized under the heading “Administration costs – Personnel expense – Defined-benefit plan expense” of the consolidated income statement (see Note 44.1).
Interest credits/charges relating to these commitments are charged and recognized in net terms under the headings “Interest and other income” or, where appropriated, “Interest expense” of the consolidated income statement (see Note 37).
Past service costs arising from benefit plan changes as well as early retirements granted during the year are recognized under the heading “Provisions or reversals of provisions” of the consolidated income statement (see Note 46).
Other long-term employee benefits
In addition to the above commitments, certain Group entities provide long-term service awards to their employees, consisting of monetary amounts or periods of vacation granted upon completion of a number of years of qualifying service. This heading also includes the commitments related to the termination of employment contracts according to the collective layoff procedure carried out in BBVA, S.A.
These commitments are quantified based on actuarial valuations and the amounts recorded under the heading “Provisions – Other long-term employee benefits” of the consolidated balance sheet (see Note 24).
Valuation of commitments: actuarial assumptions and recognition of gains/losses
The present value of these commitments is determined based on individual member data. Active employee costs are determined using the “projected unit credit” method, which treats each period of service as giving rise to an additional unit of benefit and values each unit separately.
In establishing the actuarial assumptions we take into account that:
- They should be unbiased, i.e. neither unduly optimistic nor excessively conservative.
- – Each assumption does not contradict the others and adequately reflects the existing relationship between economic variables such as price inflation, expected wage increases, discount rates and the expected return on plan assets, etc. Future wage and benefit levels should be based on market expectations, at the balance sheet date, for the period over which the obligations are to be settled.
- The interest rate used to discount benefit commitments is determined by reference to market yields, at the balance sheet date, on high quality bonds.
The BBVA Group recognizes actuarial gains (losses) relating to early retirement benefits, long service awards and other similar items under the heading “Provisions or reversal of provisions” of the consolidated income statement for the period in which they arise (see Note 46). Actuarial gains (losses) relating to pension and medical benefits are directly charged and recognized under the heading "Accumulated other comprehensive income (loss) – Items that will not be reclassified to profit or loss – Actuarial gains (losses) on defined benefit pension plans" of equity in the consolidated balance sheet (see Note 30).
2.2.12 Equity-settled share-based payment transactions
Equity –settled share-based payment transactions, provided they constitute the delivery of such equity instruments once completion of a specific period of services has occurred, are recognized as an expense for services being provided by employees, with a corresponding entry under the heading “Shareholders’ funds – Other equity instruments” in the consolidated balance sheet. These services are measured at fair value for the employees services received, unless such fair value cannot be calculated reliably. In such case, they are measured by reference to the fair value of the equity instruments granted, taking into account the date on which the commitments were granted and the terms and other conditions included in the commitments.
When the initial compensation agreement includes what may be considered market conditions among its terms, any changes in these conditions will not be reflected in the consolidated income statement, as these have already been accounted for in calculating the initial fair value of the equity instruments. Non-market vesting conditions are not taken into account when estimating the initial fair value of equity instruments, but they are taken into account when determining the number of equity instruments to be issued. This will be recognized on the consolidated income statement with the corresponding increase in total consolidated equity.
2.2.13 Termination benefits
Termination benefits are recognized in the financial statements when the BBVA Group agrees to terminate employment contracts with its employees or from the time the costs for a restructuring that involves the payment of compensation for the termination of contracts with its employees are recorded. This happens when there is a formal and detailed plan in which the fundamental modifications to be made are identified, and whenever said plan has begun to be executed or its main characteristics or objective facts about its execution have been publicly announced.
2.2.14 Treasury shares
The value of common stock issued by the BBVA Group’s entities and held by them - basically, shares and derivatives on the Bank’s shares held by some consolidated entities that comply with the requirements to be recognized as equity instruments - are recognized as a decrease to net equity, under the heading "Shareholders’ funds - Treasury stock" in the consolidated balance sheets (see Note 29).
These financial assets are recognized at acquisition cost, and the gains or losses arising on their disposal are credited or debited, as appropriate, to the heading “Shareholders’ funds - Retained earnings” in the consolidated balance sheets (see Note 28).
In the event of a contractual obligation to acquire treasury shares, a financial liability is recorded as the present value of the amount committed (under the heading "Financial liabilities at amortized cost - Other financial liabilities") and the corresponding recognition in net equity (under the heading “Equity - Other Reserves) (see Notes 22.5 and 28).
2.2.15 Foreign-currency transactions and exchange differences
The currency in which the Financial Statements of the BBVA Group are presented is the euro. As such, all balances and transactions denominated in currencies other than the euro are deemed to be expressed in “foreign currency”.
Conversion to euros of the balances held in foreign currency is performed in two consecutive stages:
- Conversion of the foreign currency to the entity’s functional currency (currency of the main economic environment in which the entity operates); and
- Conversion to euros of the balances held in the functional currencies of the entities whose functional currency is not the euro.
Conversion of the foreign currency to the entity’s functional currency
Transactions denominated in foreign currencies carried out by the consolidated entities (or entities accounted for using the equity method) are initially accounted for in their respective currencies. Subsequently, the monetary balances in foreign currencies are converted to their respective functional currencies using the exchange rate at the close of the financial year. In addition,
- Non-monetary items valued at their historical cost are converted to the functional currency at the exchange rate applicable on the purchase date.
- Non-monetary items valued at their fair value are converted at the exchange rate in force on the date on which such fair value was determined.
- Monetary items are converted to the functional currency at the closing exchange rate.
- Income and expense are converted at the period’s average exchange rates for all the operations carried out during the year. When applying this criterion the BBVA Group considers whether significant variations have taken place in exchange rates during the year which, owing to their impact on the statements as a whole, may require the application of exchange rates as of the date of the transaction instead of such average exchange rates.
The exchange differences produced when converting the balances in foreign currency to the functional currency of the consolidated entities are generally recognized under the heading "Exchange differences, net" in the consolidated income statements (see Note 41). However, the exchange differences in non-monetary items measured at fair value are recorded to equity under the heading “Accumulated other comprehensive income (loss) - Items that will not be reclassified to profit or loss - Fair value changes of equity instruments measured at fair value through other comprehensive income” in the consolidated balance sheets (see Note 30).
Conversion of functional currencies to euros
The balances in the financial statements of consolidated entities whose functional currency is not the euro are converted to euros as follows:
- Assets and liabilities: at the closing spot exchange rates as of the date of each of the consolidated balance sheets.
- Income and expense and cash flows are converted by applying the exchange rate applicable on the date of the transaction, and the average exchange rate for the financial year may be used, unless it has undergone significant variations during the year.
- Equity items: at the historical exchange rates.
The exchange differences arising from the conversion to euros of balances in the functional currencies of the consolidated entities whose functional currency is not the euro are recognized under the heading “Accumulated other comprehensive income (loss) – Items that may be reclassified to profit or loss - Foreign currency translation” in the consolidated balance sheets (Notes 30 and 31 respectively). Meanwhile, the differences arising from the conversion to euros of the financial statements of entities accounted for by the equity method are recognized under the heading “Accumulated other comprehensive income (loss) - Items that may be reclassified to profit or loss - Share of other recognized income and expense of investments in joint ventures and associates" (Note 30), until the item to which they relate is derecognized, at which time they are recognized in the income statement.
The financial statements of companies of hyperinflationary economies are restated for the effects of changes in prices before their conversion to euros following the provisions of IAS 29 "Financial information in hyperinflationary economies" (see Note 2.2.19). Both these adjustments for inflation and the exchange differences that arise when converting the financial statements of companies into hyperinflationary economies are accounted for in “Accumulated other comprehensive income (loss) – Items that may be reclassified to profit or loss - Foreign currency translation”.
The breakdown of the main consolidated balances in foreign currencies, with reference to the most significant foreign currencies, is set forth in Appendix VII.
Venezuela
Local financial statements of the Group subsidiaries in Venezuela are expressed in Venezuelan Bolivar, and converted into euros for the consolidated financial statements. Venezuela is a country with strong exchange restrictions that has different rates officially published, and, since December 31, 2015, the Board of Directors considers that the use of these exchanges rates for converting bolivars into euros in preparing the Consolidated Financial Statements does not reflect the true picture of the financial statements of the Group and the financial position of the Group subsidiaries in this country. Therefore, since the year ended December 31, 2015, the exchange rate for converting bolivars into euros is an estimation taking into account the evolution of the estimated inflation in Venezuela.
As of December 31, 2021, 2020 and 2019, the impact on the consolidated financial statements that would have resulted by applying the last published official exchange rate instead of the exchange rate estimated by BBVA Group was not significant (see Note 2.2.19).
2.2.16 Recognition of income and expense
The most significant policies used by the BBVA Group to recognize its income and expense are as follows.
- Interest income and expense and similar items:
- As a general rule, interest income and expense and similar items are recognized on the basis of their period of accrual using the effective interest rate method.
- They shall be recognized within the consolidated income statement according to the following criteria, independently from the financial instruments’ portfolio which generates the income or expense:
- The interest income past-due before the initial recognition and pending to be received will form part of the gross carrying amount of the debt instrument.
- The interest income accrued after the initial recognition will form part of the gross carrying amount of the debt instrument until it will be received.
- The financial fees and commissions that arise on the arrangement of loans and advances (basically origination and analysis fees) are deferred and recognized in the income statement over the expected life of the loan. From that amount, the transaction costs identified as directly attributable to the arrangement of the loans and advances are deducted. These fees are part of the effective interest rate for the loans and advances.
- Once a debt instrument has been impaired, interest income is recognized applying the effective interest rate used to discount the estimated recoverable cash flows on the carrying amount of the asset.
- Income from dividends received:
- Dividends shall be recognized within the consolidated income statement according to the following criteria, independently from the financial instruments’ portfolio which generates this income:
- When the right to receive payment has been declared before the initial recognition and when the payment is pending to be received, the dividends will not form part of the gross carrying amount of the equity instrument and will not be recognized as income. Those dividends are accounted for as financial assets separately from the net equity instrument.
- If the right to receive payment is received after the initial recognition, the dividends from the net equity instruments will be recognized within the consolidated income statement. If the dividends indubitable to the profits of the issuer before the date of initial recognition, they will not be recognized as income but as reduction of the gross carrying amount of the equity instrument because it represents a partial recuperation of the investment. Amongst other circumstances, the generation date can be considered to be prior to the date of initial recognition if the amounts distributed by the issuer as from the initial recognition are higher than its profits during the same period.
- Commissions, fees and similar items:
- Income and expense relating to commissions and similar fees are recognized in the consolidated income statement using criteria that vary according to the nature of such items. The most significant items in this connection are:
- Those relating to financial assets and liabilities measured at fair value through profit or loss, which are recognized when collected/paid.
- Those arising from transactions or services that are provided over a period of time, which are recognized over the life of these transactions or services.
- Those relating to a singular transaction, which are recognized when this singular transaction is carried out.
- Non-financial income and expense:
- These are recognized for accounting purposes on an accrual basis.
- Deferred collections and payments:
- These are recognized for accounting purposes at the amount resulting from discounting the expected cash flows at market rates.
2.2.17 Sales of assets and income from the provision of non-financial services
The heading “Other operating income” in the consolidated income statements includes the proceeds of the sales of assets and income from the services provided by the Group entities that are not financial institutions. In the case of the Group, these entities are mainly real estate and service entities (see Note 42).
2.2.18 Leases
The lessee accounting model requires the lessee to record assets and liabilities for all lease contracts. A lessee is required to recognize a right-of-use asset representing its right to use the underlying leased asset, which is recorded under the headings ‘‘Tangible assets – Property plants and equipment’’ and ‘‘Tangible assets – Investment properties’’ of the consolidated balance sheet (see Note 17) and a lease liability representing its obligation to make lease payments which is recorded under the heading ‘‘ Financial liabilities at amortized cost – Other financial liabilities’’ in the consolidated balance sheet (see Note 22.5). The standard provides two exceptions for the recognition of lease assets and liabilities that can be applied in the case of short-term contracts and those in which the underlying assets have low value. BBVA elected to apply both exceptions.
At the initial date of the lease, the lease liability represents the present value of all lease unpaid payments. The liabilities registered under this heading of the consolidated balance sheets are measured after their initial recognition at amortized cost, this being determined in accordance with the “effective interest rate” method.
The right to use assets are initially recorded at cost. This cost includes the initial measurement of the lease liability, any payment made on or before the initial date less any lease incentives received, all direct initial expenses incurred, as well as an estimate of the expenses to be incurred by the lessee for dismantling or rehabilitation, such as expenses related to the removal and dismantling of the underlying asset. The right to use assets recorded under this heading of the consolidated balance sheets are measured after their initial recognition at cost less:
- The accumulated depreciation and accumulated impairment.
- Any remeasurement of the lease liability.
The interest expense on the lease liability is recorded in the consolidated income statements under the heading “Interest expense” (see note 37.2). Variable payments not included in the initial measurement of the lease liability are recorded under the heading “Administration costs – Other administrative expense” (see Note 44.2).
Amortization is calculated using the straight-line method over the lifetime of the lease contract, on the basis of the cost of the assets. The tangible asset depreciation charges are recognized in the accompanying consolidated income statements under the heading "Depreciation and Amortization" (see Note 45).
When electing one of the exceptions in order not to recognize the corresponding right to use and the liability in the consolidated balance sheets, payments related to the corresponding lease are recognized in the consolidated income statements, over the contract period, lineally, or in the way that best represents the structure of the lease operation, under the heading "Other operating expense” (see Note 42).
Operating lease and sublease incomes are recognized in the consolidated income statements under the headings “Other operating income” (see Note 42).
As a lessor, lease contracts are classified as finance leases from the inception of the transaction if they substantially transfer all the risks and rewards incidental to ownership of the asset forming the subject-matter of the contract. Leases other than finance leases are classified as operating leases.
When the consolidated entities act as the lessor of an asset under finance leases, the aggregate present values of the lease payments receivable from the lessee plus the guaranteed residual value (normally the exercise price of the lessee’s purchase option on expiration of the lease agreement) are recognized as financing provided to third parties and, therefore, are included under the heading “Loans and advances” in the accompanying consolidated balance sheets (see Note 14).
When the consolidated entities act as lessors of an asset in operating leases, the acquisition cost of the leased assets is recognized under "Tangible assets – Property, plant and equipment – Other assets leased out under an operating lease" in the consolidated balance sheets (see Note 17). These assets are depreciated in line with the criteria adopted for items of tangible assets for own use, while the income arising from the lease arrangements is recognized in the consolidated income statements on a straight-line basis within “Other operating income” and "Other operating expense" (see Note 42).
If a fair value sale and leaseback results in a lease, the profit or loss generated from the effectively transferred part of the sale is recognized in the consolidated income statement at the time of sale (only for the effectively transmitted part).
The assets leased out under operating lease contracts to other entities in the Group are treated in the Consolidated Financial Statements as for own use, and thus rental expense and income is eliminated in consolidation and the corresponding depreciation is recognized.
2.2.19 Entities and branches located in countries with hyperinflationary economies
In accordance with the criteria established in IAS 29 "Financial Reporting in Hyperinflationary Economies”, to determine whether an economy has a high inflation rate the country's economic situation is examined, analyzing whether certain circumstances are fulfilled, such as whether the population prefers to keep its wealth or savings in non-monetary assets or in a relatively stable foreign currency, whether prices can be set in that currency, whether interest rates, wages and prices are pegged to a price index or whether the accumulated inflation rate over three years reaches or exceeds 100%. The fact that any of these circumstances is fulfilled will not be a decisive factor in considering an economy hyperinflationary, but it does provide some reasons to consider it as such.
Argentina
Since 2018, the economy of Argentina has been considered hyperinflationary under the above criteria. As a result, the financial statements of the BBVA Group’s entities located in Argentina have therefore been adjusted to correct for the effects of inflation.
During 2021, 2020 and 2019, the increase in equity of Group entities located in Argentina derived from the re-expression for hyperinflation (IAS 29) amounts to €481, €343 and €470 million, respectively, of which €319, €228 and €313 million, respectively, have been recorded within “Equity – Accumulated other comprehensive income (loss)” and €161, €115 and €157 million, respectively, within “Minority interests – Accumulated other comprehensive income (loss)”. Furthermore, during 2021, 2020 and 2019 the decrease in the reserves of Group entities located in Argentina derived from the conversion to the euro (IAS 21) amounted to €143, €482 and €460 million, respectively, of which €94, €320 and €305 million, respectively, have been recorded within “Equity – Accumulated other comprehensive income (loss)”, and €49, €162 and €155 million, respectively, within “Minority interests – Accumulated other comprehensive income (loss)”. The net impact of both effects is presented under the caption “Other increases or (-) decreases in equity” in the consolidated statement of changes in equity for the years ended December 31, 2021, 2020 and 2019. The net loss in the profit attributable to the parent company of the Group in 2021, 2020 and 2019 derived from the application of IAS 29 amounted to €255, €148 and €190 million, respectively. In addition, there is a net loss in the profit attributable to the parent company of the Group in 2021, 2020 and 2019 derived from the application of IAS 21 which amounted to €3, €26 and €34 million, respectively.
During 2021, 2020 and 2019 the General Price Index (“GPI”) used was 582, 387 and 285 respectively. Likewise, the inflation index at the end of 2021, 2020 and 2019 was 50.7%, 36.5% and 55% respectively.
Venezuela
Since 2009, the economy of Venezuela has been considered hyperinflationary under the above criteria. As a result, the financial statements of the BBVA Group’s entities located in Venezuela have therefore been adjusted to correct for the effects of inflation.
The losses recognized under the heading “Profit attributable to the parent company” in the accompanying consolidated income statement as a result of the adjustment for inflation on net monetary position of the Group entities in Venezuela amounted to €6, €5 and €8 million in 2021, 2020 and 2019, respectively (see Note 2.2.15).
2.3 Recent IFRS pronouncements
Standards and interpretations that became effective in 2021
The following amendments to the IFRS standards or their interpretations (hereinafter “IFRIC” or "interpretation") became effective in 2021.
IFRS 9, IAS 39, IFRS 7, IFRS 4 and IFRS 16 - Modifications - IBOR reform
On August 27, 2020, the IASB issued the second phase of the reform of the IBOR reference indices, which involves the introduction of amendments to IFRS 9, IAS 39, IFRS 7, IFRS 4 and IFRS 16, to ensure that the financial statements reflect the economic effects of this reform in the best possible way. These amendments focus on the accounting for financial instruments, once a new risk-free reference index (Risk Free Rate, hereinafter “RFR”) has been introduced.
The modifications introduce the accounting relief for changes in the cash flows of financial instruments directly caused by the IBOR reform if they take place in a context of "economic equivalence", by updating the effective interest rate of the instrument. Additionally, they introduce a series of exemptions to the hedging requirements so as not to have to interrupt certain hedging relationships. However, similar to the phase 1 amendments (which entered into force already in 2020) (see Note 15), the phase 2 amendments do not contemplate exceptions to the valuation requirements applicable to hedged items and hedging instruments in accordance with IFRS 9 or IAS 39. Thus, once the new reference index has been implemented, the hedged items and hedging instruments must be valued in accordance with the new index, and the possible ineffectiveness that may exist in the hedge will be recognized in profit or loss.
The IBOR transition to RFR is considered to be a complex initiative, which affects BBVA Group in different geographical areas and business lines, as well as in a multitude of products, systems and processes. The main risks to which the Group is exposed due to the transition are; (1) risk of litigation related to the products and services offered by the Group; (2) legal risks derived from changes in the documentation required for existing operations; (3) financial and accounting risks, derived from market risk models and from the measurement, hedging, cancellation and recognition of the financial instruments associated with the benchmark indices; (4) price risk, derived from how changes in the indices could impact the pricing mechanisms of certain instruments; (5) operational risks, as the reform may require changes to the Group's IT systems, business reporting infrastructure, operational processes and controls, and (6) behavioral risks derived from the potential impact of customer communications during the transition period, which could lead to customer complaints, regulatory penalties or reputational impact.
BBVA Group established a transition program, provided with a robust governance structure by means of an Executive Steering Committee, with representation from senior management of the affected areas, which reports directly to the Group's Global Leadership Team. At the local level, each geography has defined its own governance structure with the participation of senior management. The coordination between geographies is realized through the Project Management Office (PMO) and the Global Working Groups that incorporate a multi-geographic and transversal view on the areas of Legal, Risk, Regulatory, Finance and Accounting and Engineering. The project also involves both Corporate Assurance of the different geographies and business lines and Global Corporate Assurance of the Group.
This transition project has taken into account the different approaches and periods of transition to the new RFRs when evaluating the various risks associated with the transition, as well as defining the lines of action in order to mitigate them. BBVA is aligned with the Good Practices issued by the ECB that outline how banks can better structure their governance, identify related risks and create contingent action plans and documentation in relation to the transition of reference rates.
During 2021, the BBVA Group has worked to modify all its contracts referenced to EONIA and LIBOR EUR, CHF, GBP, JPY and USD (one-week and two-month maturity) to the corresponding RFRs. As of December 31, 2021, the Group continues to hold financial assets and liabilities whose contracts are referenced to IBOR rates, mainly EURIBOR and LIBOR USD, as they are used, among others, for loans, deposits and debt issues as well as underlying derivative financial instruments.
In the case of EONIA, during 2021 the BBVA Group carried out a novation of most of the contracts expiring after the end of 2021, migrated the balances against clearing houses and renegotiated collateral contracts, replacing that index with the € STR.
In the case of the EURIBOR, the European authorities have encouraged modifications in its methodology so that it meets the requirements of the European Regulation of Reference Indices, so this index does not disappear.
The official discontinuation date for LIBORs exUSD (GBP, CHF, EUR, JPY), USD LIBOR 1-week and 2-month indices was December 31, 2021, and for EONIA was January 3, 2022. However, the Financial Conduct Authority (FCA) and the European Commission have established a legal safeguard in the event that there are some operations that could not be migrated before said discontinuation date. In the case of the FCA, said legal safeguard, called Synthetic LIBOR, would apply only to contracts referenced to LIBOR GBP and LIBOR JPY in terms of 1, 3 and 6 months, and allows the index to continue to be applied for an additional period. Moreover, the European Commission, through what is known as the Statutory Fallback, provides a legal safeguard for EONIA contracts and for LIBOR CHF (into force on January 1, 2022), so that in the contracts subject to this measure, said indices are automatically replaced and by legal requirement, by the substitute indices identified in the standard.
The entity has actively collaborated in the IBOR transition, both for its support and participation in the sectorial working groups and for its commitment to remediate the contracts with its counterparties. In this sense, the entity has carried out a process of communication and contact with the counterparties to modify the terms of the contractual relations in such a way that said agreements have been modified using different mechanisms: through the inclusion of addenda to the contracts, by the adherence to industry standard protocols, the transition of operations by clearing house, the cancellation of contracts and subscription of new ones, or by the transition through other legislative mechanisms.
This process has been managed through the monitoring mechanisms and indicators that have been developed by the working groups within the Group. The process will remain active for the management of the transition of the USD (for the rest of the affected terms in June 2023), the transition of other currencies and those contracts that, to a lesser extent, have been referenced to the proposed synthetic solution by the FCA, as this is a temporary measure. Likewise, work continues to adapt all systems and processes in the treatment of alternative RFR indices, such as SOFR and SONIA.
Below is the BBVA Group's exposure to financial assets and liabilities maturing after the transition dates of these IBORs to their corresponding RFRs. At the end of the year, thanks to efforts in remediation of contracts, the BBVA Group has robust transition fallbacks or a synthetic or statutory solution for all operations with EONIA and LIBOR EUR, CHF, GBP, JPY and USD (for terms of one week and two months) pending transition as of December 31, 2021. The table shows the gross amounts in the case of loans and advances to customers, asset and liability debt instruments, and deposits and, in the case of derivatives, their notional value is shown:
Millions of Euros
| Loans & Advances | Debt Securities Assets | Debt Securities Issued (Liabilities) | Deposits | Derivatives (notional) | |
|---|---|---|---|---|---|
| EONIA with maturity > December 31, 2021 | 59 | — | — | 371 | 7,079 |
| LIBOR ex USD & LIBOR USD 1W/2M with maturity > December 31, 2021 | 1,568 | — | 243 | 846 | 27,343 |
| LIBOR USD with maturity > June 30, 2023 | 21,256 | 158 | 1,974 | 2,015 | 474,701 |
| Total | 22,883 | 158 | 2,217 | 3,232 | 509,122 |
(*) Equilibrium Interbank Interest Rate used in Mexico.
It should be noted that all of these exposures (with the exception of USD LIBOR for terms other than one week and two months) change their references effectively, and with the mechanisms described above, since January 1, 2022, depending on the next interest rate fixes.
83.76% of the amount of derivatives referenced to LIBOR EUR, CHF, GBP, JPY and USD (for terms of one week and two months) corresponds to operations through a clearing house.
Amendments to IFRS 4 – Insurance Contracts
The amendment to IFRS 4 includes a deferral in the temporary exception option regarding the application of IFRS 9 for entities whose business model is predominantly an insurance model until January 1, 2023, aligning it with the entry into force of the IFRS 17 Insurance Contracts rule. This modification is applicable from January 1, 2021, although it will not have an impact on the Group since the Group will not take such option.
Modification of IFRS 16 – Leases: practical exemption for lessees due to the COVID-19 pandemic.
The IASB has extended the term to qualify for the exemption that allows tenants not to register concessions in rents as a modification of the lease if they are a direct consequence of COVID-19. This exemption has not had an impact on the Group since the Bank has not received concessions on its rents as a result of COVID-19.
The application of the exemption will remain optional and applies to rent concessions made until June 30, 2022.
Standards and interpretations issued but not yet effective as of December 31, 2021
The following new International Financial Reporting Standards together with their Interpretations had been published at the date of preparation of the accompanying consolidated financial statements, but are not mandatory as of December 31, 2021. Although in some cases the IASB allows early adoption before their effective date, the BBVA Group has not proceeded with this option for any such new standards.
IFRS 17 – Insurance Contracts
In May 2017, the IASB issued the new accounting standard for insurance contracts, which was later amended in June 2020, with the aim of helping entities in the implementation of the standard and to facilitate the understanding of the financial statements, although the amendment maintained the fundamental principles of the original standard. An entity shall apply IFRS 17 for annual reporting periods beginning on or after January 1, 2023 (with at least one year of comparative information). The standard has already been adopted by the European Union.
IFRS 17 establishes the accounting principles for insurance contracts. This new standard supersedes IFRS 4, by introducing substantial changes in the accounting of insurance contracts with the aim of achieving greater homogeneity and increasing comparability among entities.
Unlike IFRS 4, the new standard establishes minimum requirements for grouping insurance contracts for the purposes of their recognition and measurement, determining the units of account by considering three levels: portfolios (contracts subject to similar risks and managed together), annual cohorts and their possibility of becoming onerous.
Regarding the measurement model, the new standard contemplates several methods, being the General Model (Building Block Approach) the method that will be applied by default for the valuation of insurance contracts, unless the conditions are given to apply any of the two other methods: the Variable Fee Approach, and the Simplified Model (Premium Allocation Approach).
With the implementation of IFRS 17, the valuation of insurance contracts will be based on a model that will use updated assumptions at each balance sheet date.
The General Model requires entities to value insurance contracts for the total of:
- fulfillment cash flows, which comprise the estimation of future cash flows discounted to reflect the time value of money, the financial risk associated with future cash flows, and a risk adjustment for non-financial risk;
- and the contractual service margin, which represents the expected unearned benefit from the insurance contracts, which will be recognized in the entity’s income statement as the service is provided in the future, instead of being recognized at the time of the estimation.
The amounts recognized in the income statement shall be classified into insurance revenue, insurance service expenses and insurance finance income or expenses. Insurance revenue and insurance service expenses shall exclude any investment components. Insurance revenue shall be recognized over the period the entity provides insurance coverage.
Since 2019, the Group has been developing a project to implement IFRS 17 in order to harmonize the criteria in the Group and with the participation of all involved areas and countries. A sound governance has been established in this project, through a Steering Committee with representation from the senior management of the affected areas, which periodically reviews its progress. At the local level, each geography has defined a local governance structure with the participation of senior management.
The Group continues with the planned roadmap for the implementation of the standard, progressing during the years 2019, 2020 and 2021 with the definition of criteria, the actuarial modelling of cash flows and components required by the standard, the data supply, the systems technological adaptation, the preparation of accounting information, the governance of the reporting process to the Group and the development of the transition.
In 2022, the assessment of the transition impact on the Group's financial statements will be completed, and the Group will carry out parallel accounting under both existing standards and IFRS 17. Initially, the Group considers that, if applicable, the quantitative impact of the transition would come from long-term products, mainly motivated by the identification of products that are classified as "onerous". Additionally, differences could arise in other comprehensive income caused by the method of calculation of insurance liabilities provided in IFRS 17, which is based on the difference in valuation of insurance liabilities between the discount rates at inception (locked-in) and the closing rates.
Amendments to IAS 1 “Presentation of financial statements” and IAS 8 “Accounting policies, changes in accounting estimates and errors"
In February 2021 the IASB issued amendments to this IAS with the aim of improving the quality of the disclosures in relation to the accounting policies applied by the entities with the ultimate aim of providing useful and material information in the financial statements.
The amendments to IAS 1 require companies to disclose their material accounting policy information rather than their significant accounting policies and include guidance on how to apply the concept of materiality to accounting policy disclosures. The amendments to IAS 8 also clarify how companies should distinguish changes in accounting policies from changes in accounting estimates. The amendments will be effective for annual reporting periods beginning on or after January 1, 2023. No significant impact is expected on BBVA's consolidated financial statements.
Amendment IAS 12 – Income taxes
The IASB has issued an amendment to IAS 12 that clarifies how companies recognize deferred tax on transactions such as leases and decommissioning obligations.
The amendments conclude that entities should recognize deferred taxes on leases and dismantling provisions following the criteria established in IAS 12. The aim of the amendments is to reduce diversity in the reporting of deferred tax on leases and decommissioning obligations. The amendments will be effective for annual reporting periods beginning on or after January 1, 2023, with early application permitted. No significant impact is expected on the BBVA Group´s consolidated financial statements.
Minor changes to IFRS Standards (IFRS 3 Business Combinations, IAS 16 Property, Plant and Equipment, IAS 37 Provisions) and Annual Improvements to IFRS 2018-2020 (IFRS 1 - First application of IFRS, IFRS 9 Financial Instruments, IAS 41 Agriculture and modifications to the illustrative examples of IFRS 16 - Leases)
The IASB has issued minor amendments and improvements to various IFRSs to clarify the wording or correct minor consequences, oversights or conflicts between the requirements of the Standards. The modified standards are: IFRS 3 Business Combination, IAS 16 Property, Plant and Equipment, IAS 37 Provisions, IAS 1 First application of IFRS, IFRS 9 Financial Instruments, IAS 41 Agriculture and IFRS 16 Leases (modifications to the illustrative examples)
The amendments will be effective for annual reporting periods beginning on or after January 1, 2022. No significant impact is expected on the BBVA Group's consolidated financial statements.
3. BBVA Group
The BBVA Group is an international diversified financial group with a significant presence in retail banking, wholesale banking and asset management. The Group also operates in the insurance sector.
The following information is detailed in the appendices of these consolidated financial statements of the Group for the year ended December 31, 2021:
- Appendix I shows relevant information related to the consolidated subsidiaries and structured entities.
- Appendix II shows relevant information related to investments in joint ventures and associates accounted for using the equity method.
- Appendix III shows the main changes and notification of investments and divestments in the BBVA Group.
- Appendix IV shows fully consolidated subsidiaries with more than 10% owned by non-Group shareholders.
The following table sets forth information related to the Group’s total assets as of December 31, 2021, 2020 and 2019, broken down by the Group’s entities according to their activity:
Contribution to Consolidated Group total assets. Entities by main activities (Millions of Euros)
| 2021 | 2020 | 2019 | |
|---|---|---|---|
| Banking and other financial services | 631,683 | 703,304 | 664,100 |
| Insurance and pension fund managing companies | 29,657 | 28,667 | 29,300 |
| Other non-financial services | 1,545 | 1,826 | 2,071 |
| Total | 662,885 | 733,797 | 695,471 |
The total assets and results of operations broken down by operating segments are included in Note 6.
The BBVA Group’s activities are mainly located in Spain, Mexico, South America and Turkey, with active presence in the rest of Europe, the United States and Asia:
- Spain. The Group’s activity in Spain is mainly carried out through Banco Bilbao Vizcaya Argentaria, S.A. The Group also has other entities that mainly operate in Spain’s banking sector and insurance sector.
- Mexico. The BBVA Group operates in Mexico, not only in the banking sector, but also in the insurance sector through BBVA Mexico.
- South America. The BBVA Group’s activities in South America are mainly focused on the banking, financial and insurance sectors, in the following countries: Argentina, Colombia, Peru, Uruguay and Chile. It has a representative office in Sao Paulo (Brazil). The Group owns more than 50% of most of the entities based in these countries. Appendix I shows a list of the entities which, although less than 50% owned by the BBVA Group as of December 31, 2021, are consolidated (see Note 2.1).
- Turkey. The Group’s activity in Turkey is mainly carried out through the Garanti BBVA Group.
- Rest of Europe. Group's activity in Europe (excluding Spain) is carried out by banking and financial institutions, mainly in Switzerland, Italy, Germany, the Netherlands and Romania and the Bank's branches in Germany, Belgium, France, Italy, Portugal and the United Kingdom.
- United States. The Group's activity in the United States is mainly carried out by the branch of Banco Bilbao Vizcaya Argentaria, S.A. in New York, the Branch of BBVA Mexico in Houston, participations in technology companies through funds and investment vehicles, including the venture capital fund Propel Venture Partners, the broker-dealer business BBVA Securities Inc., and a representative office in Silicon Valley (California).
- Asia. The Group's activity in Asia is conducted through the Bank's branches (Taipei, Tokyo, Hong Kong, Singapore and Shanghai) and representative offices (Beijing, Seoul, Mumbai, Abu Dhabi and Jakarta).
Significant transactions in the Group in 2021
Voluntary takeover bid for the entire share capital of Türkiye Garanti Bankası A.Ş (Garanti).
On November 15, 2021, BBVA announced a voluntary takeover bid addressed to the holders of the 2,106,300,000 shares1 not controlled by BBVA, representing 50.15% of Garanti's total share capital. BBVA submitted for authorization an application of the voluntary takeover bid to the Capital Markets Board of Turkey (CMB) on November 18, 2021.
The consideration offered by BBVA to Garanti shareholders is 12.20 Turkish Liras in cash for each share. The maximum amount payable by BBVA will be 25,697 million Turkish Liras (equivalent to approximately €1,690 million at an exchange rate of 15.23 Turkish Liras per Euro estimated as of December 31, 2021) assuming all of Garanti's shareholders sell their shares. BBVA will pay the consideration with its current shareholder's funds. BBVA reserves the right to reduce or otherwise modify the voluntary takeover bid price by an amount equal to the gross amount of the distribution per share, if Garanti declares or distributes dividends, reserves or any other kind of distribution to its shareholders at any time from the date of the announcement on November 15, 2021 until the day of completion of the voluntary takeover bid. BBVA may cancel the takeover bid at any time before the commencement of the acceptance period.
The acquisition by BBVA of more than 50% of Garanti's total share capital is subject to the prior approval of several authorities, both in Turkey and in other jurisdictions. BBVA will disclose to the market when all relevant authorizations are obtained. BBVA has received confirmation from the CMB that it will not formally approve the voluntary takeover bid application until the CMB receives confirmation from BBVA that all relevant approvals required by BBVA have been duly obtained. Only after approval by the CMB of the voluntary takeover bid application will the voluntary takeover bid period begin.
The estimated impact will depend on the percentage of shares that are tendered. As of December 31, 2021, BBVA estimated maximum impact of minus 32 basis points in the Common Equity Tier 1 fully loaded ratio and approximately 2% accretion to its book value per share2, (all the above assuming that all Garanti shareholders accept the offer).
1 All references to “shares” or “share” shall be deemed made to lots of 100 shares, which is the trading unit at Borsa Istanbul.
2 The calculation of the impact on Common Equity Tier 1 and tangible book value per share was made taking into consideration the consolidated Group’s financial statements as of December 31, 2021, and an exchange rate of 15.23 Turkish Lira per Euro. The impact on CET1 and the tangible book value per share may be different from the date of this disclosure up to the date of closing of the Voluntary Takeover Bid due to, among other circumstances, changes in the book value of Garanti and changes in the Turkish Lira/Euro exchange rate.
Divestitures
Sale of BBVA’s U.S. subsidiary to PNC Financial Service Group
On June 1 2021, after obtaining all the required authorizations, BBVA completed the sale to The PNC Financial Services Group, Inc. of 100% of the capital stock of its subsidiary BBVA USA Bancshares, Inc., which in turn owned all the capital stock of the bank, BBVA USA.
The consideration received in cash by BBVA amounted to approximately 11,500 million USD (price provided in the agreement minus the agreed closing price adjustments) equivalent to approximately €9,600 million (with an exchange rate of 1.20 EUR / USD).
The accounting of both the results generated by BBVA USA Bancshares since the announcement of the transaction and the closing of its sale has had an aggregate positive impact on the BBVA Group's Common Equity Tier 1 ("fully loaded") ratio of approximately 294 basis points, which includes the generation of capital contributed by the subsidiary to the Group until the closing of the transaction (on June 1, 2021) and a profit net of taxes of €582 million. As a result thereof, the BBVA Group has been reflecting the results that BBVA USA Bancshares, Inc. has been generating, as well as the positive impact, mainly, of these results on the Common Equity Tier 1 ("fully loaded") ratio of BBVA Group. The calculation of the impact on Common Equity Tier 1 has been made taking into account the amount of the transaction in euros and BBVA Group's financial statements as of June 2021.
The BBVA Group continues to develop an institutional and wholesale business in the United States that it currently carries out through its broker-dealer BBVA Securities Inc. and the New York branch. BBVA also maintains its investment activity in the fintech sector through its participation in Propel Venture Partners US Fund I, L.P.
Note 21 shows a breakdown of the financial information of the companies sold in the United States as of December 31, 2021, 2020 and 2019 and the results of those companies as of and for the first five months of 2021 and the years ended 2020 and 2019.
Sale of the BBVA Group's stake in Paraguay
On January 22, 2021, once the mandatory authorizations were obtained, BBVA completed the sale of its direct and indirect shareholding of 100% of the capital stock of Banco Bilbao Vizcaya Argentaria Paraguay, S.A. (“BBVA Paraguay”) to Banco GNB Paraguay S.A., a subsidiary of the Gilinski Group. This transaction was originally agreed in 2019. The total amount received by BBVA amounted to approximately USD 250 million (approximately €210 million). The transaction generated a capital loss net of taxes of approximately €9 million. This transaction had a positive impact on the Common Equity Tier 1 (fully loaded) of the BBVA Group of approximately 6 basis points, which is reflected in the capital base of the BBVA Group in the fiscal year 2021.
Significant transactions in the Group in 2020
Divestitures
Alliance with Allianz, Compañía de Seguros y Reaseguros, S.A.
On April 27, 2020, BBVA reached an agreement with Allianz, Compañía de Seguros y Reaseguros, S.A. to create a bancassurance joint venture in order to develop the non-life insurance business in Spain, excluding the health insurance line of the business.
On December 14, 2020, once the required authorizations had been obtained, BBVA completed the operation and announced the transfer to Allianz, Compañía de Seguros y Reaseguros, S.A. of half plus one share of the company BBVA Allianz Seguros y Reaseguros, S.A., for which it received €274 million, without taking into account a variable part of the price (up to €100 million depending on certain objectives and planned milestones). This operation resulted in a profit net of taxes of €304 million and a positive impact on the fully loaded CET1 of the BBVA Group of 7 basis points, recorded in the Consolidated Financial Statements for the year ended December 31, 2020.
4. Shareholder remuneration system
Cash Dividends in financial years 2019 and 2020
Throughout 2019 and 2020, BBVA's Board of Directors approved the payment of the following dividends (interim or final dividends) fully in cash, recorded in "Total Equity- Interim Dividends" and "Total Equity - Retained earnings" of the consolidated balance sheet of the relevant year:
- The Annual General Meeting of BBVA held on March 15, 2019, approved, under item 1 of the Agenda, the payment of a final dividend for 2018, in addition to other dividends previously paid, in cash for an amount equal to €0.16 (€0.1296 net of withholding tax) per BBVA share. The total amount paid to shareholders on April 10, 2019, after deducting treasury shares held by the Group's Companies, amounted to €1,064 million and is recognized under the heading "Total equity- Retained earnings" of the consolidated balance sheet as of December 31, 2019.
- The Board of Directors, at its meeting held on October 2, 2019, approved the payment in cash of €0.10 (€0.081 net of withholding tax) per BBVA share, as gross interim dividend based on 2019 results. The total amount paid to shareholders on October 15, 2019, after deducting treasury shares held by the Group's companies, amounted to €665 million and is recognized under the heading "Total equity- Interim dividends" of the consolidated balance sheet as of December 31, 2019.
- The Annual General Meeting of BBVA held on March 13, 2020, approved, under item 1 of the Agenda, the payment of a final dividend for 2019, in addition to other dividends previously paid, in cash for an amount equal to €0.16 (€0.1296 net of withholding tax) per BBVA share. The total amount paid to shareholders on April 9, 2020, after deducting treasury shares held by the Group's Companies, amounted to €1,065 million and is recognized under the heading "Total equity- Retained earnings" of the consolidated balance sheet as of December 31, 2020.
ECB recommendations for 2020
In accordance with recommendation ECB/2020/19 issued by the ECB on March 27, 2020 on dividend distributions during the COVID-19 pandemic, the Board of Directors of BBVA resolved to modify for the financial year corresponding to 2020 the dividend policy of the Group, announced on February 1, 2017, determining as new policy for 2020 not to pay any dividend amount corresponding to 2020 until the uncertainties caused by COVID-19 disappear and, in any case, not before the end of such fiscal year. On July 27, 2020, the ECB prolonged this recommendation until January 1, 2021 by adopting recommendation ECB/2020/35.
On December 15, 2020 the ECB issued recommendation ECB/2020/62, repealing recommendation ECB/2020/35 and recommending that significant credit institutions exercise extreme prudence when deciding on or paying out dividends or performing share buy-backs aimed at remunerating shareholders.
Shareholder remuneration during financial year 2021
BBVA notified on January 29, 2021, by means of Privileged Information, that it intended to resume its shareholder remuneration policy in 2021, announced on February 1, 2017, via Relevant Event, contingent upon the repealing of recommendation ECB/2020/62 and the absence of further restrictions or limitations.
The Annual General Meeting held on April 20, 2021 approved, in the third item of its agenda, a cash distribution from the issue premium account of €0.059 per share as shareholder remuneration in respect of the Group’s 2020 earnings for each of the Bank's outstanding shares, all this in compliance with recommendation ECB/2020/62, which was paid on April 29, 2021. The total amount was €393 million and was recognized under the heading “Total Equity – Share Premium” of the consolidated balance sheet as of December 31, 2021 (see Note 27).
On July 23, 2021, the European Central Bank published the approval of recommendation ECB/2021/31 repealing recommendation ECB/2020/62 from September 30, 2021, whereby the ECB indicated that it would assess capital, dividend distribution and share buyback plans of each financial institution in the context of their ordinary supervisory process, eliminating the remaining restrictions on dividend and share buyback related matters established in recommendation ECB/2020/62.
In keeping with the above, the Board of Directors, at its meeting held on September 30, 2021, approved the payment in cash of €0.08 (€0.0648 net of withholding tax) per BBVA share, as gross interim dividend against 2021 results. The total amount paid to shareholders on October 12, 2021, after deducting treasury shares held by the Group's companies, amounted to €532 million and is recognized under the heading "Shareholder’s funds - Total equity- Interim dividends" of the consolidated balance sheet as of December 31, 2021.
The forecasted financial statement, drawn up in compliance with the applicable legal requirements, which evidenced the existence of sufficient liquidity to distribute the abovementioned amount approved on September 29, 2021 was the following:
Available amount for interim dividend payments (Millions of Euros)
| August 31, 2021 | |
|---|---|
| Profit of BBVA, S.A., after the provision for income tax | 934 |
| Maximum amount distributable | 934 |
| Amount of proposed interim dividend | 533 |
| BBVA cash balance available to the date | 31,887 |
Other shareholder remuneration
On February 3, 2022, it was announced that a cash distribution in the amount of €0.23 gross per share as shareholder remuneration in relation to the Group's result in the 2021 financial year was expected to be submitted to the relevant governing bodies of BBVA for consideration (see Note 56).
Share buyback program
On October 26, 2021, BBVA obtained the pertinent authorization from the European Central Bank to buy back up to 10% of its share capital for a maximum of €3.5 billion, in one or several tranches and over the course of a 12-month period (the “Authorization”).
Upon receiving the authorization and making use of the delegation conferred by the BBVA Annual General Meeting held on March 16, 2018, at its meeting of October 28, 2021, BBVA Board of Directors resolved to carry out a framework share buyback program in compliance with Regulation (EU) no. 596/2014 of the European Parliament and the Council of April 16, 2014 on market abuse and Delegate Regulation (EU) no. 2016/1052 of the Commission, of March 8, 2016, to be executed in various tranches up to a maximum of €3.5 billion, with the aim of reducing BBVA's share capital (the “Framework Program”), notwithstanding the possibility of terminating or cancelling the Framework Program at an earlier date where advisable due to the concurrence of a series of specific circumstances, as well as to carry out a first share buyback program within the Framework Program (the "First Tranche"), which was notified as Privileged Information on October 29, 2021.
On November 19, BBVA notified by means of Privileged Information that the First Tranche would be executed externally through J.P. Morgan AG as manager, for a maximum amount of €1,500 million, for the purchase of a maximum number of shares of 637,770,016 representing, approximately, 9.6% of BBVA's share capital as of the date of the agreement, and that the first program would begin on November 22, 2021, and that it would conclude not earlier than November 22, 2021 or later than April 5, 2022, and, in any case, whenever, within said timeframe the maximum monetary amount is reached, or the maximum number of shares is purchased.
Between November 22 and December 31, 2021, J.P. Morgan AG, as manager of the First Tranche, acquired 112,254,236 BBVA shares (see Note 29). Between January 1 and February 3, 2022, J.P. Morgan AG has acquired 65,272,189 BBVA shares.
On February 3, 2022, BBVA announced that its Board of Directors agreed, within the Framework Program, to carry out a second buyback program (the “Second Tranche”) aimed at reducing BBVA’s share capital, for a maximum amount of €2,000 million and a maximum number of shares to be acquired equal to the result of subtracting from 637,770,016 own shares (9.6% of BBVA’s share capital at that date) the number of own shares finally acquired in execution of the First Tranche. The implementation of the Second Tranche, which will also be executed externally through a lead-manager, will begin after the end of the implementation of the First Tranche and shall end no later than October 15, 2022 (see Note 56).
Amendment of Shareholder Remuneration Policy
On November 18, 2021, BBVA announced that the Board of Directors of BBVA agreed to modify the Group’s shareholder distribution policy, which was communicated as relevant information on February 1, 2017, with registration number 247679 establishing a new policy consisting in an annual distribution of between 40% and 50% of the consolidated ordinary profit of each year (excluding extraordinary amounts and items included in the consolidated profit and loss account), compared to the previous policy of distributing between 35% and 40%.
This policy will be implemented through the distribution of an interim dividend for the year (expected to be paid in October of each year) and a final dividend (to be paid once the year has ended and the allocation of the year-end profit has been approved, expected to take place in April of each year), with the possibility of combining cash distributions with share buybacks (the execution of the share buyback program will be deemed an extraordinary shareholder remuneration and will, therefore, not be included within the scope of the policy), all subject to the relevant authorizations and approvals applicable at any given time.
Proposal on allocation of earnings for 2021
Below is included a breakdown of the distribution of the Bank's earnings for financial year 2021, which the Board of Directors will submit to the Annual General Meeting for approval.
Allocation of earnings (Millions of Euros)
| 2021 | |
|---|---|
| Profit (loss) for year | 1,080 |
| Distribution | |
| Interim dividends | 533 |
| Reserves / Accumulated gains | 547 |
5. Earnings per share
Basic and diluted earnings per share are calculated in accordance with the criteria established by IAS 33. For more information see Glossary.
The calculation of earnings per share is as follows:
Basic and Diluted Earnings per Share
| 2021 | 2020 (**) | 2019 | |
|---|---|---|---|
| Numerator for basic and diluted earnings per share (millions of euros) | |||
| Profit attributable to parent company | 4,653 | 1,305 | 3,512 |
| Adjustment: Additional Tier 1 securities (*) | (359) | (387) | (419) |
| Profit adjusted (millions of euros) (A) | 4,293 | 917 | 3,093 |
| Profit (loss) from continued operations (net of remuneration of Additional Tier 1 capital instruments) | 4,014 | 2,646 | 3,851 |
| Profit (loss) from discontinued operations (net of non-controlling interest) (B) (See Note 21) | 280 | (1,729) | (758) |
| Denominator for basic earnings per share (number of shares outstanding) | — | — | — |
| Weighted average number of shares outstanding (**) | 6,668 | 6,668 | 6,668 |
| Average treasury shares | (12) | (13) | (20) |
| Share buyback program (***) | (255) | — | — |
| Adjusted number of shares - Basic earnings per share (C) | 6,401 | 6,655 | 6,648 |
| Adjusted number of shares - diluted earnings per share (D) | 6,401 | 6,655 | 6,648 |
| Earnings (losses) per share (****) | 0.67 | 0.14 | 0.47 |
| Basic earnings (losses) per share from continuing operations (Euros per share)A-B/C | 0.63 | 0.40 | 0.58 |
| Diluted earnings (losses) per share from continuing operations (Euros per share)A-B/D | 0.63 | 0.40 | 0.58 |
| Basic earnings (losses) per share from discontinued operations (Euros per share)B/C | 0.04 | (0.26) | (0.11) |
| Diluted earnings (losses) per share from discontinued operations (Euros per share)B/D | 0.04 | (0.26) | (0.11) |
(*) Remuneration in the year related to contingent convertible securities, recognized in equity (see Note 22.4).
(**) Weighted average number of shares outstanding (millions of euros), excluding weighted average of treasury shares during the year.
(***) Consists of 112 million shares acquired between November 22 and December 31, 2021, by J.P. Morgan AG, as manager of the first tranche of the shares buyback program approved by the Board of Directors in October 2021 (€1,500 million); and the estimated number of shares pending to be acquired under such tranche as of December 31, 2021 (see Note 4)
(****) In 2021, 2020 and 2019 the weighted average number of shares outstanding was 6,668 million. The adjustment of additional Tier 1 securities amounted to €359, €387 and €419 million in 2021, 2020 and 2019, respectively.
As of December 31, 2021, 2020 and 2019, there were no other financial instruments or share option commitments to employees that could potentially affect the calculation of the diluted earnings per share for the years presented. For this reason, basic and diluted earnings per share are the same.
6. Operating segment reporting
Operating segment reporting represents a basic tool in the oversight and management of the BBVA Group’s various activities. The BBVA Group compiles reporting information on disaggregated business activities. These business activities are then aggregated in accordance with the organizational structure determined by the BBVA Group and, ultimately, into the reportable operating segments themselves.
As of December 31, 2021 the structure of the information by operating segments reported by the BBVA Group differs from that presented at the end of the 2020 financial year, mainly as a consequence of the exclusion of the United States as an operating segment, as a result of the sale agreement reached with PNC and the completion of the transaction (see Note 3). Most of the businesses in the United States excluded from this agreement, together with those of the former operating segment “Rest of Eurasia” (which has been eliminated) constitute a new operating segment called “Rest of Business”.
The BBVA Group's operating segments as of December 31, 2021 are summarized below:
- Spain
- Includes mainly the banking and insurance business that the Group carries out in Spain, including the results of the new company BBVA Allianz Seguros y Reaseguros, S.A. (see Note 3).
- Mexico
- Includes banking and insurance businesses in this country as well as the activity of BBVA Mexico in Houston.
- Turkey
- Includes the activity of Garanti BBVA group that is mainly carried out in this country and, to a lesser extent, in Romania and the Netherlands.
- South America
- Primarily includes the Group´s banking and insurance businesses in the region. With respect to the sale of BBVA Paraguay, the closing of the transaction took place in January 2021 (see Note 3).
- Rest of Business
- Mainly includes the wholesale activity carried out in Europe (excluding Spain), and the United States through to the New York branch, as well as the institutional business that the Group develops in the United States through its broker-dealer BBVA Securities Inc. It also includes the banking business developed through the five BBVA branches located in Asia.
Lastly, Corporate Center performs centralized Group functions, including: the costs of the head offices with a corporate function; management of structural exchange rate positions; portfolios whose management is not linked to customer relationships, such as financial and industrial holdings; stakes in Funds & Investment Vehicles in tech companies including the stake in the venture capital fund Propel Venture Partners; certain tax assets and liabilities; funds for employee commitments; goodwill and other intangible assets, as well as the financing of such portfolios and assets. Additionally, the results obtained by the Group's businesses in the United States until completion of the sale to PNC on June 1, 2021 (see Note 21), are presented in a single line under the heading "Profit (loss) after tax from discontinued operations" in the consolidated income statement and in the income statement of the Corporate Center. Finally, the costs related to the Banco Bilbao Vizcaya Argentaria, S.A. restructuring process in Spain, which process is considered to be a strategic decision, are registered in the lines "Provisions", "Provisions or reversal of provisions", "Impairment or reversal of impairment on non-financial assets" and "Gains (losses) from non-current assets and disposal groups classified as held for sale not qualifying as discontinued operations" (see Notes 24, 46, 49 and 50).
The breakdown of the BBVA Group’s total assets by operating segments as of December 31, 2021, 2020 and 2019, is as follows:
Total Group assets by operating segments (Millions of Euros)
| 2021 | 2020 (*) | 2019 (*) | |
|---|---|---|---|
| Spain | 413,477 | 408,030 | 367,678 |
| Mexico | 118,106 | 110,236 | 109,087 |
| Turkey | 56,245 | 59,585 | 64,416 |
| South America | 56,124 | 55,436 | 54,996 |
| Rest of Business | 40,314 | 35,172 | 32,891 |
| Subtotal assets by operating segments | 684,266 | 668,460 | 629,068 |
| Corporate Center and adjustments | (21,381) | 65,336 | 66,403 |
| Total assets BBVA Group | 662,885 | 733,797 | 695,471 |
(*) The figures corresponding to 2020 and 2019 have been restated.
The following table sets forth certain summarized information relating to results of each operating segment and Corporate Center for the years ended December 31, 2021, 2020 and 2019:
Main margins and profit by operating segments (Millions of euros)
| Operating Segments | |||||||
|---|---|---|---|---|---|---|---|
| BBVA Group | Spain | Mexico | Turkey | South America | Rest of Business | Corporate Center | |
| 2021 | |||||||
| Net interest income | 14,686 | 3,502 | 5,836 | 2,370 | 2,859 | 281 | (163) |
| Gross income | 21,066 | 5,925 | 7,603 | 3,422 | 3,162 | 741 | 212 |
| Operating income | 11,536 | 2,895 | 4,944 | 2,414 | 1,661 | 291 | (668) |
| Operating profit (loss) before tax | 7,247 | 2,122 | 3,528 | 1,953 | 961 | 314 | (1,632) |
| Profit (loss) after tax from discontinued operations | 280 | — | — | — | — | — | 280 |
| Net attributable profit (loss) (**) | 4,653 | 1,581 | 2,568 | 740 | 491 | 254 | (980) |
| 2020 (*) | |||||||
| Net interest income | 14,592 | 3,566 | 5,415 | 2,783 | 2,701 | 291 | (164) |
| Gross income | 20,166 | 5,567 | 7,025 | 3,573 | 3,225 | 839 | (63) |
| Operating income | 11,079 | 2,528 | 4,680 | 2,544 | 1,853 | 372 | (898) |
| Operating profit (loss) before tax | 5,248 | 823 | 2,475 | 1,522 | 896 | 280 | (748) |
| Profit (loss) after tax from discontinued operations | (1,729) | — | — | — | — | — | (1,729) |
| Net attributable profit (loss) (**) | 1,305 | 652 | 1,761 | 563 | 446 | 222 | (2,339) |
| 2019 (*) | |||||||
| Net interest income | 15,789 | 3,585 | 6,209 | 2,814 | 3,196 | 236 | (252) |
| Gross income | 21,522 | 5,674 | 8,034 | 3,590 | 3,850 | 728 | (353) |
| Operating income | 11,368 | 2,420 | 5,383 | 2,375 | 2,276 | 249 | (1,336) |
| Operating profit (loss) before tax | 7,046 | 1,896 | 3,690 | 1,341 | 1,396 | 222 | (1,499) |
| Profit (loss) after tax from discontinued operations | (758) | — | — | — | — | — | (758) |
| Net attributable profit (loss) (**) | 3,512 | 1,436 | 2,698 | 506 | 721 | 184 | (2,032) |
(*) The figures of the Operating Segments corresponding to 2020 and 2019 have been restated.
(**) See Note 55.2.
The accompanying Consolidated Management Report presents the consolidated income statements and the consolidated balance sheets by operating segments.
7. Risk management
7.1 Risk factors
BBVA Group has processes in place for identifying risks and analyzing scenarios in order to enable the Group to manage risks in a dynamic and proactive way.
The risk identification processes are forward looking to seek the identification of emerging risks and take into account the concerns of both the business areas, which are close to the reality of the different geographical areas, and the corporate areas and senior management.
Risks are identified and measured consistently using the methodologies deemed appropriate in each case. Their measurement includes the design and application of scenario analyzes and stress testing and considers the controls to which the risks are subjected.
As part of this process, a forward projection of the Risk Appetite Framework (RAF) variables in stress scenarios is conducted in order to identify possible deviations from the established thresholds. If any such deviations are detected, appropriate measures are taken to keep the variables within the target risk profile.
In this context, there are a number of emerging risks that could affect the evolution of the Group's business. These risks are included in the following blocks:
- Risk associated with the COVID-19 pandemic
The COVID-19 (coronavirus) pandemic has adversely affected the world economy, and economic activity and conditions in the countries in which the Group operates. Despite the gradual improvement experienced in 2021 driven by the increase in the rate of vaccination, new waves of contagion continue to be a source of concern and the emergence of new strains remains a risk. Among other challenges, these countries are still dealing with high unemployment levels, weak activity, supply disruptions and increasing inflationary pressures, while public debt has increased significantly due to the support and spending measures implemented by the government authorities. Furthermore, there has been an increase in loan losses from both companies and individuals, which has so far been slowed down by the impact of government support measures, including bank payment deferrals, credit with public guarantee and direct aid measures. Likewise, volatility in the financial markets has affected exchange rates - mainly in emerging economies- and the value of assets and investments, which has adversely affected the Group's results in the past, and could do so again. There are still uncertainties about the final future impact of the COVID-19 pandemic, mainly if there is an increase in infections caused by the new variants of the coronavirus.
Furthermore, the Group has been and may be affected during the following quarters or years by the measures or recommendations adopted by regulatory authorities in the banking sector, such as variations in reference interest rates, the modification of prudential requirements, the temporary suspension of dividend payments, the modification of the deferral of monthly installments for certain loans and the granting of guarantees or public guarantees to new credit operations for companies and self-employed persons, the adoption of further similar measures or the termination of those already approved, as well as any changes in financial assets purchase programs by the ECB.
Since the outbreak of the pandemic, the Group has experienced a decline in its activity. For example, the granting of new loans to individuals has generally decreased. In addition, the Group faces various risks, such as an increased risk of volatility in the value of its assets (including financial instruments valued at fair value, which may suffer significant fluctuations) and of the securities held for liquidity reasons, a possible increase in the NPL ratio and risk-weighted assets, as well as a negative impact on the Group's cost of financing and on its access to financing (especially in an environment where credit ratings are affected). Following the generalized lifting of mobility restrictions and the increasing resumption of normal operations, greater emphasis is being placed on the particular circumstances of each customer, in addition to its respective industry or sector.
Furthermore, the pandemic could continue to adversely affect the business and transactions of third parties that provide critical services to the Group and, in particular, the higher demand and/or the lower availability of certain resources could, in some cases, make it more difficult for the Group to maintain the required service levels. In addition, the widespread use of remote work has increased the risks related to cybersecurity, as the use of non-corporate networks has increased.
In summary, while the COVID-19 pandemic had adverse effects on the Group's results and capital base during 2020, these were mitigated throughout 2021, with improvements in the global economic background leading to a strong improvement in 2021 results.
- Macroeconomic and geopolitical risks
In 2021 the global economy has grown significantly, recovering in part from the crisis caused by the pandemic, which caused a sharp fall in global GDP in 2020. The significant upturn in global growth has been due to progress in the vaccination against COVID-19 and important economic stimuli adopted by public authorities.
Activity indicators show, however, that the economic recovery process has lost momentum in recent months. The recent slowdown in economic growth is taking place in an environment marked by a sharp increase in infections caused by new variants of the COVID-19, although the increasing immunization of the world population has helped to generally prevent the adoption of mobility restrictions, which would have had a greater impact on the economy.
The effects of reduced production due to the pandemic and its persistence, coupled with fiscal stimuli and strong demand for goods, once restrictions have been lifted, contribute to maintaining the problems in global supply chains observed since the beginning of 2021 which, in addition to negatively affecting economic activity, generate significant upward pressure on prices.
Against this backdrop, annual inflation in December 2021 stood at 7.0% in the United States and 5.0% in the Eurozone. In both geographical areas, long-term inflation expectations from markets and surveys have been adjusted upwards, although in the case of the Eurozone they remain generally below the European Central Bank’s 2% target.
High inflation rates and their increased persistence have put pressure on central banks to withdraw monetary stimuli earlier than they had originally anticipated. The United States Federal Reserve, in particular, has begun the rollback in its bond-buying program and has suggested that monetary policy interest rates will adjust upwards earlier and faster than expected by financial markets and financial analysts, and also that a downsizing of its balance sheet may soon begin. In the Eurozone, the ECB will complete the pandemic emergency purchase program (PEPP) in March 2022. Although the asset purchase program (APP) is maintained, asset purchases will be moderated over the course of 2022. However, unlike the Federal Reserve, the ECB has continued to maintain that it rules out an increase in benchmark interest rates in 2022.
According to BBVA Research, the global economic recovery process is expected to continue in the coming months, albeit at a slightly slower pace than expected in autumn of 2021, due to the persistence of the pandemic, but also due to a higher-than-estimated impact of supply chain problems and inflationary pressures. All this against a background of reduced fiscal and monetary stimulus. GDP growth would therefore moderate, from an estimated 5.6% in 2021 to about 4.2% in 2022 in the United States, from 5.1% in 2021 to 3.7% in 2022 in the Eurozone and from 8.0% in 2021 to 5.2% in 2022 in China. The likely rise in monetary policy interest rates in the United States, which could reach 1.25% by the end of 2022, as well as a progressive control of the pandemic and a moderation of supply chain problems, would allow inflation to be moderated throughout the year; although inflation is expected to remain high, particularly in the United States. Risks arising from this economic scenario expected by BBVA Research are significant and are biased downwards in the case of activity, and include more persistent inflation, financial turbulence caused by a more aggressive withdrawal of monetary stimuli, the emergence of new variants of the coronavirus that bypass current vaccines, a more intense slowdown in the Chinese economy, as well as social and geopolitical tensions. Likewise, the countries in which the Group operates face various idiosyncratic risks, beyond those related to the global environment.
- Regulatory and reputational risks
Financial institutions are exposed to a complex and ever-changing regulatory environment defined by governments and regulators. This can affect their ability to grow and the capacity of certain businesses to develop, and result in stricter liquidity and capital requirements with lower profitability ratios. The Group constantly monitors changes in the regulatory framework that allow for anticipation and adaptation to them in a timely manner, adopt industry practices and more efficient and rigorous criteria in its implementation.
The financial sector is under ever closer scrutiny by regulators, governments and society itself. In the course of activities, situations which might cause relevant reputational damage to the entity could raise and might affect the regular course of business. The attitudes and behaviors of the Group and its members are governed by the principles of integrity, honesty, long-term vision and industry practices through, inter alia, the internal control model, the Code of Conduct, the Corporate Principles in tax matters and Responsible Business Strategy of the Group.
- Business, operational and legal risks
New technologies and forms of customer relationships: Developments in the digital world and in information technologies pose significant challenges for financial institutions, entailing threats (new competitors, disintermediation, etc.) but also opportunities (new framework of relations with customers, greater ability to adapt to their needs, new products and distribution channels, etc.). Digital transformation is a priority for the Group as it aims to lead digital banking of the future as one of its objectives.
Technological risks and security breaches: The Group is exposed to new threats such as cyber-attacks, theft of internal and customer databases, fraud in payment systems, etc. that require major investments in security from both the technological and human point of view. The Group gives great importance to the active operational and technological risk management and control.
Regarding legal risks, the financial sector faces an environment of increasing regulatory and litigious pressure, and thus, the various Group entities are usually party to individual or collective judicial proceedings (including class actions) resulting from their activity and operations, as well as arbitration proceedings. The Group is also party to other government procedures and investigations, such as those carried out by the antitrust authorities in certain countries which, among other things, have in the past and could in the future result in sanctions, as well as lead to claims by customers and others. In addition, the regulatory framework, in the jurisdictions in which the Group operates, is evolving towards a supervisory approach more focused on the opening of sanctioning proceedings while some regulators are focusing their attention on consumer protection and behavioral risk.
In Spain and in other jurisdictions where the Group operates, legal and regulatory actions and proceedings against financial institutions, prompted in part by certain judgments in favor of consumers handed down by national and supranational courts (with regards to matters such as credit cards and mortgage loans), have increased significantly in recent years and this trend could continue in the future. The legal and regulatory actions and proceedings faced by other financial institutions in relation to these and other matters, especially if such actions or proceedings result in favorable resolutions for the consumer, could also adversely affect the Group.
All of the above may result in a significant increase in operating and compliance costs or even a reduction of revenues, and it is possible that an adverse outcome in any proceedings (depending on the amount thereof, the penalties imposed or the procedural or management costs for the Group) could damage the Group's reputation, generate a knock-on effect or otherwise adversely affect the Group.
It is difficult to predict the outcome of legal and regulatory actions and proceedings, both those to which the Group is currently exposed and those that may arise in the future, including actions and proceedings relating to former Group subsidiaries or in respect of which the Group may have indemnification obligations. Any of such outcomes could be significantly adverse to the Group. In addition, a decision in any matter, whether against the Group or against another credit entity facing similar claims as those faced by the Group, could give rise to other claims against the Group. In addition, these actions and proceedings attract resources from the Group and may occupy a great deal of attention on part of the Group's management and employees.
As of December 31, 2021, the Group had €623 million in provisions for the proceedings it is facing (included in the line "Provisions for litigation and pending tax cases" in the consolidated balance sheet) (see Note 24), of which €533 million correspond to legal contingencies and €90 million to tax related matters. However, the uncertainty arising from these proceedings (including those for which no provisions have been made, either because it is not possible to estimate them or for other reasons) makes it impossible to guarantee that the possible losses arising from these proceedings will not exceed, where applicable, the amounts that the Group currently has provisioned and, therefore, could affect the Group's consolidated results in a given period.
As a result of the above, legal and regulatory actions and proceedings currently faced by the Group or to which it may become subject in the future or otherwise affected by, individually or in the aggregate, if resolved in whole or in part adversely to the Group's interests, could have a material adverse effect on the Group’s business, financial condition and results of operations.
Spanish judicial authorities are investigating the activities of Centro Exclusivo de Negocios y Transacciones, S.L. (Cenyt). Such investigation includes the provision of services by Cenyt to the Bank. On 29th July, 2019, the Bank was named as an investigated party (investigado) in a criminal judicial investigation (Preliminary Proceeding No. 96/2017 – Piece No. 9, Central Investigating Court No. 6 of the National High Court) for alleged facts which could be constitutive of bribery, revelation of secrets and corruption. On February 3, 2020, the Bank was notified by the Central Investigating Court No. 6 of the National High Court of the order lifting the secrecy of the proceedings. Certain current and former officers and employees of the Group, as well as former directors have also been named as investigated parties in connection with this investigation. The Bank has been and continues to be proactively collaborating with the Spanish judicial authorities, including sharing with the courts the relevant information obtained in the internal investigation hired by the entity in 2019 to contribute to the clarification of the facts. As of the date of the approval of the Consolidated Financial Statements, no formal accusation against the Bank has been made.
This criminal judicial proceeding is at the pre-trial phase. Therefore, it is not possible at this time to predict the scope or duration of such proceeding or any related proceeding or its or their possible outcomes or implications for the Group, including any fines, damages or harm to the Group’s reputation caused thereby.
7.2 Credit risk
Credit risk is the potential loss assumed by the Group as a result of the failure by the Group's counterparties to meet their contractual obligations.
The general principles governing credit risk management in the BBVA Group are:
- Risks taken should comply with the general risk policy established by the Board of Directors of BBVA.
- Risks taken should be in line with the level of equity and generation of recurring revenue of the BBVA Group prioritizing risk diversification and avoiding relevant concentrations.
- Risks taken should be identified, measured and assessed and there should be management and monitoring procedures, in addition to sound mitigation and control mechanisms.
- Risks should be managed in a prudent and integrated manner during their life cycle and their treatment should be based on the type of risk. In addition, portfolios should be actively managed on the basis of a common metric (economic capital).
- The main criterion when granting credit risks is the capability of the borrower or obligor to fulfill on a timely basis all financial obligations with its business income or source of income without depending upon guarantors, bondsmen or pledged assets.
- Improve the financial health of our clients, help them in their decision making and in the daily management of their finances based on personalized advice.
- Help our clients in the transition towards a sustainable future, with a focus on climate change and inclusive and sustainable social development.
Credit risk management in the Group has an integrated structure for all its functions, allowing decisions to be taken objectively and independently throughout the life cycle of the risk.
- At Group level: frameworks for action and standard rules of conduct are defined for handling risk, specifically, the channels, procedures, structure and supervision.
- At the business area level: they are responsible for adapting the Group's criteria to the local realities of each geographical area and for direct management of risk according to the decision-making channel:
- Retail risks: in general, the decisions are formalized according to the scoring tools, within the general framework for action of each business area, with regard to risks. The changes in weighting and variables of these tools must be validated by the GRM area.
- Wholesale risks: in general, the decisions are formalized by each business area within its general framework for action with regard to risks, which incorporates the delegation rule and the Group's corporate policies.
The risk function has a decision-making process supported by a structure of committees with a solid governance scheme, which describes their purposes and functioning for a proper performance of their tasks.
This governance scheme has been key in the management of the COVID-19 crisis in all the geographical areas where the Group operates, in which it has been possible to ensure the maintenance of the flow of funds required for the operation of the economies while rigorously analyzing and monitoring the credit quality of exposures.
COVID-19 support measures
Since the beginning of the pandemic, the Group offered COVID-19 support measures to its customers (individuals, SMEs and wholesale) in all the geographic areas where it operates, consisting of both deferrals on existing loans and new public-guaranteed lending. These measures were extended to individual customers and, in the case of legal entities, to different sectors, with Leisure and Real Estate being the sectors that have used them most. Deferral support schemes have expired in all geographical areas.
Deferrals were both legislative (based on national laws) and non-legislative (based on sectorial or individual schemes) and were aimed at mitigating the effects of COVID-19 and deferring the payment of principal and/or interest, while maintaining the original contracts. The detail of legislative deferrals by geographical area is as follows:
Spain:
- Mainly covered by Royal Decree Laws (hereinafter "RDL") 8/2020 and 11/2020, as well as by the sector agreement promoted by the Spanish Banking Association (hereinafter "AEB") to which BBVA adhered.
- Legislative deferrals consisted of a three-month deferral of principal and interest payments and were aimed, by type of client, at individuals, sole proprietors or the self-employed and, by type of product, at mortgages, personal loans or consumer loans.
- In addition, once the legal deferral expired, customers could adhere to the sector agreement for the remaining term up to the limit established in that agreement.
- Deferrals granted under the AEB sectorial agreement had a duration of up to 12 months of principal deferral in the case of mortgage loans and up to 6 months in personal loans.
- Under RDL 26/2020, the possibility of deferring the principal and/or interests was offered for companies in the transport sector for up to 6 months and for companies in the tourism sector for up to 12 months.
Mexico:
- The National Banking and Securities Commission (hereinafter, "CNBV") published the official records P285/2020 dated March 26, 2020 and P293/2020 dated April 15, 2020, allowing the granting of deferrals on principal and interest for a term of 4 months, extendable for 2 months more. The main beneficiaries of these measures were individuals and companies, impacting mortgage loans, personal loans and consumer loans, including credit cards.
Turkey:
- The Banking Regulation and Supervisory Agency (hereinafter, "BRSA") instructed banks to support customers through deferrals, consisting of deferring payments for a period of 3 months, with a potential extension of up to 6 months. These support measures were granted to individual customers.
Colombia:
- The binding legislation for deferrals is provided by the Financial Superintendence of Colombia, specifically by its Circulars 07/2020 and 14/2020, as well as Resolution No. 385. The deferrals offered consisted of the deferral of principal and interest payments for up to 6 months.
Peru
- Several measures were approved by the Superintendence of Banking and Insurance (SBS) of Peru, allowing the deferral of principal and interest payments, initially for up to 6 months and later extended for up to 12 months, mainly for individuals, self-employed and small companies.
Argentina:
- Based on state legislation such as Royal Decree 544/2020 or Decree 319/2020, as well as on various regulations from the Central Bank. Deferral for up to 3 months of principal and interest.
With regard to new financing with public guarantees, the Group's involvement in the following is noteworthy:
Spain:
- The Official Credit Institute (hereinafter, ICO) published several aid programs aimed at the self-employed, small and medium-sized enterprises (hereinafter "SMEs") and companies, through which a guarantee of between 60% and 80% (in SMEs always 80%) was granted for a term of up to 5 years for new financing granted (RDL Mar/2020).
- The amount and duration of the guarantee depended on the size of the company and the type of aid to which it applied, and could be extended for up to a maximum term of 3 additional years and the grace period could be extended for up to 12 additional months with respect to the terms and grace periods initially agreed (RDL Nov/2020).
- Likewise, facilities were provided in term extensions (up to a maximum term of 10 years), conversion of financing operations into Participative Loans as well as debt forgiveness in part of the financing (RDL 5/2021 and Code of Good Practices).
- The ICO has also subsidized for individuals the amount of the rent for up to 6 months in loans of up to 6 years.
- Almost all of the ICO loans with the expired grace period have resumed payment on a regular basis or canceled their debt.
- ICO loan extensions represented around 25% of all ICO financing.
Turkey:
- Public support programs have been registered guaranteeing up to 80% of loans to companies for a term of 1 year.
Colombia:
- Different public support programs (FNG, Bancoldex, Finagro, Findeter) provide for guarantees covering between 50-90%.
Peru:
- There were public support programs such as Reactiva, Crecer or FAE aimed at companies and micro-enterprises with guaranteed amounts ranging from 60% to 98%, depending on the program and the type of company.
- For loans granted under the Reactiva program, it was possible to extend both the maturity date and the grace period of the loans.
Argentina:
- Guarantees of up to 100% for micro-SMEs or self-employed and up to 25% for other companies in loans of up to 1 year.
The outstanding balance of existing loans for which a payment deferral was granted (split by those existing at year-end and those that were completed by year-end) under EBA standards and for which financing was granted with public guarantees given at a Group level, as well as the number of customers of both measures, as of December 31, 2021 and 2020 are as follows:
Amount of payment deferral and financing with public guarantees of the Group (Millions of Euros)
| Payment deferral | Financing with public guarantees | |||||||
|---|---|---|---|---|---|---|---|---|
| Existing | Completed | Total | Number of customers | Total | Number of customers | Total payment deferral and guarantees | (%) credit investment | |
| December 2021 | 189 | 21,743 | 21,931 | 2,188,720 | 16,093 | 264,809 | 38,025 | 10.9 % |
| December 2020 (*) | 6,536 | 21,868 | 28,405 | 2,779,964 | 16,053 | 249,458 | 44,458 | 12.9 % |
(*) Figures as of December 2020 do not include the companies sold in the United States in 2021.
The outstanding balance of existing loans for which a payment deferral was granted (split by those existing at year-end and those that were completed by year-end) under EBA standards and for which financing was granted with public guarantees given at a Group level, broken down by segment, as of December 31, 2021 and 2020 are as follows:
Amount of payment deferral and financing with public guarantees by concept (Millions of Euros)
| Payment deferral | Financing with public guarantees | |||||||
|---|---|---|---|---|---|---|---|---|
| Existing | Completed | Total | ||||||
| 2021 | 2020 (*) | 2021 | 2020 (*) | 2021 | 2020 (*) | 2021 | 2020 (*) | |
| Group | 189 | 6,536 | 21,743 | 21,868 | 21,931 | 28,405 | 16,093 | 16,053 |
| Households | 107 | 4,503 | 14,904 | 14,550 | 15,011 | 19,052 | 1,376 | 1,235 |
| Of which: Mortgages | 97 | 3,587 | 10,195 | 7,471 | 10,291 | 11,059 | 6 | 1 |
| SMEs | 44 | 1,023 | 3,950 | 4,743 | 3,994 | 5,766 | 10,911 | 10,573 |
| Non-financial corporations | 37 | 961 | 2,766 | 2,397 | 2,803 | 3,358 | 3,788 | 4,232 |
| Other | — | 50 | 122 | 179 | 122 | 229 | 18 | 13 |
(*) Figures as of December 2020 do not include the companies sold in the United States in 2021.
Amount of payment deferral by stages (Millions of Euros)
| Stage 1 | Stage 2 | Stage 3 | Total | |||||
|---|---|---|---|---|---|---|---|---|
| 2021 | 2020 (*) | 2021 | 2020 (*) | 2021 | 2020 (*) | 2021 | 2020 (*) | |
| Group | 13,236 | 18,602 | 6,252 | 7,736 | 2,444 | 2,066 | 21,931 | 28,405 |
| Households | 9,167 | 12,336 | 3,707 | 4,997 | 2,137 | 1,719 | 15,011 | 19,052 |
| Of which: Mortgages | 6,360 | 7,347 | 2,444 | 2,844 | 1,487 | 867 | 10,291 | 11,059 |
| SMEs | 2,609 | 4,147 | 1,131 | 1,327 | 254 | 292 | 3,994 | 5,766 |
| Non-financial corporations | 1,364 | 1,903 | 1,387 | 1,399 | 53 | 56 | 2,803 | 3,358 |
| Other | 95 | 216 | 27 | 13 | — | — | 122 | 229 |
(*) Figures as of December 2020 do not include the companies sold in the United States in 2021.
Deferrals involved the temporary suspension, in whole or in part, of contractual obligations and their deferral for a specific period of time. Considering that the payment deferrals granted in connection with COVID -19 provide temporary relief to the debtors and that the economic value of the affected loans was not significantly impacted, no contractual modifications were considered and, therefore, the modified loans are accounted for as a continuation of the original loans.
During 2020, the loss of temporary value of the deferrals that did not trigger the right to collect interest was included under the heading "Impairment or reversal of impairment on financial assets not measured at fair value through profit or loss or net gains by modification” of the consolidated income statement, amounting to €304 million, of which €300 million had been already recognized as higher interest margin at such date. During 2021, the amount recognized was not significant.
Regarding the classification of exposures according to their credit risk, the Group has continued to apply IFRS 9 rigorously when granting the payment deferrals and has reinforced the procedures for monitoring credit risk both throughout the life of the transactions and at their maturity. This means that the payment deferrals granting does not imply in itself an automatic trigger for a significant increase in risk and that the transactions subject to the payment deferrals are initially classified in the stage in which they had previously been classified, unless, based on their risk profile, they should be classified in a worse stage. On the other hand, as evidence of payment has ceased to exist or has been reduced, the Group has introduced additional indicators or segmentations to identify the significant increase in risk or impairment that may have occurred in some transactions or a set of them and, where appropriate, they have been classified in Stage 2 or Stage 3.
Furthermore, the indications provided by the European Banking Authority (EBA) have been taken into account to not consider as "forbearance" the payment deferrals that meet a series of requirements. All this without prejudice to maintaining its consideration as a forbearance if it was previously qualified as such or classifying the exposure in the corresponding stage previously stated.
On the other hand, the treatment planned for the payment deferrals that expire and may require additional support will be in accordance with the updated evaluation of the customer's credit quality and the characteristics of the solution granted. If applicable, they will be treated as Refinancing or Restructuring as described in Note 7.2.7 of the Financial Statements.
Regarding public support for lending, it does not affect the evaluation of the significant increase in risk since risk is valued based on the credit quality of the relevant instrument. However, in estimating the expected loss, the existence of the guarantor implies a possible reduction in the level of provisions necessary since, for the hedged part, the loss that would be incurred in the foreclosure of the guarantee is taken into account.
The public guarantees granted in the different geographies in which the Group operates have been considered as an integral part of the terms and conditions of the loans granted under the consideration that the guarantees are granted at the same time that the financing is granted to the client and in a way inseparable from it.
The quantitative information on refinancing and restructuring operations is presented in Appendix XI: "Quantitative information on refinancing and restructuring operations and other requirement under Bank of Spain Circular 6/2012".
7.2.1 Measurement of Expected Credit Loss
IFRS 9 requires determining the Expected Credit Loss (hereinafter "ECL") of a financial instrument in a way that reflects an unbiased estimation removing any conservatism or optimism, including the time value of money and a forward-looking perspective (including the economic forecast), all this based on the information that is available at a certain point in time and that is reasonable and bearable with respect to future economic conditions.
Therefore, the recognition and measurement of ECL is highly complex and involves the use of significant analysis and estimation including formulation and incorporation of forward-looking economic conditions into the ECL model.
The modeling of the ECL calculation is subject to a governance system that is common to the entire Group. Within this common framework, each geography makes the necessary adaptations to capture its particularities. The methodology, assumptions and observations used by each geography are reviewed annually, and after a validation and approval process, the outcome of this review is incorporated into the ECL calculations.
Risk parameters by homogeneous groups
Expected losses can be estimated both individually and collectively. Regarding the collective estimate, the instruments are distributed in homogeneous groups (segments) that share similar risk characteristics. Following the guidelines established by the Group for the development of models under IFRS 9, each geography performs the grouping based on the information available, its representativeness or relevance and compliance with the necessary statistical requirements.
Depending on the portfolio or the parameter being estimated, one risk driver or another will apply and different segments will reflect differences in PDs and LGDs. Thus, in each segment, changes in the level of credit risk will respond to the impact of changing conditions on the common range of credit risk drivers. The effect on the Group’s credit risk in response to changes in forward-looking information will be considered as well. Macroeconomic modeling for each segment is carried out using some of the shared risk characteristics.
These segments share credit risk characteristics such that changes in credit risk in a part of the portfolio are not concealed by the performance of other parts of the portfolio. In that sense, the methodology developed for ECL estimation indicates the risk drivers that have to be taken into account for PD segmentation purposes, depending on whether the estimation is for retail or wholesale portfolios.
As an example of the variables that can be taken into consideration to determine the final models, the following stand out:
- PD - Retail: Contractual residual maturity, credit risk scoring, type of product, days past due, forbearance, time on books, time to maturity, nationality of the debtor, sale channel, original term, indicator of credit card activity, percentage of initial drawn balance in credit cards.
- PD - Wholesale: Credit Risk Rating, type of product, watch-list level, forbearance (client), time to maturity, industry sector, updated balance (y/n), written off, grace period.
- LGD – retail: credit Risk Scoring, segment, type of product, secured / unsecured, type of collateral, sales channel, nationality, business area, debtor’s commercial segment, forbearance (account) EAD (this risk driver could be correlated with the time on books or the LTV so, before including it, an assessment should be done in order to avoid a double counting effect), time on default of the account (for defaulted exposures), geographical location.
- LGD - wholesale: credit Risk Rating, geographical location, segment, type of product, secured / Unsecured, type of collateral, business area, forbearance (client), debtor’s commercial segment time on default of the deal (for defaulted exposures).
- CCF: wholesale/retail, percentage of initial drawn balance, debtor’s commercial segment, days past due, forbearance, credit limit activity, time on books.
In the BBVA Group, the expected losses calculated are based on the internal models developed for all the Group's portfolios, unless clients are subject to individualized estimates.
Low Default Portfolios, which include portfolios with high credit quality such as exposures to other credit institutions, sovereign debt or corporates and small client's portfolios with high exposures such as specialized lending or fixed income, are characterized by a low number of defaults, so the Group's historical bases do not contain sufficiently representative information to build impairment models based on them. However, there are external sources of information that, based on broader observations, are capable of providing the necessary inputs to develop models of expected losses. Therefore, based on the rating assigned to these exposures and taking into account the inputs obtained from these sources, the calculations of expected losses are developed internally, including their projection based on the macroeconomic perspectives.
Individual estimation of Expected Credit Losses
The Group periodically and individually reviews the situation and credit rating of its customers, regardless of their classification, taking into consideration the information deemed necessary to do so. It also has procedures in place within the risk management framework to identify the factors that may lead to increased risk and, consequently, to a greater need for provisions.
The monitoring model established by the Group consists of continuously monitoring the risks to which it is exposed, which guarantees their proper classification in the different categories of IFRS 9. The original analysis of the exposures is reviewed through the procedures for updating the rating tools (rating and scoring), which periodically review the financial situation of clients, influencing the classification by stages of exposures.
Within this credit risk management framework, the Group has procedures that seek to guarantee the review, at least annually, of all its wholesale counterparties through the so-called financial programs, which include the current and proposed positioning of the Group with the customer in terms of credit risk. This review is based on a detailed analysis of the client's up-to-date financial situation, which is complemented by other information available in relation to individual perspectives on business performance, industry trends, macroeconomic prospects or other public data. As a result of this analysis, the preliminary rating of the client is obtained, which, after undergoing the internal procedure, can be revised down if deemed appropriate (for example, general economic environment or evolution of the sector). These factors in addition to the information that the client can provide are used to review the ratings even before the scheduled financial plan reviews are conducted if circumstances so warrant.
Additionally, the Group has established procedures to identify wholesale customers in the internal Watch List category, which is defined as that risk in which, derived from an individualized credit analysis, an increase in credit risk is observed, either due to economic or financial difficulties or because they have suffered, or are expected to suffer, adverse situations in their environment, without meeting the criteria for classification as impaired risk. Under this procedure, all a customer's Watch List exposures are considered stage 2 regardless of when they originated, if as a result of the analysis the customer is considered to have significantly increased risk.
Finally, the Group has Workout Committees, both local and corporate, which analyze not only the situation and evolution of significant clients in Watch List and impaired situations, but also those significant clients in which, although not on Watch List, may present some stage 2 rated exposure for a quantitative reason (PD comparison from origination). This analysis is carried out in order to decide if, derived from this situation, all the client's exposures should be considered in the Watch List category, which would imply the migration of all the client's operations to stage 2 regardless of the date on which they originated.
With this, the Group ensures an individualized review of the credit quality of its wholesale counterparties, identifying the situations in which a change in the risk profile of these clients may have occurred and proceeding, where appropriate, to estimate individualized credit losses. Along with this review, the Group individually estimates the expected losses of those clients whose total exposure exceeds certain thresholds, including those that part of their operations may be classified in stage 1 and part in stage 2. In setting thresholds, each geography determines the minimum amount of a client's exposure whose expected losses must be estimated individually taking into account the following:
- For clients with exposures in stage 3. The analysis of clients with total risk above this threshold implies analyzing at least 40% of the total risk of the wholesale portfolio in stage 3. Although the calibration of the threshold is done on the wholesale portfolio, clients of other portfolios must be analyzed if they exceed the threshold, staying in Stage 3.
- For all other situations. The analysis of clients with total risk above this threshold implies analyzing at least 20% of the total risk of the Watch List wholesale portfolio. Although the threshold calibration is carried out on the exposure classified as Watch List, wholesale clients or clients belonging to other portfolios that have exposures classified in stage 2 and whose total exposure exceeds the mentioned threshold must be analyzed individually, considering both the exposures classified in stage 1 as in stage 2.
Regarding the methodology for the individual estimation of expected losses, it should be mentioned, firstly, that these are measured as the difference between the asset’s carrying amount and the estimated future cash flows discounted at the financial asset’s effective interest rate.
The estimated recoverable amount should correspond to the amount calculated under the following method:
- The present value of estimated future cash flows discounted at the financial asset’s original effective interest rate; and
- The estimation of the recoverable amount of a collateralized exposure reflects the cash flows that may result from the settlement of the collateral, as well as prospective information the analyst may implicitly include in the analysis.
The estimated future cash flows depend on the type of approach applied, which can be:
- Going concern scenario: when the entity has updated and reliable information about the solvency and ability of payment of the holders or guarantors. The operating cash flows of the debtor, or the guarantor, continue and can be used to repay the financial debt to all creditors. In addition, collateral may be exercised to the extent it does not influence operating cash flows. The following aspects should be taken into account:
- Future operating cash flows should be based on the financial statements of the debtor.
- When the projections made on these financial statements assume a growth rate, a constant or decreasing growth rate must be used over a maximum growth period of 3 to 5 years, and subsequently constant cash flows.
- The growth rate should be based on the analysis of the evolution of the debtor's financial statements or on a sound and applicable business restructuring plan, taking into account the resulting changes in the structure of the company (for example, due to divestments or the interruption of unprofitable lines of business).
- (Re)-investments that are needed to preserve cash flows should be considered, as well as any foreseeable future cash-flow changes (e.g. if a patent or a long-term loan expires).
- When the recoverability of the exposure relies on the realization of the disposal of some assets by the debtor, the selling price should reflect the estimated future cash flows that may result from the sale of the assets less the estimated costs associated with the disposal.
- Gone concern scenario: when the entity does not have updated and reliable information, it should consider that the estimation of loan receivable flows is highly uncertain. Estimation should be carried out through the estimation of recoverable amounts from the effective real guarantees received. It will not be admissible as effective guarantees, those whose effectiveness depends substantially on the creditworthiness of the debtor or economic group in which it takes part. Under a gone concern scenario, the collateral is exercised and the operating cash flows of the debtor cease. This could be the case if:
- The exposure has been past due for a long period. There is a rebuttable presumption that the allowance should be estimated under a gone concern criterion when arrears are greater than 18 months.
- Future operating cash flows of the debtor are estimated to be low or negative.
- Exposure is significantly collateralized, and this collateral is central to cash-flow generation.
- There is a significant degree of uncertainty surrounding the estimation of the future cash flows. This would be the case if the earnings before interest, taxes, depreciation and amortization (EBITDA) of the two previous years had been negative, or if the business plans of the previous years had been flawed (due to material discrepancies in the backtesting).
- Insufficient information is available to perform a going concern analysis.
Significant increase in credit risk
As indicated in Note 2.2, the criteria for identifying the significant increase in risk are applied consistently throughout the Group, distinguishing between quantitative reasons or by comparison of probabilities of default and qualitative reasons (more than 30 days of default, watch list consideration or non-impaired refinancing).
To manage credit risk, the Group uses all relevant information that is available and that may affect the credit quality of the exposures. This information may come mainly from the internal processes of admission, analysis and monitoring of operations, from the strategy defined by the Group regarding the price of operations or distribution by geographies, products or sectors of activity, from the observance of the macroeconomic environment, from market data such as interest rate curves, or prices of the different financial instruments, or from external sources of credit rating.
This set of information is the basis for determining the rating and scoring (see Note 7.2.4 for more information on rating and scoring systems) corresponding to each of the exposures and which are assigned a probability of default (PD) that, as already mentioned, is subject to an annual review process that assesses its representativeness (backtesting) and is updated with new observations. Furthermore, the projection of these PDs over time has been modeled based on macroeconomic expectations, which allows obtaining the probabilities of default throughout the life of the operations.
Based on this common methodology, and in accordance with the provisions of IFRS 9 and the EBA guidelines on credit risk management practices, each geography has established absolute and relative thresholds for identifying whether the expected changes in the probabilities of default have increased significantly compared to the initial moment, adapted to the particularities of each one of them in terms of origination levels, product characteristics, distribution by sectors or portfolios, and macroeconomic situation. To establish the aforementioned thresholds, a series of general principles are considered, such as:
- Uniformity: Based on the rating and scoring systems that, in a homogeneous manner, are implemented in the Group's units.
- Stability: The thresholds must be established to identify the significant increase in risk produced in exposures since their initial recognition and not only to identify those situations in which it is already foreseeable that they will reach the level of impairment. For this reason, it is to be expected that of the total exposures there will always be a representative group for which said increased risk is identified.
- Anticipation: The thresholds must consider the identification of the increased risk in advance with respect to the recognition of the exposures as impaired or even before a real default occurs. The calibration of the thresholds should minimize the cases in which the instruments are classified in stage 3 without having previously been recognized as stage 2.
- Indicators or metrics: It is expected that the classification of the exposures in stage 2 will have sufficient permanence to be able to develop an anticipatory management plan with respect to them before, where applicable, they end up migrating to stage 3.
- Symmetry: IFRS 9 provides for a symmetric treatment both to identify the significant increase in risk and to identify that it has disappeared, so the thresholds also work to improve the credit classification of exposures. In this sense, it is expected that the cases in which the exhibitions that improve from stage 3 are directly classified into stage 1 will be minimal.
- The identification of the significant increase in risk from the comparison of the probabilities of default should be the main reason why exposures in stage 2 are recognized.
Specifically, a contract will be transferred to stage 2 when the following two conditions are met by comparing the current PD values and the origination PD values:
/ (Origination PD) -
Current PD – Origination PD > Absolute threshold (bps)
These absolute and relative thresholds are consistently established for each geography and for each portfolio, taking into account their particularities and based on the principles described. The thresholds set by each geography are included within the annual review process and, generally speaking, are in the range of 150% to 250% for the relative threshold and from 10 to 150 basis points for the absolute threshold.
The establishment of absolute and relative thresholds, as well as their different levels, comply with the provisions of IFRS 9 when it indicates that a certain change, in absolute terms, in the risk of a default will be more significant for a financial instrument with a lower initial risk of default compared to a financial instrument with higher initial risk of default.
For existing contracts before the implementation of IFRS 9, given the limitations in the information available on them, the thresholds are calibrated based on the PDs obtained from the prudential or economic models for calculating capital.
Risk Parameters Adjusted by Macroeconomic Scenarios
Expected Credit Loss (ECL) must include forward looking information, in accordance with IFRS 9, which states that the comprehensive credit risk information must incorporate not only historical information but also all relevant credit information, also including forward-looking macroeconomic information. BBVA uses the typical credit risk parameters PD, LGD and EAD in order to calculate the ECL for the credit portfolios.
BBVA methodological approach in order to incorporate the forward looking information aims to determine the relation between macroeconomic variables and risk parameters following three main steps:
- Step 1: Analysis and transformation of time series data.
- Step 2: For each dependent variable find conditional forecasting models that are economically consistent.
- Step 3: Select the best conditional forecasting model from the set of candidates defined in Step 2, based on their forecasting capacity.
How economic scenarios are reflected in calculation of ECL
The forward looking component is added to the calculation of the ECL through the introduction of macroeconomic scenarios as an input. Inputs highly depend on the particular combination of region and portfolio, so inputs are adapted to available data regarding each of them.
Based on economic theory and analysis, the main indicators most directly relevant for explaining and forecasting the selected risk parameters (PD, LGD and EAD) are:
- The net income of families, corporates or public administrations.
- The outstanding payment amounts on the principal and interest on the financial instruments.
- The value of the collateral assets pledged to the loan.
BBVA Group approximates these variables by using a proxy indicator from the set included in the macroeconomic scenarios provided by the BBVA Research department.
Only a single specific indicator for each of the three categories can be used and only one of the following core macroeconomic indicators should be chosen as first option:
- The real GDP growth for the purpose of conditional forecasting can be seen as the only “factor” required for capturing the influence of all potentially relevant macro-financial scenarios on internal PDs and LGD.
- The most representative short term interest rate (typically the policy rate or the most liquid sovereign yield or interbank rate) or exchange rates expressed in real terms.
- A comprehensive and representative index of the price of real estate properties expressed in real terms in the case of mortgage loans and a representative and real term index of the price of the relevant commodity for corporate loan portfolios concentrated in exporters or producers of such commodity.
Real GDP growth is given priority over any other indicator not only because it is the most comprehensive indicator of income and economic activity but also because it is the central variable in the generation of macroeconomic scenarios.
Multiple scenario approach
IFRS 9 requires calculating an unbiased probability weighted measurement of ECL by evaluating a range of possible outcomes, including forecasts of future economic conditions.
The BBVA Research teams within the BBVA Group produce forecasts of the macroeconomic variables under the baseline scenario, which are used in the rest of the related processes of the Group, such as budgeting, ICAAP and risk appetite framework, stress testing, etc.
Additionally, the BBVA Research teams produce alternative scenarios to the baseline scenario so as to meet the requirements under the IFRS 9 standard.
Alternative macroeconomic scenarios
- For each of the macro-financial variables, BBVA Research produces three scenarios.
- BBVA Research tracks, analyzes and forecasts the economic environment to provide a consistent forward looking assessment about the most likely scenario and risks that impact BBVA’s footprint. To build economic scenarios, BBVA Research combines official data, econometric techniques and expert judgment.
- Each of these scenarios corresponds to the expected value of a different area of the probabilistic distribution of the possible projections of the economic variables.
- The non-linearity overlay is defined as the ratio between the probability-weighted ECL under the alternative scenarios and the baseline scenario, where the scenario’s probability depends on the distance of the alternative scenarios from the base one.
- BBVA Group establishes equally weighted scenarios, being the probability 34% for the baseline scenario, 33% for the unfavorable alternative scenario and 33% for the favorable alternative scenario.
The approach in the BBVA Group consists on using the scenario that is the most likely scenario, which is the baseline scenario, consistent with the rest of internal processes (ICAAP, Budgeting, etc.) and then applying an overlay adjustment that is calculated by taking into account the weighted average of the ECL determined by each of the scenarios. This effect is calculated taking into account the average weight of the expected loss determined for each scenario.
It is important to note that in general, it is expected that the effect of the overlay is to increase the ECL. It is possible to obtain an overlay that does not have that effect, whenever the relationship between macro scenarios and losses is linear.
On the other hand, the BBVA Group also takes into account the range of possible scenarios when defining its significant increase in credit risk. Thus, the PDs used in the quantitative process to identify the significant increase in credit risk will be those that result from making a weighted average of the PDs calculated under the three scenarios.
Macroeconomic scenarios
The COVID-19 pandemic generated uncertainty over macroeconomic outlooks, having a direct impact on the credit risk of entities, particularly, on the expected credit losses under IFRS 9. The situation remains unclear, including the remaining duration of the pandemic. At the outset of the pandemic, the expectation was that this situation would provoke a severe recession followed by an economic recovery, but which would not achieve the pre-crisis GDP levels in the short-term, supported by the measures issued by governments and monetary authorities.
This situation prompted the accounting authorities and the banking supervisors to adopt measures in order to mitigate the impacts that the crisis would have on the calculation of expected credit losses under IFRS 9 as well as on solvency, urging:
- the entities to evaluate all the available information, weighing more the long-term forecasts against the short-term economic factors
- the governments to adopt measures to avoid the effects of impairment,
- the entities to develop managerial measures as the design of specific products adapted to the situation which could occur during this crisis.
Almost all accounting and prudential authorities issued recommendations or measures within the COVID-19 crisis framework regarding the estimation of the expected losses under IFRS 9 in a coordinated manner.
The common denominator of all of these recommendations was that, given the difficulty of establishing reliable macroeconomic forecasts, the transitory nature of the economic shock and the need to incorporate the effect of the mitigating measures issued by the governments, a review of the automatic application of the models in order to increase the weight of the long-term macroeconomic forecasts in the calculation of the expected losses was needed. As a result thereof, the expected outcome over the lifetime of the transactions had more weight than the short-term macroeconomic impact.
In this respect, the BBVA Group took into account those recommendations in the calculation of the expected credit losses under IFRS 9, considering that the economic situation caused by the COVID-19 pandemic is transitory and is expected to be followed by a recovery, even if there is uncertainty over the level and the time period of such recovery. As a consequence, different scenarios have been taken into consideration in the calculation of expected losses, resulting in the model management believes suits best the current economic situation and the combined recommendations issued by the authorities.
In 2021, once the most critical phase of the pandemic has been overcome, the forward looking information incorporated in the calculation of expected losses is in line with the macroeconomic perspectives published by BBVA Research as was usual until the beginning of the pandemic. However, certain management adjustments are maintained as described in the section "Additional adjustments to expected loss measurement" to cover exposures that are estimated even with a greater degree of uncertainty.
The estimate for the next five years of the following rates, used in the measurement of the expected loss as of December 31, 2020, consistent with the latest estimates made public at that date, was:
Positive scenario of GDP, unemployment rate and HPI for the main geographies
| Spain | Mexico | Turkey | Peru | Argentina | Colombia | |||||||||
|---|---|---|---|---|---|---|---|---|---|---|---|---|---|---|
| Date | GDP | Unemployment | HPI | GDP | Unemployment | HPI | GDP | Unemployment | GDP | Unemployment | GDP | Unemployment | GDP | Unemployment |
| 2021 | 5.52 % | 14.42 % | 0.33 % | 6.39 % | 4.18 % | 2.35 % | 11.63 % | 11.90 % | 13.60 % | 11.33 % | 9.91 % | 15.12 % | 9.89 % | 15.36 % |
| 2022 | 6.14 % | 12.50 % | 4.70 % | 4.07 % | 3.89 % | 5.38 % | 5.60 % | 11.35 % | 4.91 % | 7.50 % | 6.69 % | 11.34 % | 5.33 % | 13.60 % |
| 2023 | 5.13 % | 10.05 % | 3.06 % | 2.81 % | 3.75 % | 3.85 % | 5.80 % | 11.93 % | 3.78 % | 6.82 % | 3.02 % | 9.48 % | 3.38 % | 13.22 % |
| 2024 | 2.61 % | 8.48 % | 1.87 % | 2.17 % | 3.69 % | 3.07 % | 3.62 % | 12.66 % | 2.76 % | 6.55 % | 2.09 % | 7.99 % | 3.30 % | 12.31 % |
| 2025 | 2.22 % | 7.49 % | 1.56 % | 1.88 % | 3.64 % | 4.08 % | 3.66 % | 12.94 % | 2.34 % | 6.52 % | 2.16 % | 6.89 % | 3.44 % | 11.58 % |
| 2026 | 2.19 % | 6.71 % | 1.19 % | 1.83 % | 3.59 % | 3.95 % | 3.66 % | 13.05 % | 2.28 % | 6.47 % | 2.12 % | 6.88 % | 3.51 % | 11.32 % |
Base scenario of GDP, unemployment rate and HPI for the main geographies
| Spain | Mexico | Turkey | Peru | Argentina | Colombia | |||||||||
|---|---|---|---|---|---|---|---|---|---|---|---|---|---|---|
| Fecha | GDP | Unemployment | HPI | GDP | Unemployment | HPI | GDP | Unemployment | GDP | Unemployment | GDP | Unemployment | GDP | Unemployment |
| 2021 | 5.23 % | 14.93 % | (0.20) % | 5.98 % | 4.22 % | 2.46 % | 9.46 % | 12.43 % | 12.22 % | 11.38 % | 7.49 % | 15.50 % | 9.17 % | 15.44 % |
| 2022 | 5.49 % | 13.98 % | 2.91 % | 3.19 % | 4.05 % | 5.30 % | 1.98 % | 12.80 % | 2.32 % | 7.70 % | 2.30 % | 12.35 % | 4.02 % | 13.86 % |
| 2023 | 4.89 % | 11.68 % | 2.04 % | 2.54 % | 3.92 % | 3.68 % | 5.04 % | 12.93 % | 3.05 % | 7.06 % | 2.04 % | 10.40 % | 3.13 % | 13.51 % |
| 2024 | 2.59 % | 10.08 % | 1.50 % | 2.09 % | 3.83 % | 3.07 % | 3.49 % | 13.03 % | 2.76 % | 6.76 % | 1.98 % | 8.60 % | 3.29 % | 12.60 % |
| 2025 | 2.22 % | 9.05 % | 1.10 % | 1.87 % | 3.77 % | 4.08 % | 3.54 % | 13.13 % | 2.34 % | 6.70 % | 2.03 % | 7.38 % | 3.44 % | 11.87 % |
| 2026 | 2.19 % | 8.15 % | 0.74 % | 1.82 % | 3.71 % | 3.93 % | 3.53 % | 13.23 % | 2.28 % | 6.64 % | 1.99 % | 7.38 % | 3.51 % | 11.53 % |
Negative scenario of GDP, unemployment rate and HPI for the main geographies
| Spain | Mexico | Turkey | Peru | Argentina | Colombia | |||||||||
|---|---|---|---|---|---|---|---|---|---|---|---|---|---|---|
| Date | GDP | Unemployment | HPI | GDP | Unemployment | HPI | GDP | Unemployment | GDP | Unemployment | GDP | Unemployment | GDP | Unemployment |
| 2021 | 4.95% | 15.41% | (0.82)% | 5.58% | 4.27% | 2.54% | 7.29% | 12.94% | 10.84% | 11.43% | 5.14% | 15.86% | 8.43% | 15.52% |
| 2022 | 4.88% | 15.41% | 1.31% | 2.33% | 4.23% | 5.13% | (1.87)% | 14.26% | (0.28)% | 7.90 % | (2.34)% | 13.33% | 2.72% | 14.12% |
| 2023 | 4.68% | 13.25% | 1.09% | 2.26% | 4.10% | 3.48% | 4.09% | 13.99% | 2.31% | 7.30% | 0.85% | 11.29% | 2.83% | 13.79% |
| 2024 | 2.54% | 11.65% | 0.99% | 2.03% | 3.99% | 2.92% | 3.40% | 13.41% | 2.76% | 6.98% | 1.86% | 9.19% | 3.29% | 12.87% |
| 2025 | 2.18% | 10.62% | 0.35% | 1.82% | 3.90% | 4.05% | 3.47% | 13.31% | 2.34% | 6.91% | 1.88% | 7.83% | 3.43% | 12.13% |
| 2026 | 2.15% | 9.61% | (0.01)% | 1.78% | 3.84% | 3.93% | 3.46% | 13.40% | 2.28% | 6.85% | 1.83% | 7.85% | 3.51% | 11.71% |
Positive scenario of GDP, unemployment rate and HPI for the main geographies
| Spain | Mexico | Turkey | Peru | Argentina | Colombia | |||||||||
|---|---|---|---|---|---|---|---|---|---|---|---|---|---|---|
| Date | GDP | Unemployment | HPI | GDP | Unemployment | HPI | GDP | Unemployment | GDP | Unemployment | GDP | Unemployment | GDP | Unemployment |
| 2020 | (11.20)% | 16.44% | (1.44)% | (8.85)% | 4.57% | 1.71% | 2.07% | 13.45% | (11.74)% | 12.75% | (10.64)% | 13.60% | (6.80)% | 18.14% |
| 2021 | 6.63% | 16.03% | (3.28)% | 4.58% | 5.40% | (1.23)% | 9.08% | 12.60% | 12.56% | 10.29% | 9.95% | 14.39% | 6.80% | 16.14% |
| 2022 | 6.27% | 12.72% | 4.56% | 3.80% | 5.17% | 0.32% | 5.30% | 11.58% | 5.25% | 10.00% | 3.52% | 11.88% | 3.70% | 14.53% |
| 2023 | 2.95% | 10.82% | 5.79% | 1.62% | 5.04% | 0.31% | 4.13% | 11.58% | 3.68% | 8.73% | 2.08% | 8.99% | 3.15% | 14.28% |
| 2024 | 2.07% | 9.58% | 3.66% | 1.47% | 4.91% | 1.01% | 4.11% | 11.19% | 3.58% | 7.23% | 2.11% | 7.69% | 3.27% | 12.49% |
| 2025 | 2.01% | 8.55% | 3.57% | 1.47% | 4.76% | 1.72% | 4.10% | 10.85% | 3.35% | 6.88% | 2.14% | 6.78% | 3.60% | 12.28% |
Base scenario of GDP, unemployment rate and HPI for the main geographies
| Spain | Mexico | Turkey | Peru | Argentina | Colombia | |||||||||
|---|---|---|---|---|---|---|---|---|---|---|---|---|---|---|
| Date | GDP | Unemployment | HPI | GDP | Unemployment | HPI | GDP | Unemployment | GDP | Unemployment | GDP | Unemployment | GDP | Unemployment |
| 2020 | (11.48)% | 16.95% | (1.98)% | (9.25)% | 4.62% | 1.81% | (0.01)% | 13.98% | (13.04)% | 12.80% | (13.00)% | 13.98% | (7.51)% | 18.23% |
| 2021 | 5.99% | 17.51% | (5.08)% | 3.71% | 5.57% | (1.32)% | 5.52% | 14.05% | 10.05% | 10.48% | 5.54% | 15.40% | 5.48% | 16.40% |
| 2022 | 6.04% | 14.35% | 3.48% | 3.53% | 5.35% | 0.15% | 4.53% | 12.58% | 4.52% | 10.23% | 2.54% | 12.80% | 3.46% | 14.83% |
| 2023 | 2.93% | 12.41% | 5.44% | 1.55% | 5.19% | 0.31% | 4.01% | 11.95% | 3.69% | 8.93% | 1.98% | 9.60% | 3.15% | 14.57% |
| 2024 | 2.07% | 11,14% | 3,20% | 1,45% | 5,03% | 1,02% | 3,99% | 11,38% | 3,58% | 7,41% | 1,98% | 8,18% | 3,27% | 12,78% |
| 2025 | 2,01% | 9,99% | 3,12% | 1,46% | 4,88% | 1,71% | 3,98% | 11,03% | 3,35% | 7,06% | 2,01% | 7,28% | 3,60% | 12,55% |
Negative scenario of GDP, unemployment rate and HPI for the main geographies
| Spain | Mexico | Turkey | Peru | Argentina | Colombia | |||||||||
|---|---|---|---|---|---|---|---|---|---|---|---|---|---|---|
| Date | GDP | Unemployment | HPI | GDP | Unemployment | HPI | GDP | Unemployment | GDP | Unemployment | GDP | Unemployment | GDP | Unemployment |
| 2020 | (11.76)% | 17.44% | (2.60)% | (9.64)% | 4.67% | 1.89% | (2.10)% | 14.49% | (14.33)% | (12.85)% | (15.28)% | 14.34% | (8.25)% | 18.31% |
| 2021 | 5.37% | 18.94 % | (6.69) % | 2.84% | 5.75% | (1.48)% | 1.75% | 15.51% | 7.53% | 10.69% | 0.89% | 16.38% | 4.16% | 16.66% |
| 2022 | 5.82% | 15.92% | 2.49% | 3.25% | 5.53% | (0.06)% | 3.56% | 13.64% | 3.78 % | 10.48% | 1.33 % | 13.69 % | 3.16 % | 15.10 % |
| 2023 | 2.88% | 13.99% | 4.94% | 1.48% | 5.34% | 0.17% | 3.92% | 12.33% | 3.69 % | 9.15% | 1.86 % | 10.19 % | 3.15 % | 14.84% |
| 2024 | 2.03% | 12.70% | 2.45% | 1.41% | 5.17% | 0.99% | 3.91% | 11.56% | 3.57% | 7.62% | 1.83% | 8.63% | 3.27% | 13.04% |
| 2025 | 1.97% | 11.45% | 2.36% | 1.41% | 5.02% | 1.70% | 3.91% | 11.20% | 3.35% | 7.27% | 1.86% | 7.75% | 3.60% | 12.80% |
Sensitivity to macroeconomic scenarios
A sensitivity exercise has been carried out on the expected losses due to variations in the key hypotheses as they are the ones that introduce the greatest uncertainty in estimating such losses. As a first step, GDP and the House Price Index have been identified as the most relevant variables. These variables have been subjected to shocks of +/- 100 bps in their entire window with impact of the macro models. Independent sensitivities have been assessed, under the assumption of assigning a 100% probability to each determined scenario with these independent shocks.
Variation in expected loss is determined both by re-staging (that is: in worse scenarios due to the recognition of lifetime credit losses for additional operations that are transferred to stage 2 from stage 1 where 12 months of losses are valued: or vice versa in improvement scenarios) as well as variations in the collective risk parameters (PD and LGD) of each financial instrument due to the changes defined in the macroeconomic forecasts of the scenario.
Expected loss variation as of December 31, 2021
| BBVA Group | Spain | Mexico | Turkey | |||||||||||
|---|---|---|---|---|---|---|---|---|---|---|---|---|---|---|
| GDP | Total Portfolio | Retail | Mortgages | Wholesaler | Fixed income | Total Portfolio | Mortgages | Companies | Total Portfolio | Mortgages | Cards | Total Portfolio | Wholesale | Retail |
| -100pb | 3.55% | 3.47% | 3.72% | 3.91% | 1.58% | 3.72% | 4.39% | 3.96% | 3.91% | 2.20% | 6.30% | 1.56% | 1.58% | 1.62% |
| +100pb | (3.25)% | (3.14)% | (3.03)% | (3.69)% | (1.97)% | (3.32)% | (3.57)% | (3.53) % | (3.64)% | (2.07)% | (5.78)% | (1.47)% | (1.55)% | (1.47)% |
| Housing price | ||||||||||||||
| -100pb | 5.17% | 0.78% | 2.90% | |||||||||||
| +100pb | (5.11)% | (0.77)% | (2.73)% | |||||||||||
Expected loss variation as of December 31, 2020
| BBVA Group | Spain | Mexico | Turkey | |||||||||||
|---|---|---|---|---|---|---|---|---|---|---|---|---|---|---|
| GDP | Total Portfolio | Retail | Mortgages | Wholesaler | Fixed income | Total Portfolio | Mortgages | Companies | Total Portfolio | Mortgages | Cards | Total Portfolio | Wholesale | Retail |
| -100pb | 3.55% | 3.47% | 3.72% | 3.91% | 1.58% | 3.72% | 4.39% | 3.96% | 3.91% | 2.20% | 6.30% | 1.56% | 1.58% | 1.62% |
| +100pb | (3.25)% | (3.14)% | (3.03) % | (3.69)% | (1.97)% | (3.32)% | (3.57)% | (3.53)% | (3.64)% | (2.07)% | (5.78)% | (1.47)% | (1.55)% | (1.47)% |
| Housing price | ||||||||||||||
| -100pb | 5.41% | 0.79% | 3.13% | |||||||||||
| +100pb | (5.35)% | (0.77)% | (4.47)% | |||||||||||
Additional adjustments to expected loss measurement
In addition to what is described on individualized and collective estimates of expected losses and macroeconomic estimates, the Group may supplement the expected losses if it deems it necessary to account for the effects that may not be included, either by considering risk drivers or by the incorporation of sectorial particularities or that may affect a set of operations or borrowers. These adjustments should be temporary, until the reasons that motivated them disappear or materialize.
For this reason, the expected losses have been supplemented with additional amounts that have been considered necessary to collect the particular characteristics of borrowers, sectors or portfolios and that may not be identified in the general process. In order to incorporate those effects that are not included in the impairment models, management adjustments to the expected losses exist, which amounted to €311 million as of December 31, 2021 (€226 million in Spain, €18 million in Peru and €68 million in Mexico). As of December 31, 2020 there were €223 million in Spain. The variation in 2021 in Spain and Peru is driven by an additional provision given the possibility of new extensions in the financing granted or agreements aimed at ensuring business viability as well as a charge in Mexico for the anticipation of the potential credit deterioration following the expiration of payment deferrals.
7.2.2 Credit risk exposure
In accordance with IFRS 7 “Financial instruments: Disclosures”, the BBVA Group’s credit risk exposure by headings in the balance sheets as of December 31, 2021, 2020 and 2019 is provided below. It does not consider the loss allowances and the availability of collateral or other credit enhancements to guarantee compliance with payment obligations. The details are broken down by financial instruments and counterparties:
Maximum credit risk exposure (Millions of Euros)
| Notes | December 2021 | Stage 1 | Stage 2 | Stage 3 | |
|---|---|---|---|---|---|
| Financial assets held for trading | 92,560 | ||||
| Equity instruments | 10 | 15,963 | |||
| Debt securities | 10 | 25,790 | |||
| Loans and advances | 10 | 50,807 | |||
| Non-trading financial assets mandatorily at fair value through profit or loss | 6,086 | ||||
| Equity instruments | 11 | 5,303 | |||
| Debt securities | 11 | 128 | |||
| Loans and advances | 11 | 655 | |||
| Financial assets designated at fair value through profit or loss | 12 | 1,092 | |||
| Derivatives (trading and hedging) | 43,687 | ||||
| Financial assets at fair value through other comprehensive income | 60,495 | ||||
| Equity instruments | 13 | 1,320 | |||
| Debt securities | 59,148 | 58,587 | 561 | — | |
| Loans and advances to credit institutions | 13 | 27 | 27 | — | — |
| Financial assets at amortized cost | 383,870 | 334,772 | 34,418 | 14,680 | |
| Debt securities | 34,833 | 34,605 | 205 | 22 | |
| Loans and advances to central banks | 5,687 | 5,687 | — | — | |
| Loans and advances to credit institutions | 13,295 | 13,285 | 10 | — | |
| Loans and advances to customers | 330,055 | 281,195 | 34,203 | 14,657 | |
| Total financial assets risk | 587,789 | — | — | — | |
| Total loan commitments and financial guarantees | 165,941 | 152,914 | 12,070 | 957 | |
| Loan commitments given | 33 | 119,618 | 112,494 | 6,953 | 171 |
| Financial guarantees given | 33 | 11,720 | 10,146 | 1,329 | 245 |
| Other commitments given | 33 | 34,604 | 30,274 | 3,789 | 541 |
| Total maximum credit exposure | 753,730 |
Maximum credit risk exposure (Millions of Euros)
| Notes | December 2020 | Stage 1 | Stage 2 | Stage 3 | |
|---|---|---|---|---|---|
| Financial assets held for trading | 65,696 | ||||
| Equity instruments | 10 | 11,458 | |||
| Debt securities | 10 | 23,970 | |||
| Loans and advances | 10 | 30,268 | |||
| Non-trading financial assets mandatorily at fair value through profit or loss | 5,198 | ||||
| Equity instruments | 11 | 4,133 | |||
| Debt securities | 11 | 356 | |||
| Loans and advances | 11 | 709 | |||
| Financial assets designated at fair value through profit or loss | 12 | 1,117 | |||
| Derivatives (trading and hedging) | 46,302 | ||||
| Financial assets at fair value through other comprehensive income | 69,537 | ||||
| Equity instruments | 13 | 1,100 | |||
| Debt securities | 68,404 | 67,995 | 410 | — | |
| Loans and advances to credit institutions | 13 | 33 | 33 | — | — |
| Financial assets at amortized cost | 379,857 | 334,552 | 30,607 | 14,698 | |
| Debt securities | 35,785 | 35,759 | 6 | 20 | |
| Loans and advances to central banks | 6,229 | 6,229 | — | — | |
| Loans and advances to credit institutions | 14,591 | 14,565 | 20 | 6 | |
| Loans and advances to customers | 323,252 | 277,998 | 30,581 | 14,672 | |
| Total financial assets risk | 567,705 | ||||
| Total loan commitments and financial guarantees | 179,440 | 165,726 | 12,682 | 1,032 | |
| Loan commitments given | 33 | 132,584 | 124,104 | 8,214 | 265 |
| Financial guarantees given | 33 | 10,665 | 9,208 | 1,168 | 290 |
| Other commitments given | 33 | 36,190 | 32,414 | 3,300 | 477 |
| Total maximum credit exposure | 747,145 |
Maximum credit risk exposure (Millions of Euros)
| Notes | December 2019 | Stage 1 | Stage 2 | Stage 3 | |
|---|---|---|---|---|---|
| Financial assets held for trading | 67,238 | ||||
| Equity instruments | 10 | 8,892 | |||
| Debt securities | 10 | 26,309 | |||
| Loans and advances | 10 | 32,037 | |||
| ANon-trading financial assets mandatorily at fair value through profit or loss | 5,557 | ||||
| Equity instruments | 11 | 4,327 | |||
| Debt securities | 11 | 110 | |||
| Loans and advances | 11 | 1,120 | |||
| Financial assets designated at fair value through profit or loss | 12 | 1,214 | |||
| Derivatives (trading and hedging) | 39,462 | ||||
| Financial assets at fair value through other comprehensive income | 61,293 | ||||
| Equity instruments | 13 | 2,420 | |||
| Debt securities | 58,841 | 58,590 | 250 | — | |
| Loans and advances to credit institutions | 13 | 33 | 33 | — | — |
| Financial assets at amortized cost | 451,640 | 402,024 | 33,624 | 15,993 | |
| Debt securities | 38,930 | 38,790 | 106 | 33 | |
| Loans and advances to central banks | 4,285 | 4,285 | — | — | |
| Loans and advances to credit institutions | 13,664 | 13,500 | 158 | 6 | |
| Loans and advances to customers | 394,763 | 345,449 | 33,360 | 15,954 | |
| Total financial assets risk | 626,404 | ||||
| Total loan commitments and financial guarantees | 181,116 | 169,663 | 10,452 | 1,001 | |
| Loan commitments given | 33 | 130,923 | 123,707 | 6,945 | 270 |
| Financial guarantees given | 33 | 10,984 | 9,804 | 955 | 224 |
| Other commitments given | 33 | 39,209 | 36,151 | 2,552 | 506 |
| Total maximum credit exposure | 807,520 |
The maximum credit exposure presented in the table above is determined by type of financial asset as explained below:
- In the case of financial instruments recognized in the consolidated balance sheets, exposure to credit risk is considered equal to its carrying amount (not including loss allowances) with the only exception of trading and hedging derivatives.
- The maximum credit risk exposure on financial commitments and guarantees granted is the maximum that the Group would be liable for if these guarantees were called in, or the higher amount pending to be disposed from the customer in the case of commitments.
- The calculation of risk exposure for derivatives is based on the sum of two factors: the derivatives fair value and their potential risk (or "add-on").
The breakdown by geographical location and Stage of the maximum credit risk exposure, the accumulated allowances recorded and the carrying amount of the loans and advances to customers as of December 31, 2021, 2020 and 2019 is shown below:
December 2021 (Millions of Euros)
| Gross exposure | Accumulated allowances | Carrying amount | ||||||||||
|---|---|---|---|---|---|---|---|---|---|---|---|---|
| Total | Stage 1 | Stage 2 | Stage 3 | Total | Stage 1 | Stage 2 | Stage 3 | Total | Stage 1 | Stage 2 | Stage 3 | |
| Spain (*) | 201,405 | 171,883 | 21,380 | 8,143 | (5,277) | (722) | (923) | (3,631) | 196,129 | 171,161 | 20,457 | 4,511 |
| Mexico | 57,847 | 51,665 | 4,261 | 1,921 | (2,038) | (740) | (381) | (916) | 55,809 | 50,925 | 3,880 | 1,005 |
| Turkey (**) | 33,472 | 26,497 | 4,134 | 2,841 | (2,058) | (224) | (424) | (1,410) | 31,414 | 26,273 | 3,711 | 1,431 |
| South America (***) | 36,335 | 30,166 | 4,425 | 1,744 | (1,736) | (277) | (362) | (1,096) | 34,599 | 29,889 | 4,062 | 648 |
| Others | 996 | 984 | 3 | 9 | (8) | (1) | — | (7) | 988 | 983 | 3 | 2 |
| Total (****) | 330,055 | 281,195 | 34,203 | 14,657 | (11,116) | (1,964) | (2,091) | (7,061) | 318,939 | 279,231 | 32,112 | 7,596 |
| Of which: individual | (2,528) | (4) | (657) | (1,867) | ||||||||
| Of which: collective | (8,587) | (1,959) | (1,434) | (5,194) | ||||||||
(*) Spain includes all countries where BBVA, S.A. operates.
(**) Turkey includes all countries in which Garanti BBVA operates.
(***) In South America, BBVA Group operates mainly in Argentina, Colombia, Peru and Uruguay.
(****) The amount of the accumulated allowances includes the provisions recorded for credit risk over the remaining expected lifetime of purchased financial instruments. Those provisions were determined at the moment of the Purchase Price Allocation and were originated mainly in the acquisition of Catalunya Banc S.A. (as of December 31, 2021, the remaining balance was €266 million). These valuation adjustments are recognized in the consolidated income statement during the residual life of the operations or are applied to the value corrections when the losses materialize.
December 2020 (Millions of Euros)
| Gross exposure | Accumulated allowances | Carrying amount | ||||||||||
|---|---|---|---|---|---|---|---|---|---|---|---|---|
| Total | Stage 1 | Stage 2 | Stage 3 | Total | Stage 1 | Stage 2 | Stage 3 | Total | Stage 1 | Stage 2 | Stage 3 | |
| Spain (*) | 195,983 | 171,397 | 16,387 | 8,199 | (5,679) | (753) | (849) | (4,077) | 190,304 | 170,644 | 15,538 | 4,122 |
| Mexico | 52,211 | 46,373 | 4,071 | 1,767 | (2,211) | (685) | (442) | (1,083) | 50,000 | 45,688 | 3,628 | 684 |
| Turkey (**) | 39,633 | 30,832 | 5,806 | 2,995 | (2,338) | (246) | (535) | (1,557) | 37,295 | 30,586 | 5,272 | 1,438 |
| South America (***) | 34,499 | 28,484 | 4,312 | 1,703 | (1,870) | (320) | (460) | (1,090) | 32,629 | 28,165 | 3,852 | 612 |
| Others | 925 | 912 | 5 | 8 | (7) | (1) | — | (6) | 918 | 911 | 4 | 2 |
| Total (****) | 323,252 | 277,998 | 30,581 | 14,672 | (12,105) | (2,005) | (2,287) | (7,813) | 311,147 | 275,993 | 28,294 | 6,860 |
| Of which: individual | (2,611) | (10) | (479) | (2,122) | ||||||||
| Of which: collective | (9,494) | (1,995) | (1,808) | (5,691) | ||||||||
- (*) Spain includes all countries where BBVA, S.A. operates.
- (**) Turkey includes all countries in which Garanti BBVA operates.
- (***) In South America, BBVA Group operates mainly in Argentina, Colombia, Peru and Uruguay.
- (****) The amount of the accumulated allowances includes the provisions recorded for credit risk over the remaining expected lifetime of purchased financial instruments. Those provisions were determined at the moment of the Purchase Price Allocation and were originated mainly in the acquisition of Catalunya Banc S.A. (as of December 31, 2020 the remaining balance was €363 million). These valuation adjustments are recognized in the consolidated income statement during the residual life of the operations or are applied to the value corrections when the losses materialize.
December 2019 (Millions of Euros)
| Gross exposure | Accumulated allowances | Carrying amount | ||||||||||
|---|---|---|---|---|---|---|---|---|---|---|---|---|
| Total | Stage 1 | Stage 2 | Stage 3 | Total | Stage 1 | Stage 2 | Stage 3 | Total | Stage 1 | Stage 2 | Stage 3 | |
| Spain (*) | 197,058 | 173,843 | 14,599 | 8,616 | (5,311) | (712) | (661) | (3,939) | 191,747 | 173,131 | 13,939 | 4,677 |
| The United States | 57,387 | 49,744 | 7,011 | 632 | (688) | (165) | (342) | (182) | 56,699 | 49,580 | 6,670 | 450 |
| Mexico | 60,099 | 54,748 | 3,873 | 1,478 | (2,013) | (697) | (404) | (912) | 58,087 | 54,052 | 3,469 | 566 |
| Turkey (**) | 43,113 | 34,536 | 5,127 | 3,451 | (2,613) | (189) | (450) | (1,974) | 40,500 | 34,347 | 4,677 | 1,477 |
| South America (***) | 36,265 | 31,754 | 2,742 | 1,769 | (1,769) | (366) | (323) | (1,079) | 34,497 | 31,388 | 2,419 | 690 |
| Others | 839 | 824 | 7 | 9 | (8) | (1) | (1) | (6) | 832 | 823 | 6 | 2 |
| Total (****) | 394,763 | 345,449 | 33,360 | 15,954 | (12,402) | (2,129) | (2,181) | (8,093) | 382,360 | 343,320 | 31,179 | 7,861 |
| Of which: individual | (2,795) | (6) | (347) | (2,441) | ||||||||
| Of which: collective | (9,608) | (2,123) | (1,834) | (5,652) | ||||||||
- (*) Spain includes all countries where BBVA, S.A. operates.
- (**) Turkey includes all countries in which Garanti BBVA operates.
- (***) In South America, BBVA Group operates mainly in Argentina, Colombia, Peru and Uruguay.
- (****) The amount of the accumulated allowances includes the provisions recorded for credit risk over the remaining expected lifetime of purchased financial instruments. Those provisions were determined at the moment of the Purchase Price Allocation and were originated mainly in the acquisition of Catalunya Banc S.A. (as of December 31, 2019 the remaining balance was €433 million). These valuation adjustments are recognized in the consolidated income statement during the residual life of the operations or are applied to the value corrections when the losses materialize.
The breakdown by counterparty of the maximum credit risk exposure, the accumulated allowances recorded, as well as the carrying amount by stages of loans and advances to customers as of December 31, 2021, 2020 and 2019 is shown below:
December 2021 (Millions of Euros)
| Gross exposure | Accumulated allowances | Net amount | ||||||||||
|---|---|---|---|---|---|---|---|---|---|---|---|---|
| Total | Stage 1 | Stage 2 | Stage 3 | Total | Stage 1 | Stage 2 | Stage 3 | Total | Stage 1 | Stage 2 | Stage 3 | |
| Public administrations | 19,719 | 19,287 | 369 | 62 | (37) | (13) | (5) | (19) | 19,682 | 19,274 | 364 | 43 |
| Other financial corporations | 9,826 | 9,672 | 131 | 24 | (23) | (8) | (6) | (9) | 9,804 | 9,664 | 125 | 15 |
| Non-financial corporations | 146,797 | 120,140 | 19,366 | 7,290 | (5,804) | (759) | (1,306) | (3,738) | 140,993 | 119,381 | 18,060 | 3,552 |
| Households | 153,714 | 132,096 | 14,336 | 7,281 | (5,253) | (1,184) | (773) | (3,295) | 148,461 | 130,912 | 13,563 | 3,986 |
| Loans and advances to customers | 330,055 | 281,195 | 34,203 | 14,657 | (11,116) | (1,964) | (2,091) | (7,061) | 318,939 | 279,231 | 32,112 | 7,596 |
December 2020 (Millions of Euros)
| Gross exposure | Accumulated allowances | Net amount | ||||||||||
|---|---|---|---|---|---|---|---|---|---|---|---|---|
| Total | Stage 1 | Stage 2 | Stage 3 | Total | Stage 1 | Stage 2 | Stage 3 | Total | Stage 1 | Stage 2 | Stage 3 | |
| Public administrations | 19,439 | 19,163 | 200 | 76 | (48) | (14) | (9) | (25) | 19,391 | 19,149 | 191 | 51 |
| Other financial corporations | 9,856 | 9,747 | 95 | 14 | (39) | (25) | (6) | (7) | 9,817 | 9,722 | 88 | 7 |
| Non-financial corporations | 142,547 | 119,891 | 15,179 | 7,477 | (6,123) | (774) | (1,110) | (4,239) | 136,424 | 119,117 | 14,069 | 3,238 |
| Households | 151,410 | 129,196 | 15,108 | 7,106 | (5,895) | (1,192) | (1,161) | (3,542) | 145,515 | 128,005 | 13,946 | 3,564 |
| Loans and advances to customers | 323,252 | 277,998 | 30,581 | 14,672 | (12,105) | (2,005) | (2,287) | (7,813) | 311,147 | 275,993 | 28,294 | 6,860 |
December 2019 (Millions of Euros)
| Gross exposure | Accumulated allowances | Net amount | ||||||||||
|---|---|---|---|---|---|---|---|---|---|---|---|---|
| Total | Stage 1 | Stage 2 | Stage 3 | Total | Stage 1 | Stage 2 | Stage 3 | Total | Stage 1 | Stage 2 | Stage 3 | |
| Public administrations | 28,281 | 27,511 | 682 | 88 | (59) | (15) | (22) | (21) | 28,222 | 27,496 | 660 | 66 |
| Other financial corporations | 11,239 | 11,085 | 136 | 17 | (31) | (19) | (2) | (10) | 11,207 | 11,066 | 134 | 8 |
| Non-financial corporations | 173,254 | 148,768 | 16,018 | 8,468 | (6,465) | (811) | (904) | (4,750) | 166,789 | 147,957 | 15,114 | 3,718 |
| Households | 181,989 | 158,085 | 16,523 | 7,381 | (5,847) | (1,283) | (1,252) | (3,312) | 176,142 | 156,801 | 15,272 | 4,069 |
| Loans and advances to customers | 394,763 | 345,449 | 33,360 | 15,954 | (12,402) | (2,129) | (2,181) | (8,093) | 382,360 | 343,320 | 31,179 | 7,861 |
The breakdown by counterparty and product of loans and advances, net of loss allowances, as well as the gross carrying amount by type of product, classified in different headings of the assets, as of December 31, 2021, 2020 and 2019 is shown below:
December 2021 (Millions of Euros)
| Central banks | General governments | Credit institutions | Other financial corporations | Non-financial corporations | Households | Total | Gross carrying amount | |
|---|---|---|---|---|---|---|---|---|
| On demand and short notice | — | 6 | — | 321 | 2,339 | 495 | 3,161 | 3,345 |
| Credit card debt | — | — | — | 1 | 1,504 | 12,523 | 14,030 | 14,949 |
| Commercial debtors | 791 | — | 476 | 18,191 | 66 | 19,524 | 19,766 | |
| Finance leases | — | 191 | — | 14 | 7,388 | 317 | 7,911 | 8,256 |
| Reverse repurchase loans | 1,192 | — | 2,788 | 23 | — | — | 4,004 | 4,013 |
| Other term loans | 4,174 | 18,440 | 4,004 | 5,413 | 110,204 | 134,505 | 276,739 | 286,127 |
| Advances that are not loans | 315 | 394 | 6,510 | 3,554 | 1,805 | 630 | 13,208 | 13,263 |
| LOANS AND ADVANCES | 5,681 | 19,822 | 13,303 | 9,804 | 141,431 | 148,536 | 338,577 | 349,719 |
| By secured loans | ||||||||
| Of which: mortgage loans collateralized by immovable property | 324 | — | 220 | 21,531 | 94,821 | 116,897 | 119,980 | |
| Of which: other collateralized loans | 1,180 | 1,413 | 2,534 | 390 | 3,512 | 1,950 | 10,979 | 11,335 |
| By purpose of the loan | ||||||||
| Of which: credit for consumption | 42,294 | 42,294 | 45,236 | |||||
| Of which: lending for house purchase | 95,209 | 95,209 | 96,612 | |||||
| By subordination | ||||||||
| Of which: project finance loans | 8,863 | 8,863 | 9,423 |
December 2020 (Millions of Euros)
| Central banks | General governments | Credit institutions | Other financial corporations | Non-financial corporations | Households | Total | Gross carrying amount | |
|---|---|---|---|---|---|---|---|---|
| On demand and short notice | — | 7 | — | 502 | 1,798 | 528 | 2,835 | 3,021 |
| Credit card debt | — | — | — | 2 | 1,485 | 11,605 | 13,093 | 14,220 |
| Commercial debtors | 898 | — | 317 | 14,262 | 67 | 15,544 | 15,796 | |
| Finance leases | — | 197 | — | 6 | 7,125 | 322 | 7,650 | 8,013 |
| Reverse repurchase loans | 472 | — | 1,914 | — | 71 | — | 2,457 | 2,463 |
| Other term loans | 5,690 | 18,111 | 3,972 | 5,799 | 111,141 | 132,603 | 277,317 | 287,467 |
| Advances that are not loans | 48 | 260 | 8,721 | 3,191 | 1,084 | 473 | 13,777 | 13,833 |
| LOANS AND ADVANCES | 6,209 | 19,475 | 14,608 | 9,817 | 136,966 | 145,598 | 332,672 | 344,813 |
| By secured loans | ||||||||
| Of which: mortgage loans collateralized by immovable property | 372 | — | 209 | 22,091 | 94,147 | 116,819 | 120,194 | |
| Of which: other collateralized loans | 472 | 952 | — | 317 | 3,763 | 2,059 | 7,562 | 7,776 |
| By purpose of the loan | ||||||||
| Of which: credit for consumption | 39,799 | 39,799 | 43,037 | |||||
| Of which: lending for house purchase | 94,098 | 94,098 | 95,751 | |||||
| By subordination | ||||||||
| Of which: project finance loans | 10,721 | 10,721 | 11,032 |
December 2019 (Millions of Euros)
| Central banks | General governments | Credit institutions | Other financial corporations | Non-financial corporations | Households | Total | Gross carrying amount |
|
|---|---|---|---|---|---|---|---|---|
| On demand and short notice | — | 9 | — | 118 | 2,328 | 595 | 3,050 | 3,251 |
| Credit card debt | — | 10 | 1 | 3 | 1,940 | 14,401 | 16,355 | 17,608 |
| Commercial debtors | 971 | — | 230 | 15,976 | 99 | 17,276 | 17,617 | |
| Finance leases | — | 227 | — | 6 | 8,091 | 387 | 8,711 | 9,095 |
| Reverse repurchase loans | — | — | 1,817 | — | 26 | — | 1,843 | 1,848 |
| Other term loans | 4,240 | 26,734 | 4,121 | 7,795 | 137,934 | 160,223 | 341,047 | 351,230 |
| Advances that are not loans | 35 | 865 | 7,743 | 3,056 | 951 | 506 | 13,156 | 13,214 |
| LOANS AND ADVANCES | 4,275 | 28,816 | 13,682 | 11,208 | 167,246 | 176,211 | 401,438 | 413,863 |
| By secured loans | ||||||||
| Of which: mortgage loans collateralized by immovable property | 1,067 | 15 | 261 | 23,575 | 111,085 | 136,003 | 139,317 | |
| Of which: other collateralized loans | — | 10,447 | 93 | 2,106 | 29,009 | 6,893 | 48,548 | 49,266 |
| By purpose of the loan | ||||||||
| Of which: credit for consumption | 46,356 | 46,356 | 49,474 | |||||
| Of which: lending for house purchase | 110,178 | 110,178 | 111,636 | |||||
| By subordination | ||||||||
| Of which: project finance loans | 12,259 | 12,259 | 12,415 |
7.2.3 Mitigation of credit risk, collateralized credit risk and other credit enhancements
In certain cases, maximum credit risk exposure is reduced by collateral, credit enhancements and other actions which mitigate the Group’s exposure. The BBVA Group applies a credit risk hedging and mitigation policy deriving from a banking approach focused on relationship banking. The existence of guarantees could be a necessary but not sufficient instrument for accepting risks, as the assumption of risks by the Group requires prior evaluation of the debtor’s capacity for repayment, or that the debtor can generate sufficient resources to allow the amortization of the risk incurred under the agreed terms.
The policy of accepting risks is therefore organized into three different levels in the BBVA Group:
- Analysis of the financial risk of the transaction, based on the debtor’s capacity for repayment or generation of funds.
- The constitution of guarantees that are adequate, or at any rate generally accepted, for the risk assumed, in any of the generally accepted forms: monetary, secured, personal or hedge guarantees; and finally.
- Assessment of the repayment risk (asset liquidity) of the guarantees received.
This is carried out through a prudent risk policy that consists of the analysis of the financial risk, based on the capacity for reimbursement or generation of resources of the borrower, the analysis of the guarantee, assessing, among others, the efficiency, the robustness and the risk, the adequacy of the guarantee with the operation and other aspects such as the location, currency, concentration or the existence of limitations. Additionally, the necessary tasks for the constitution of guarantees must be carried out - in any of the generally accepted forms (collaterals, personal guarantees and financial hedge instruments) - appropriate to the risk assumed.
The procedures for the management and valuation of collateral are set out in the corporate general policies (retail and wholesale), which establish the basic principles for credit risk management, including the management of collaterals assigned in transactions with customers. The criteria for the systematic, standardized and effective treatment of collateral in credit transaction procedures in BBVA Group’s wholesale and retail banking are included in the Specific Collateral Rules.
The methods used to value the collateral are in line with the best market practices and imply the use of appraisal of real-estate collateral, the market price in market securities, the trading price of shares in mutual funds, etc. All the collaterals received must be correctly assigned and entered in the corresponding register. They must also have the approval of the Group’s legal units.
The valuation of the collateral is taken into account in the calculation of the expected losses. The Group has developed internal models to estimate the realization value of the collaterals received, the time that elapses until then, the costs for their acquisition, maintenance and subsequent sale, from real observations based on its own experience. This modeling is part of the LGD estimation processes that are applied to the different segments, and is included within the annual review and validation procedures.
The following is a description of the main types of collateral for each financial instrument class:
- Debt instruments held for trading: The guarantees or credit enhancements obtained directly from the issuer or counterparty are implicit in the clauses of the instrument (mainly guarantees of the issuer).
- Derivatives and hedging derivatives: In derivatives, credit risk is minimized through contractual netting agreements, where positive- and negative-value derivatives with the same counterparty are offset for their net balance. There may likewise be other kinds of guarantees and collaterals, depending on counterparty solvency and the nature of the transaction (mainly collaterals).
- The summary of the offsetting effect (via netting and collateral) for derivatives and securities operations as of December 31, 2021 is presented in Note 7.4.2.
- Other financial assets designated at fair value through profit or loss and financial assets at fair value through other comprehensive income: The guarantees or credit enhancements obtained directly from the issuer or counterparty are inherent to the structure of the instrument (mainly personal guarantees).
As of December 31, 2021, 2020 and 2019, BBVA Group had no credit risk exposure of impaired financial assets at fair value through other comprehensive income (see Note 7.2.2).
- Financial assets at amortized cost:
- Loans and advances to credit institutions: These usually have the counterparty’s personal guarantee or pledged securities in the case of repos.
- Loans and advances to customers: Most of these loans and advances are backed by personal guarantees extended by the customer. There may also be collateral to secure loans and advances to customers (such as mortgages, cash collaterals, pledged securities and other collateral), or to obtain other credit enhancements (bonds or insurances).
- Debt securities: The guarantees or credit enhancements obtained directly from the issuer or counterparty are inherent to the structure of the instrument.
- Financial guarantees, other contingent risks and drawable by third parties: these have the counterparty’s personal guarantee or other types of collaterals.
The disclosure of impaired loans and advances at amortized cost covered by collateral (see Note 7.2.6), by type of collateral, as of December 31, 2021, 2020 and 2019, is the following:
Impaired loans and advances at amortized cost covered by collateral (Millions of Euros)
| Maximum exposure to credit risk |
Of which secured by collateral | |||||
|---|---|---|---|---|---|---|
| Residential properties |
Commercial properties |
Cash | Others | Financial | ||
| December 2021 | 14,657 | 2,875 | 1,068 | 5 | 33 | 886 |
| December 2020 | 14,678 | 2,717 | 789 | 18 | 52 | 575 |
| December 2019 | 15,959 | 3,396 | 939 | 35 | 221 | 542 |
The value of guarantees received as of December 31, 2021, 2020 and 2019, is the following:
Guarantees received (Millions of Euros)
| 2021 | 2020 | 2019 | |
|---|---|---|---|
| Value of collateral | 117,362 | 116,900 | 152,454 |
| Of which: guarantees normal risks under special monitoring | 11,768 | 11,296 | 14,623 |
| Of which: guarantees non-performing risks | 3,981 | 3,577 | 4,590 |
| Value of other guarantees | 48,680 | 47,012 | 35,464 |
| Of which: guarantees normal risks under special monitoring | 7,404 | 4,045 | 3,306/td> |
| Of which: guarantees non-performing risks | 886 | 575 | 542 |
| Total value of guarantees received | 166,042 | 163,912 | 187,918 |
The maximum credit risk exposure of impaired financial guarantees and other commitments at December 31, 2021, 2020 and 2019 amounts to €957, €1,032 and €1,001 million, respectively (see Note 7.2.2).
7.2.4 Credit quality of financial assets that are neither past due nor impaired
The BBVA Group has tools that enable it to rank the credit quality of its transactions and customers based on an assessment and its correspondence with the probability of default (“PD”) scales. To analyze the performance of PD, the Group has a series of tracking tools and historical databases that collect the pertinent internally generated information. These tools can be grouped together into scoring and rating models.
Scoring
Scoring is a decision-making model that contributes to both the arrangement and management of retail loans: consumer loans, mortgages, credit cards for individuals, etc. Scoring is the tool used to decide to originate a loan, what amount should be originated and what strategies can help establish the price, because it is an algorithm that sorts transactions by their credit quality. This algorithm enables the BBVA Group to assign a score to each transaction requested by a customer, on the basis of a series of objective characteristics that have statistically been shown to distinguish between the quality and risk of this type of transactions. The advantage of scoring lies in its simplicity and homogeneity: all that is needed is a series of objective data for each customer, and this data is analyzed automatically using an algorithm.
There are three types of scoring, based on the information used and on its purpose:
- Reactive scoring: measures the risk of a transaction requested by an individual using variables relating to the requested transaction and to the customer’s socio-economic data available at the time of the request. The new transaction is approved or rejected depending on the score.
- Behavioral scoring: scores transactions for a given product in an outstanding risk portfolio of the entity, enabling the credit rating to be tracked and the customer’s needs to be anticipated. It uses transaction and customer variables available internally. Specifically, variables that refer to the behavior of both the product and the customer.
- Proactive scoring: gives a score at customer level using variables related to the individual’s general behavior with the entity, and to his/her payment behavior in all the contracted products. The purpose is to track the customer’s credit quality and it is used to pre-approve new transactions.
Rating
Rating tools, as opposed to scoring tools, do not assess transactions but focus on the rating of customers instead: companies, corporations, SMEs, general governments, etc. A rating tool is an instrument that, based on a detailed financial study, helps determine a customer’s ability to meet his/her financial obligations. The final rating is usually a combination of various factors: on one hand, quantitative factors, and on the other hand, qualitative factors. It is a middle road between an individual analysis and a statistical analysis.
The main difference between ratings and scorings is that the latter are used to assess retail products, while ratings use a wholesale banking customer approach. Moreover, scorings only include objective variables, while ratings add qualitative information. And although both are based on statistical studies, adding a business view, rating tools give more weight to the business criterion compared to scoring tools.
For portfolios where the number of defaults is low (sovereign risk, corporates, financial entities, etc.) the internal information is supplemented by “benchmarking” of the external rating agencies (Moody’s, Standard & Poor’s and Fitch). To this end, each year the PDs compiled by the rating agencies at each level of risk rating are compared, and the measurements compiled by the various agencies are mapped against those of the BBVA master rating scale.
The probability of default of transactions or customers is calibrated with a long-term view, since its purpose is to measure the risk quality beyond its time of estimation, seeking to capture information representative of the behavior of the portfolios during a complete economic cycle (a long-term average probability of default). This probability is mapped to the master scale developed by the BBVA Group in order to facilitate a homogeneous classification of its different risk portfolios.
The table below shows the abridged scale used to classify the BBVA Group’s outstanding risk as of December 31, 2021:
| Internal rating | Probability of default (basis points) |
||
|---|---|---|---|
| Reduced List (22 groups) | Average | Minimum from >= |
Maximum |
| AAA | 1 | — | 2 |
| AA+ | 2 | 2 | 3 |
| AA | 3 | 3 | 4 |
| AA— | 4 | 4 | 5 |
| A+ | 5 | 5 | 6 |
| A | 8 | 6 | 9 |
| A— | 10 | 9 | 11 |
| BBB+ | 14 | 11 | 17 |
| BBB | 20 | 17 | 24 |
| BBB— | 31 | 24 | 39 |
| BB+ | 51 | 39 | 67 |
| BB | 88 | 67 | 116 |
| BB— | 150 | 116 | 194 |
| B+ | 255 | 194 | 335 |
| B | 441 | 335 | 581 |
| B— | 785 | 581 | 1,061 |
| CCC+ | 1,191 | 1,061 | 1,336 |
| CCC | 1,500 | 1,336 | 1,684 |
| CCC— | 1,890 | 1,684 | 2,121 |
| CC+ | 2,381 | 2,121 | 2,673 |
| CC | 3,000 | 2,673 | 3,367 |
| CC— | 3,780 | 3,367 | 4,243 |
These different levels and their probability of default were calculated by using as a reference the rating scales and default rates provided by the external agencies Standard & Poor’s and Moody’s. These calculations establish the levels of probability of default for the BBVA Group’s Master Rating Scale. Although this scale is common to the entire Group, the calibrations (mapping scores to PD sections/Master Rating Scale levels) are carried out at tool level for each country in which the Group has tools available.
The table below outlines the distribution by probability of default within 12 months and through the lifetime of the asset, and stages of the gross carrying amount of loans and advances to customers in percentage terms of the BBVA Group as of December 31, 2021, 2020 and 2019:
Probability of default (basis points)
| 2021 | 2020 | 2019 | ||||
|---|---|---|---|---|---|---|
| Subject to 12 month ECL (Stage 1) | Subject to lifetime ECL (Stage 2) | Subject to 12 month ECL (Stage 1) | Subject to lifetime ECL (Stage 2) | Subject to 12 month ECL (Stage 1) | Subject to lifetime ECL (Stage 2) | |
| % | % | % | % | % | % | |
| 0 to 2 | 5.8 | — | 4.0 | — | 5.5 | — |
| 2 to 5 | 15.7 | 0.1 | 10.2 | 0.1 | 6.3 | — |
| 5 to 11 | 15.2 | 0.2 | 7.7 | 0.1 | 14.6 | 0.2 |
| 11 to 39 | 18.7 | 0.6 | 26.8 | 0.5 | 24.5 | 0.8 |
| 39 to 194 | 19.1 | 2.5 | 24.0 | 2.3 | 24.5 | 1.6 |
| 194 to 1,061 | 12.2 | 3.8 | 15.1 | 3.4 | 14.0 | 3.6 |
| 1,061 to 2,121 | 1.9 | 1.5 | 1.5 | 1.2 | 1.4 | 1.2 |
| >2,121 | 0.8 | 1.9 | 0.6 | 2.5 | 0.4 | 1.5 |
| Total | 89.4 | 10.6 | 89.9 | 10.1 | 91.0 | 9.0 |
7.2.5 Impaired loan risks
The breakdown of loans and advances within financial assets at amortized cost, by impaired amount, accumulated impairment, gross carrying amount and by counterparties, as of December 31, 2021, 2020 and 2019 is as follows:
December 2021 (Millions of Euros)
| Gross carrying amount | Impaired loans and advances | Accumulated impairment | Impaired loans and advances as a % of the total | |
|---|---|---|---|---|
| Central banks | 5,687 | — | (6) | -% |
| General governments | 19,719 | 62 | (37) | 0.3% |
| Credit institutions | 13,295 | — | (19) | -% |
| Other financial corporations | 9,826 | 24 | (23) | 0.2% |
| Non-financial corporations | 146,797 | 7,290 | (5,804) | 5.0% |
| Agriculture, forestry and fishing | 4,077 | 125 | (154) | 3.1% |
| Mining and quarrying | 4,889 | 222 | (130) | 4.5% |
| Manufacturing | 35,058 | 1,003 | (867) | 2.9% |
| Electricity, gas, steam and air conditioning supply | 13,718 | 570 | (489) | 4.2% |
| Water supply | 782 | 22 | (21) | 2.9% |
| Construction | 8,336 | 894 | (619) | 10.7% |
| Wholesale and retail trade | 25,856 | 1,311 | (1,104) | 5.1% |
| Transport and storage | 10,310 | 879 | (400) | 8,5% |
| Accommodation and food service activities | 7,693 | 470 | (405) | 6.1% |
| Information and communications | 6,533 | 117 | (56) | 1.8% |
| Financial and insurance activities | 6,216 | 197 | (181) | 3.2% |
| Real estate activities | 9,438 | 719 | (466) | 7.6% |
| Professional, scientific and technical activities | 3,910 | 185 | (152) | 4.7% |
| Administrative and support service activities | 3,046 | 181 | (132) | 5.9% |
| Public administration and defense; compulsory social security | 203 | 9 | (11) | 4.5% |
| Education | 582 | 43 | (34) | 7.4% |
| Human health services and social work activities | 1,888 | 48 | (41) | 2.5% |
| Arts, entertainment and recreation | 1,011 | 209 | (95) | 20.7% |
| Other services | 3,250 | 84 | (447) | 2.6% |
| Households | 153,714 | 7,281 | (5,253) | 4.7% |
| LOANS AND ADVANCES | 349,037 | 14,657 | (11,142) | 4.2% |
December 2020 (Millions of Euros)
| Gross carrying amount | Impaired loans and advances | Accumulated impairment | Impaired loans and advances as a % of the total | |
|---|---|---|---|---|
| Central banks | 6,229 | — | (20) | — |
| General governments | 19,439 | 76 | (48) | 0.4% |
| Credit institutions | 14,591 | 6 | (16) | — |
| Other financial corporations | 9,856 | 14 | (39) | 0.1% |
| Non-financial corporations | 142,547 | 7,477 | (6,123) | 5.2% |
| Agriculture, forestry and fishing | 3,438 | 132 | (108) | 3.8% |
| Mining and quarrying | 4,349 | 47 | (59) | 1.1% |
| Manufacturing | 33,771 | 1,486 | (1,129) | 4.4% |
| Electricity, gas, steam and air conditioning supply | 13,490 | 591 | (509) | 4.4% |
| Water supply | 899 | 17 | (15) | 1.9% |
| Construction | 10,019 | 1,397 | (722) | 13.9% |
| Wholesale and retail trade | 24,594 | 1,456 | (1,223) | 5.9% |
| Transport and storage | 8,117 | 489 | (368) | 6.0% |
| Accommodation and food service activities | 8,337 | 358 | (294) | 4.3% |
| Information and communications | 5,764 | 73 | (60) | 1.3% |
| Financial and insurance activities | 5,298 | 123 | (132) | 2.3% |
| Real estate activities | 10,025 | 617 | (494) | 6.2% |
| Professional, scientific and technical activities | 2,886 | 177 | (124) | 6.1% |
| Administrative and support service activities | 3,955 | 142 | (192) | 3.6% |
| Public administration and defense, compulsory social security | 129 | 5 | (4) | 3.5% |
| Education | 665 | 54 | (43) | 8.1% |
| Human health services and social work activities | 1,812 | 67 | (59) | 3.7% |
| Arts, entertainment and recreation | 1,131 | 46 | (65) | 4.1% |
| Other services | 3,871 | 198 | (523) | 5.1% |
| Households | 151,410 | 7,106 | (5,895) | 4.7% |
| LOANS AND ADVANCES | 344,072 | 14,678 | (12,141) | 4.3% |
December 2019 (Millions of Euros)
| Gross carrying amount | Impaired loans and advances | Accumulated impairment | Impaired loans and advances as a % of the total | |
|---|---|---|---|---|
| Central banks | 4,285 | — | (9) | — |
| General governments | 28,281 | 88 | (60) | 0.3% |
| Credit institutions | 13,664 | 6 | (15) | — |
| Other financial corporations | 11,239 | 17 | (31) | 0.2% |
| Non-financial corporations | 173,254 | 8,467 | (6,465) | 4.9% |
| Agriculture, forestry and fishing | 3,758 | 154 | (124) | 4.1% |
| Mining and quarrying | 4,669 | 100 | (86) | 2.1% |
| Manufacturing | 39,517 | 1,711 | (1,242) | 4.3% |
| Electricity, gas, steam and air conditioning supply | 12,305 | 684 | (575) | 5.6% |
| Water supply | 900 | 14 | (16) | 1.6% |
| Construction | 10,945 | 1,377 | (876) | 12.6% |
| Wholesale and retail trade | 27,467 | 1,799 | (1,448) | 6.6% |
| Transport and storage | 9,638 | 507 | (392) | 5.3% |
| Accommodation and food service activities | 8,703 | 279 | (203) | 3.2% |
| Information and communications | 6,316 | 95 | (65) | 1.5% |
| Financial and insurance activities | 6,864 | 191 | (140) | 2.8% |
| Real estate activities | 19,435 | 782 | (527) | 4,0% |
| Professional, scientific and technical activities | 4,375 | 167 | (140) | 3.8% |
| Administrative and support service activities | 3,415 | 118 | (134) | 3.4% |
| Public administration and defense, compulsory social security | 282 | 5 | (6) | 1.7% |
| Education | 903 | 41 | (38) | 4.5% |
| Human health services and social work activities | 4,696 | 66 | (55) | 1.4% |
| Arts, entertainment and recreation | 1,396 | 47 | (39) | 3.4% |
| Other services | 7,671 | 331 | (360) | 4.3% |
| Households | 181,989 | 7,381 | (5,847) | 4.1% |
| LOANS AND ADVANCES | 412,711 | 15,959 | (12,427) | 3.9% |
The changes during the years 2021, 2020 and 2019 of impaired financial assets and contingent risks are as follows:
Changes in impaired financial assets and guarantees given (Millions of Euros)
| 2021 | 2020 | 2019 | |
|---|---|---|---|
| Balance at the beginning | 15,478 | 16,770 | 17,134 |
| Additions | 8,556 | 9,533 | 9,857 |
| Decreases (*) | (4,555) | (5,024) | (5,874) |
| Net additions | 4,001/td> | 4,509 | 3,983 |
| Amounts written-off | (3,613) | (3,603) | (3,803) |
| Exchange differences and other | (399) | (968) | (544) |
| Discontinued operations | — | (1,230) | — |
| Balance at the end | 15,467 | 15,478 | 16,770 |
- (*) Reflects the total amount of impaired loans derecognized from the consolidated balance sheet throughout the year as a result of mortgage foreclosures and real estate assets received in lieu of payment as well as monetary recoveries.
- (**) Includes principal and interest.
The Group estimates that the update in the definition of credit impairment (default) (see Note 2.2.1) led to an increase of €1,262 million in impaired financial assets. Regarding expected credit losses, the impact of this change is not considered to be significant, since most of the affected operations were previously classified within stage 2 and, consequently, their credit risk coverage already corresponded to the expected credit losses throughout the expected lifetime of the operation.
For the year ended December 31, 2021, the impairment charges recognized under the heading “Impairment or reversal of impairment on financial assets not measured at fair value through profit or loss or net gains by modification" amounted to €3,034 million (€5,179 million for the year ended December 31, 2020) (see Note 47).
During 2021, three factors have contributed to lower impairment charges compared to the previous year:
- a favorable demand recovery based on stimuli measures put in place by governments, savings during the pandemic and vaccination, as well as an upward revision in the forecasted GDP growth, which, although positive, has lost momentum by the end of the year due to short-term pressures. Such pressures are likely to be temporary and related to the supply chain and the rise in inflation rates,
- improved performance of the underlying business. In particular, limited additions to stage 3 have been supported by sound recoveries throughout the year,
- and, to a lower extent, lower management adjustments, aligned with the improvement of the macroeconomic scenario.
The changes during the years 2021, 2020 and 2019 in financial assets derecognized from the accompanying consolidated balance sheet as their recovery is considered unlikely ("write-offs"), is shown below:
Changes in impaired financial assets written-off from the balance sheet (Millions of Euros)
| Notes | 2021 | 2020 | 2019 | |
|---|---|---|---|---|
| Balance at the beginning | 22,001 | 26,245 | 32,343 | |
| Companies held for sale (*) | — | (4,646) | — | |
| Increase | 3,709 | 3,440 | 4,712 | |
| Decrease: | (3,605) | (2,715) | (11,039) | |
| Re-financing or restructuring | (1) | (7) | (2) | |
| Cash recovery | 47 | (423) | (339) | (919) |
| Foreclosed assets | (17) | (479) | (617) | |
| Sales (**) | (2,347) | (1,223) | (8,325) | |
| Debt forgiveness | (599) | (607) | (493) | |
| Time-barred debt and other causes | (129) | (60) | (682) | |
| Net exchange differences | (116) | (323) | 230 | |
| Balance at the end | 21,990 | 22,001 | 26,245 |
As indicated in Note 2.2.1, although they have been derecognized from the consolidated balance sheet, the BBVA Group continues to attempt to collect on these written-off financial assets, until the rights to receive them are fully extinguished, either because it is a time-barred financial asset, the financial asset is forgiven, or other reason.
7.2.6 Loss allowances
Movements, measured over a 12-month period, in gross accounting balances and accumulated allowances for loan losses during 2021, 2020 and 2019 are recorded on the accompanying consolidated balance sheet as of December 31, 2021, 2020 and 2019, in order to cover the estimated loss allowances in loans and advances and debt securities measured at amortized cost.
Changes in gross accounting balances of loans and advances at amortized cost. Year 2021 (Millions of Euros)
| Stage 1 | Stage 2 | Stage 3 | Total | |
|---|---|---|---|---|
| Balance at the beginning | 298,793 | 30,601 | 14,678 | 344,072 |
| Transfers of financial assets: | (10,785) | 8,640 | 2,145 | — |
| Transfers from stage 1 to stage 2 | (14,482) | 14,482 | — | — |
| Transfers from stage 2 to stage 1 | 4,905 | (4,905) | — | — |
| Transfers to stage 3 | (1,772) | (1,945) | 3,717 | — |
| Transfers from stage 3 | 564 | 1,009 | (1,573) | — |
| Net annual origination of financial assets | 17,876 | (4,729) | 1,217 | 14,364 |
| Becoming write-offs | (74) | (68) | (3,095) | (3,237) |
| Changes in model / methodology | — | — | — | — |
| Foreign exchange | (6,054) | (1,902) | (216) | (8,172) |
| Modifications that do not result in derecognition | 187 | 1,642 | 189 | 2,018 |
| Other | 224 | 29 | (261) | (8) |
| Balance at the end | 300,167 | 34,213 | 14,657 | 349,037 |
Changes in allowances of loans and advances at amortized cost. Year 2021 (Millions of Euros)
| Stage 1 | Stage 2 | Stage 3 | Total | |
|---|---|---|---|---|
| Balance at the beginning | (2,037) | (2,289) | (7,815) | (12,141) |
| Transfers of financial assets: | 187 | 441 | (2,521) | (1,893) |
| Transfers from stage 1 to Stage 2 | 139 | (602) | — | (463) |
| Transfers from stage 2 to Stage 1 | (60) | 307 | — | 247 |
| Transfers to Stage 3 | 111 | 802 | (2,775) | (1,862) |
| Transfers from stage 3 | (3) | (66) | 254 | 185 |
| Net annual origination of financial assets | (563) | (57) | (314) | (933) |
| Becoming write-offs | 45 | 56 | 2,694 | 2,795 |
| Changes in model / methodology | — | — | — | — |
| Foreign exchange | 70 | 270 | 719 | 519 |
| Modifications that do not result in derecognition | 12 | (79) | (122) | (189) |
| Other | 297 | 106 | 298 | 701 |
| Balance at the web | (1,990) | (2,091) | (7,061) | (11,142) |
Changes in gross accounting balances of loans and advances at amortized cost. Year 2020 (Millions of Euros)
| Stage 1 | Stage 2 | Stage 3 | Total | |
|---|---|---|---|---|
| Balance at the beginning | 363,234 | 33,518 | 15,959 | 412,711 |
| Transfers of financial assets: | (11,935) | 8,807 | 3,128 | — |
| Transfers from stage 1 to Stage 2 | (15,843) | 15,843 | — | — |
| Transfers from stage 2 to Stage 1 | 5,107 | (5,107) | — | — |
| Transfers to Stage 3 | (1,701) | (2,659) | 4,359 | — |
| Transfers from stage 3 | 502 | 729 | (1,231) | — |
| Net annual origination of financial assets | 16,119 | (827) | 102 | 15,395 |
| Becoming write-offs | (3) | (2) | (2,944) | (2,949) |
| Changes in model / methodology | — | — | — | — |
| Foreign exchange | (21,472) | (2,342) | (1,157) | (24,970) |
| Modifications that do not result in derecognition | (204) | 827 | 511 | 1,134 |
| Other | (283) | (190) | 270 | (204) |
| Discontinued operations | (46,664) | (9,190) | (1,192) | (57,045) |
| Balance at the end | 298,793 | 30,601 | 14,678 | 344,072 |
Changes in allowances of loans and advances at amortized cost. Year 2020 (Millions of Euros)
| Stage 1 | Stage 2 | Stage 3 | Total | |
|---|---|---|---|---|
| Balance at the beginning | (2,149) | (2,183) | (8,094) | (12,427) |
| Transfers of financial assets: | 184 | (511) | (1,806) | (2,133) |
| Transfers from stage 1 to stage 2 | 156 | (923) | — | (766) |
| Transfers from stage 2 to stage 1 | (50) | 253 | — | 202 |
| Transfers to stage 3 | 81 | 218 | (1,950) | (1,652) |
| Transfers from stage 3 | (3) | (59) | 144 | 83 |
| Net annual origination of allowances | (872) | (795) | (1,329) | (2,996) |
| Becoming write-offs | — | — | 2,567 | 2,568 |
| Changes in model / methodology | — | — | — | — |
| Foreign exchange | 227 | 256 | 721 | 1,204 |
| Modifications that do not result in derecognition | 12 | (118) | (177) | (283) |
| Other | 160 | 618 | 25 | 803 |
| Discontinued operations | 401 | 444 | 278 | 1,123 |
| Balance at the end | (2,037) | (2,289) | (7,815) | (12,141) |
Changes in gross accounting balances of loans and advances at amortized cost. Year 2019 (Millions of Euros)
| Stage 1 | Stage 2 | Stage 3 | Total | |
|---|---|---|---|---|
| Balance at the beginning | 352,282 | 30,707 | 16,359 | 399,347 |
| Transfers of financial assets: | (9,021) | 6,279 | 2,741 | — |
| Transfers from stage 1 to stage 2 | (13,546) | 13,546 | — | — |
| Transfers from stage 2 to stage 1 | 5,656 | (5,656) | — | — |
| Transfers to stage 3 | (1,571) | (2,698) | 4,269 | — |
| Transfers from stage 3 | 440 | 1,087 | (1,527) | — |
| Net annual origination of financial assets | 20,296 | (2,739) | 246 | 17,804 |
| Becoming write-offs | (152) | (349) | (3,407) | (3,908) |
| Changes in model / methodology | — | — | — | — |
| Foreign exchange | 1,611 | 35 | 16 | 1,662 |
| Modifications that do not result in derecognition | (1) | (27) | 15 | (13) |
| Other | (1,782) | (388) | (11) | (2,180) |
| Balance at the end | 363,234 | 33,518 | 15,959 | 412,711 |
Changes in allowances of loans and advances at amortized cost. Year 2019 (Millions of Euros)
| Stage 1 | Stage 2 | Stage 3 | Total | |
|---|---|---|---|---|
| Balance at the beginning | (2,082) | (2,375) | (7,761) | (12,217) |
| Transfers of financial assets: | 176 | (227) | (1,574) | (1,626) |
| Transfers from stage 1 to stage 2 | 126 | (649) | — | (523) |
| Transfers from stage 2 to stage 1 | (38) | 273 | — | 235 |
| Transfers to stage 3 | 89 | 234 | (1,810) | (1,487) |
| Transfers from stage 3 | (1) | (86) | 236 | 149 |
| Net annual origination of allowances | (542) | (116) | (1,711) | (2,370) |
| Becoming write-offs | 130 | 337 | 2,789 | 3,256 |
| Changes in model / methodology | — | — | — | — |
| Foreign exchange | (30) | (18) | 69 | 20 |
| Modifications that do not result in derecognition | (15) | (149) | (89) | (254) |
| Other | 215 | 366 | 183 | 764 |
| Balance at the end | (2,149) | (2,183) | (8,094) | (12,427) |
7.2.7 Refinancing and restructuring transactions
Group policies and principles with respect to refinancing and restructuring transactions
Refinancing and restructuring transactions (see definition in the Glossary) are carried out with customers who have requested such a transaction in order to meet their current loan payments if they are expected, or may be expected, to experience financial difficulty in making the payments in the future.
The basic aim of a refinancing and restructuring transaction is to provide the customer with a situation of financial viability over time by adapting repayment of the loan incurred with the Group to the customer’s new situation of fund generation. The use of refinancing and restructuring for other purposes, such as to delay loss recognition, is contrary to BBVA Group policies.
The BBVA Group’s refinancing and restructuring policies are based on the following general principles:
- Refinancing and restructuring is authorized according to the capacity of customers to pay the new installments. This is done by first identifying the origin of the payment difficulties and then carrying out an analysis of the customers’ viability, including an updated analysis of their economic and financial situation and capacity to pay and generate funds. If the customer is a company, the analysis also covers the situation of the industry in which it operates.
- With the aim of increasing the solvency of the transaction, new guarantees and/or guarantors of demonstrable solvency are obtained where possible. An essential part of this process is an analysis of the effectiveness of both the new and original guarantees.
- This analysis is carried out from the overall customer or group perspective.
- Refinancing and restructuring transactions do not in general increase the amount of the customer’s loan, except for the expense inherent to the transaction itself.
- The capacity to refinance and restructure a loan is not delegated to the branches, but decided on by the risk units.
- The decisions made are reviewed from time to time with the aim of evaluating full compliance with refinancing and restructuring policies.
These general principles are adapted in each case according to the conditions and circumstances of each geographical area in which the Group operates, and to the different types of customers involved.
In the case of retail customers (private individuals), the main aim of the BBVA Group’s policy on refinancing and restructuring a loan is to avoid default arising from a customer’s temporary liquidity problems by implementing structural solutions that do not increase the balance of the customer’s loan. The solution required is adapted to each case and the loan repayment is made easier, in accordance with the following principles:
- Analysis of the viability of transactions based on the customer’s willingness and ability to pay, which may be reduced, but should nevertheless be present. The customer must therefore repay at least the interest on the transaction in all cases. No arrangements may be concluded that involve a grace period for both principal and interest.
- Refinancing and restructuring of transactions is only allowed on those loans in which the BBVA Group originally entered into.
- Customers subject to refinancing and restructuring transactions are excluded from marketing campaigns of any kind.
In the case of non-retail customers (mainly companies, enterprises and corporates), refinancing/restructuring is authorized according to an economic and financial viability plan based on:
- Forecasted future income, margins and cash flows to allow entities to implement cost adjustment measures (industrial restructuring) and a business development plan that can help reduce the level of leverage to sustainable levels (capacity to access the financial markets).
- Where appropriate, the existence of a divestment plan for assets and/or operating segments that can generate cash to assist the deleveraging process.
- The capacity of shareholders to contribute capital and/or guarantees that can support the viability of the plan.
In accordance with the Group’s policy, the conclusion of a loan refinancing and restructuring transaction does not mean the loan is reclassified from "impaired" or "significant increase in credit risk" to normal risk. The reclassification to "significant increase in credit risk" or normal risk categories must be based on the analysis mentioned earlier of the viability, upon completion of the probationary periods described below.
The Group maintains the policy of including risks related to refinanced and restructured loans as either:
- "Impaired assets", as although the customer is up to date with payments, they are classified as unlikely to pay when there are significant doubts that the terms of their refinancing may not be met; or
- "Significant increase in credit risk" until the conditions established for their consideration as normal risk are met.
The assets classified as "Impaired assets" should comply with the following conditions in order to be reclassified to "Significant increase in credit risk":
- The customer has to have paid a significant part of the pending exposure.
- At least one year must have elapsed since its classification as "Impaired asset".
- The customer does not have past due payments and objective criteria, demonstrating the borrower´s ability to pay, have been verified.
The conditions established for assets classified as “Significant increase in credit risk” to be reclassified out of this category are as follows:
- The customer must have paid past-due amounts (principal and interest) since the date of the renegotiation or restructuring of the loan or other objective criteria, demonstrating the borrower´s ability to pay, have been verified; none of its exposures is more than 30 days past-due.
- At least two years must have elapsed since completion of the renegotiation or restructuring of the loan and regular payments must have been made during at least half of this probation period; and
- It is unlikely that the customer will have financial difficulties and, therefore, it is expected that the customer will be able to meet its loan payment obligations (principal and interest) in a timely manner.
The economic impact caused by the Covid-19 pandemic has required the adaptation of the repayment schedule of a large volume of loans in all geographies and portfolios. In general, this support has been conducted through the concession of deferrals that comply with the principles established by the EBA, which has allowed for the application of a differential accounting and prudential treatment.
Renewals and renegotiations will be classified as normal risk, provided that there is no significant increase in risk. This classification is applicable at the initial moment, and in the event of any deterioration, the criteria established in the existing governance are followed. In this sense, the aforementioned conditions are considered, including, among others, no facility with more than 30 days delinquency and not being identified as 'unlikely to pay'.
The BBVA Group’s refinancing and restructuring policy provides for the possibility of two modifications in a 24 month period for loans that are not in compliance with the payment schedule.
The internal models used to determine allowances for loan losses consider the restructuring and renegotiation of a loan, as well as re-defaults on such a loan, by assigning a lower internal rating to restructured and renegotiated loans than the average internal rating assigned to non-restructured/renegotiated loans. This downgrade results in an increase in the probability of default (PD) assigned to restructured/renegotiated loans (with the resulting PD being higher than the average PD of the non- renegotiated loans in the same portfolios).
In any case, a restructuring will be considered impaired when the reduction in the present net value of the financial obligation is greater than 1% in line with the new management criteria introduced during 2021.
For quantitative information on refinancing and restructuring transactions see Appendix XI.
7.2.8 Risk concentration
Policies for preventing excessive risk concentration
In order to prevent the build-up of excessive risk concentrations at the individual, sector, portfolio and geography levels, BBVA Group maintains updated maximum permitted risk concentration indices which are tied to the various observable variables related to concentration risk.
Together with the limits for individual concentration, the Group uses the Herfindahl index to measure the concentration of the Group's portfolio and the banking group's subsidiaries. At the BBVA Group level, the index reached implies a "very low" degree of concentration.
The limit on the Group’s exposure or financial commitment to a specific customer therefore depends on the customer’s credit rating, the nature of the risks involved, and the Group’s presence in a given market, based on the following guidelines:
- The aim is, as much as possible, to reconcile the customer's credit needs (commercial/financial, short-term/long-term, etc.) with the interests of the Group.
- Any legal limits that may exist concerning risk concentration are taken into account (relationship between risks with a customer and the capital of the shareholder´s entity that assumes them), the markets, the macroeconomic situation, etc.
- The aim is to seek inter and intra-sector diversification in coherence with the metrics defined in the RAF for the Group and for the banking group's subsidiaries.
Risk concentrations by geography
The breakdown of the main figures in the most significant foreign currencies in the accompanying consolidated balance sheets is set forth in Appendix XII.
Sovereign risk concentration
Sovereign risk management
The identification, measurement, control and monitoring of risk associated with sovereign risk transactions is carried out by a centralized unit within the BBVA Group's Risk Area. Its basic functions are preparing reports (called financial programs) on the countries with which it maintains cross-border risks (i.e. risks taken in a foreign currency from outside the country with borrowers in the country, whether public or private) and sovereign risks (i.e. risks with the local Sovereign of the country where the risk-taking unit is located), monitoring those risks, establishing risk limits, assigning ratings to the countries analyzed and, in general, supporting the Group in any information request regarding this type of transaction. The risk policies established in the financial programs are approved by the relevant risk committees.
The country risk unit tracks the evolution of the risks associated with the various countries to which the Group are exposed (including sovereign risk) on an ongoing basis in order to adapt its risk and mitigation policies to any macroeconomic and political changes that may occur. Moreover, it regularly updates its internal ratings and forecasts for these countries. The methodology is based on the assessment of quantitative and qualitative parameters which are in line with those used by certain multilateral organizations such as the International Monetary Fund (IMF) and the World Bank, rating agencies and export credit organizations.
For additional information on sovereign risk in Europe see Appendix XII.
Risk related to the developer and Real-Estate sector in Spain
The sale of impaired assets concluded in 2018. Currently, there is no risk concentration in the developer and real estate sector, taking into account that its weight in total wholesale risks in Spain is approximately 10%, while compared with the total risks in the portfolio (wholesale and retail), the Real Estate risk assumed would be around 3%.
Policies and strategies established by the Group to deal with risks related to the developer and real-estate sector
BBVA Group has teams specializing in the management of the Real Estate Sector risk, given its economic importance and specific technical component. This specialization is not only in risk teams, but throughout the handling, commercial, problem risks and legal, etc. It also includes the research department of the BBVA Group (BBVA Research), which helps determine the medium/long-term vision needed to manage this portfolio.
The policies established to address the risks related to the developer and real-estate sector, aim to accomplish, among others, the following objectives: to avoid concentration in terms of customers, products and regions; to estimate the risk profile for the portfolio; and to anticipate possible worsening of the portfolio within a sector is highly cyclical.
Specific policies for analysis and granting of new developer risk transactions
In the analysis of new transactions, the assessment of the commercial operation in terms of the economic and financial viability of the project has been one of the constant. The monitoring of the work, sales prospects and the legal situation of the project are essential aspects for the admission and follow-up of new real estate transactions. With regard the participation of the Risk Acceptance teams, they have a direct link and participate in the committees of areas such as Valuation, Legal, Research and Recoveries. This guarantees coordination and exchange of information in all the processes.
In this context, and within the current Real Estate cycle, the strategy with clients is subject to an Asset Allocation limit and to an action framework that allows defining a target portfolio, both in volume and in credit quality.
Risk monitoring policies
The base information for analyzing the real estate portfolios is updated monthly. There is a systematic monitoring of developments under close monitoring with the evolution of works and sales.
Policies applied in the management of real estate assets in Spain
The internal Rules on Real Estate Financing, which establish recommendations for financing a new housing development business, are reviewed and updated annually.
The recommendations represent guidelines about how to manage the credit admission activity of BBVA Group entities based on best practices of markets in which this activity is performed. It is expected that a high percentage of the current transactions will be in compliance with the latter.
For quantitative information about the risk related to the developer and Real-Estate sector in Spain see Appendix XII.
7.3 Structural risk
The structural risks are defined, in general terms, as the possibility of suffering losses due to adverse movements in market risk factors as a result of mismatches in the financial structure of an entity ́s balance sheet.
In the Group, the following types of structural risks are defined, according to the nature and the following market factors: interest rate risk, credit spread risk, exchange rate risk and equity risk.
The scope of structural risks in the Group is limited to the banking book, excluding market risks in the trading book that are clearly delimited and separated and make up the Market Risks.
The Assets and Liabilities Committee (ALCO) is the main responsible body for the management of structural risks regarding liquidity/ funding, interest rate, credit spread, currency, equity and solvency. Every month, with the participation of the CEO and representatives from the areas of Finance, Risks and Business Areas; this committee monitors the structural risks and is presented with proposals with regard to action plans related with its management for its approval. These management proposals are made by the Finance area with a forward-looking focus, maintaining the alignment with the risk appetite framework, trying to guarantee the recurrence of results and financial stability, as well as to preserve the solvency of the entity. All balance sheet management units have a local ALCO, which is permanently attended by members of the corporate center, and there is a corporate ALCO where management strategies are monitored and presented in the Group's subsidiaries.
The GRM area acts as an independent unit, ensuring adequate separation between the management and risk control functions, and is responsible for ensuring that the structural risks in the Group are managed according to the strategy approved by the Board of Directors.
Consequently, GRM deals with the identification, measurement, monitoring and control of those risks and their reporting to the corresponding corporate bodies. Through the Global Risk Management Committee (GRMC), it performs the function of control and risk assessment and is responsible for developing the strategies, policies, procedures and infrastructure necessary to identify, evaluate, measure and manage the significant risks that the BBVA Group faces. To this end, GRM, through the corporate unit of Structural Risks, proposes a scheme of limits that defines the risk appetite set for each of the relevant structural risk types, both at Group level and by management units, which will be reviewed annually, reporting the situation periodically to the Group's corporate bodies as well as to the GRMC.
Additionally, both the management system and the control and measurement system for structural risks are necessarily adjusted to the Group's internal control model, complying with the evaluation and certification processes that comprise it. In this sense, the tasks and controls necessary for its scope of action have been identified and documented, supporting a regulatory framework which includes specific processes and measures for structural risks, from abroad geographical perspective.
Within the three lines of defense scheme in which BBVA's internal control model is based according to the most advanced standards in terms of internal control, the first line of defense is maintained by the Finance area, which is responsible for managing the structural risk.
As a second line of defense, GRM is in charge of identifying risks, and establishing policies and control models, periodically evaluating their effectiveness.
In the second line of defense, there are also the Internal Risk Control units, which independently review the Structural Risk control, and Internal Financial Control, which carries out a review of the design and effectiveness of the operational controls over structural risk management.
The third line of defense is represented by the Internal Audit area, an independent unit within BBVA Group, which is responsible for reviewing specific controls and processes.
7.3.1 Structural interest rate risk and credit spread
The structural interest-rate risk (IRRBB) is related to the potential impact that variations in market interest rates have on an entity's net interest income and equity. In order to properly measure IRRBB, BBVA Group takes into account all the main sources of this risk: repricing risk, yield curve risk, option risk and basis risk.
The assessment of structural interest rate risk is carried out with an integral vision, combining two complementary points of view: the effects of interest rate shifts in net interest income (short term) and their impact on the economic value of equity (long term). In addition, the impact on the market value of the financial instruments of the banking book, as a result of changes in the market interest rates (IRRBB) or the credit spreads (CSRBB), will be assessed as it may have an impact on the income statement and/or equity due to their accounting treatment.
The exposure of a financial entity to adverse interest rates movements is a risk inherent to the development of the banking business, which is also, in turn, an opportunity to create economic value. Therefore, interest rate risk must be effectively managed so that it is limited in accordance with the entity’s equity and in line with the expected economic result.
In BBVA, the purpose of structural interest rate risk management is to maintain the stability of the net interest income in the event of interest rate fluctuations. It contributes to a recurrent generation of earnings, limit the capital consumption due to structural interest rate risk and monitor potential mark-to-market impacts on “held to collect and sell” (HtC&S) portfolios. Likewise, the spread risk management in banking book portfolios is aimed at limiting the impact on the valuation of fixed income instruments, which are used for balance sheet liquidity and interest rate risk management purposes in order to increase diversification, and at reducing the concentration of each issuer, maintaining the spread risk at levels aligned with the total volume of the investment portfolio and the equity of the Group.
These functions falls to the Global ALM (Asset & Liability Management) unit, within the Finance area, who, through ALCO, aims to guarantee the recurrence of results and preserve the solvency of the entity, always adhering to the risk profile defined by the management bodies of the BBVA Group.
Structural interest rate risk management is decentralized, and is carried out independently in each entity included in the structural balance sheet (banking book) of the BBVA Group, keeping the exposure to interest rates and credit spreads movements aligned with the strategy and the target risk profile of the Group, and in compliance with the regulatory requirements according to the EBA guidelines.
Nature of interest rate risk and credit spread risk
Repricing risk arises due to the difference between the repricing or maturity terms of the assets and liabilities, and represents the most frequent interest rate risk faced by financial entities. However, other sources of risk such as changes in the slope and shape of the yield curve, the reference to different indexes and the optionality risk embedded in certain banking transactions, are also taken into account by the risk control system.
Furthermore, the credit spread risk (CSRBB) of fixed-income portfolios in the banking book arises from the potential impact on the value of fixed-income portfolios and credit derivatives classified as HtC&S produced by a variation in the level of credit spreads associated with those instruments/issuers and that are not explained by default risk or by movements in market interest rates.
BBVA's structural interest-rate risk management and control process includes a set of metrics and tools that enable the capture of additional sources to properly monitor the risk profile of the Group, backed-up by assumptions that aim to characterize the behavior of the balance sheet items with the maximum accuracy.
The IRRBB and CSRBB measurement is carried out on a monthly basis, and includes probabilistic measures based on simulation methods of interest rate curves and credit spread shocks. The corporate methodology enables to capture additional sources of risk to the interest rate parallel shifts, such as the changes in slope shape and the basis of yield curves. Additionally, sensitivity analysis to multiple parallel shocks of different magnitude are also assessed on a regular basis. The process is run separately for each currency to which the Group is exposed, considering, at a later stage, the diversification effect among currencies and business units.
The risk measurement model is complemented by the assessment of ad-hoc scenarios, stress tests and reverse stress. As stress testing has become more relevant during the recent years, the evaluation of market rates and behavioral assumptions extreme scenarios has continued to be enhanced, while assessing, also, BBVA Research market scenarios, and the set of scenarios defined according to EBA guidelines.
During 2021, the continuous improvement of internal systems and IRRBB management and control models has continued according to the EBA guidelines. Among others, the developments to improve the data provisioning and the risk management tools are highlighted, as well as the enhancement of the stress testing and models backtesting procedures.
Key assumptions of the model
In order to measure structural interest rate risk, the setting of assumptions on the evolution and behavior of certain balance sheet items is particularly relevant, especially those related to products without an explicit or contractual maturity which characteristics are not established in their contractual terms and must be therefore estimated.
The assumptions that characterize these balance sheet items must be understandable for the areas and bodies involved in risk management and control and remain duly updated, justified and documented. The modeling of these assumptions must be conceptually reasonable and consistent with the evidence based on historical experience, reviewed at least once a year and, if any, the behavior of the customers induced by the business areas. These assumptions are regularly subject to a sensitivity analysis to assess and understand the impact of the modelling on the risk metrics.
The approval and update of the IRRBB behavioral models is subject to the corporate governance under the scope of GRM analytics. Thus, all the models must be duly inventoried and catalogued and comply with the requirements for their development, updating and changes management set out in the internal procedures. They are also subject to the corresponding internal validations and follow-up requirements established based on their relevance, as well as to backtesting procedures against experience to ratify the validity of the assumptions applied.
In view of the heterogeneity of the financial markets, customers and products in the multiple jurisdictions, each one of the entities of the Group is responsible for determining the behavior assumptions to be applied to the balance sheet items, always under the guidelines and the applicability of the corporate models existing in the Group.
The balance sheet behavioral assumptions stand out those established for the treatment of items without contractual maturity, mainly for demand customer deposits, and those related to the expectations on the exercise of interest rate options, especially relating to loans and deposits subject to prepayment risk.
For the modelling of demand deposits, a segmentation of the accounts in several categories is previously carried out depending on the characteristics of the customer (retail / wholesale) and the product (type of account / transactionality / remuneration), in order to outline the specific behavior of each segment.
In order to establish the remuneration of each segment, the relationship between the evolution of market interest rates and the interest rates of managed accounts is analyzed, with the aim of determining the translation dynamic (percentages and lags) of interest rates variations to the remuneration of the accounts. In this regard, consideration is given to the potential limitations in the repricing of these accounts in scenarios of low or negative rates, with special attention to retail customers, through the establishment of floors in the remuneration.
The behavior assigned to each category of accounts is determined by an analysis of the historical evolution of the balances and the probability of cancellation of the accounts. For this, the volatile part of the balance assigned to a short-term maturity is isolated, thus avoiding fluctuations in the level of risk caused by specific variations in the balances and promoting stability in the management of the balance. Once the stable part is identified, a medium / long term maturity model is applied through a decay distribution based on the average term of the accounts and the conditional cancellation probabilities throughout the life of the product.
The relationship of the evolution of the balance of deposits with the levels of market interest rates is incorporated, where appropriate, in the behavioral modelling, especially in low interest rates environments, including its effect on the stability of the deposits as well as the potential migration between the different types of deposits (on demand / time deposits) in the different interest rate scenarios.
Equally relevant is the treatment of early cancellation options embedded in credit loans, mortgage portfolios and customer deposits. The evolution of market interest rates may condition, along with other variables, the incentive that customers have to prepay loans or deposits, modifying the future behavior of the balance amounts with respect to the forecasted contractual maturity schedule.
The detailed analysis of the historical information related to prepayment data, both partial and total prepayment, combined with other variables such as interest rates, allows estimating future amortizations and, where appropriate, their behavior linked to the evolution of such variables through the relationship between the incentive of the customer to prepay and the early cancellation speed.
The table below shows the profile of average structural interest rate risk and credit spread risk of fixed income portfolio in the banking book classified as HtC&S in terms of sensitivities of the main currencies for the BBVA Group in 2021:
Sensitivity to interest-rate and credit spread analysis. Year 2021
| interest rate risk and | credit spread | ||||
|---|---|---|---|---|---|
| Impact on net interest income (*) | Impact on economic value (**) | Impact on economic value (**) |
|||
| 100 basis-point increase |
100 basis-point decrease (***) |
100 basis-point increase |
100 basis-point decrease (***) |
100 basis-point increase |
|
| EUR | [3.5% , 5.5%] | [-3.5% , -1.5%] | [3.5% , 5.5%] | [-3.5% , -1.5%] | [-3.5% , -1.5%] |
| MXN | [0.5% , 1.5%] | [-1.5% , -0.5%] | [-1.5% , -0.5%] | [0.5% , 1.5%] | [-0.5% , 0.5%] |
| USD | [0.5% , 1.5%] | [-1.5% , -0.5%] | [0.5% , 1.5%] | [-1.5% , -0.5%] | [-0.5% , 0.5%] |
| TRY | [-0.5% , 0.5%] | [-0.5% , 0.5%] | [-0.5% , 0.5%] | [-0.5% , 0.5%] | [-0.5% , 0.5%] |
| Resto | [-0.5% , 0.5%] | [-0.5% , 0.5%] | [-0.5% , 0.5%] | [-0.5% , 0.5%] | [-0.5% , 0.5%] |
| BBVA Group | [7.5% , 10.0%] | [-5.5% , -3.5%] | [3.5% , 5.5%] | [-3.5% , -1.5%] | [-3.5% , -1.5%] |
- (*) Percentage of "12 months" net interest income for the BBVA Group.
- (**) Percentage of CET1 (Fully Loaded) for BBVA Group
- (***) In EUR and USD (and GBP included in "Other"*), negative interest rates scenarios are allowed up to plausible levels lower than current rates.
During 2021, central banks began withdrawing the expansionary policies implemented during the year 2020, to mitigate the economic impact caused by the COVID-19 pandemic, with the aim of reducing the inflationary pressures that are occurring in most countries of the world. In Europe, the end of the PEPP (Pandemic Emergency Purchase Programme) was announced for the month of March 2022.
In Turkey, although it initially showed an upward trend in interest rates, there have been significant drops since September, ending the year 300 basis points below the level of December 2020.
Regarding Mexico, the Central Bank implemented the last rate cut in February, placing it at a level of 4%. Starting in June, there was a change in trend, initiating an upward cycle in rates, reaching a level of 5.50% in December. The objective of the Central Bank is to moderate the rise in inflation and bring it back within its target range.
In South America, the monetary policy was restrictive, with increases in the policy rates in Colombia and Peru, affected by higher levels of inflation, reaching above the central banks targets. Regarding Argentina it has had a stable monetary policy without changes during the year.
The BBVA Group, at an aggregate level, continues to maintain a moderate risk profile, in accordance with the established objective, showing a favorable position to a rise in interest rates on net interest income. Effective management of the balance sheet structural risk has mitigated the negative impact of the low interest rates derived from the expansive monetary policies implemented by the different central banks to offset the negative economic effects derived from the COVID-19 pandemic, and is reflected in the strength and recurrence of the net interest income:
- In Europe, the downward trend in interest rates remains limited by current levels, preventing extremely adverse scenarios from occurring. The balance sheet is characterized by a high proportion of variable-rate loans (basically mortgages and corporate lending) and liabilities are composed mainly of customer on demand deposits. The ALCO portfolio acts as a management lever and hedging for the balance sheet, mitigating its sensitivity to interest rate fluctuations. The balance sheet ́s interest rate profile has remained stable during the year, showing an interest net income sensitivity to 100 basis points increases by the interest rates slightly above 20%.
On the other hand, the ECB held the marginal deposit facility rate unchanged at -0.50% in 2021 and maintained the extraordinary support programs created after the outbreak of the COVID-19 crisis. This has created stability in European benchmark interest rates (EURIBOR). - In Mexico, a balance has been maintained between balances referenced to fixed and variable interest rates. Among the assets most sensitive to interest rate movements, the wholesale portfolio stands out, while consumer and mortgages are mostly at a fixed rate. The ALCO portfolio is mainly invested in fixed-rate sovereign bonds with limited durations. The sensitivity of the net interest income continues to be limited, stable, and slightly biased towards higher interest rates, which have increased during 2021 by 125 basis points.
- In Turkey, the sensitivity of loans, mostly fixed-rate but with relatively short maturities, and the ALCO portfolio balance the sensitivity of deposits on the liability side. In this way, the interest rate risk is limited, both in Turkish lira and in foreign currency.
- In South America, the risk profile on interest rates continues to be low, as most of the countries in the area have a composition of fixed / variable and very similar maturities between assets and liabilities, showing a sensitivity of the margin interest rate limited and with slight variations throughout 2021. Likewise, in countries with balances in several currencies, interest rate risk is also managed for each of the currencies, showing a very low level of risk. The more restrictive measures promoted by the central banks during 2021 are expected to have a slightly positive impact, given the sensitivity maintained by the different banks in the region.
7.3.2 Financial Instruments offset
Structural exchange rate risk, is defined as the possibility of impacts on solvency, equity value and results driven by fluctuations in the exchange rates due to exposures in foreign currencies.
Structural exchange rate risk is inherent to the business of international banking groups, such as BBVA, that develop their activities in different geographies and currencies. At a consolidated level, structural exchange-rate risk arises from the consolidation of holdings in subsidiaries with functional currencies other than the euro. Its management is centralized in order to optimize the joint management of permanent foreign currency exposures, taking diversification into account.
The purpose of structural exchange rate risk management is protecting solvency by limiting volatility of the consolidated CET1 ratio and income to consolidate denominated in a currency other the euro in the Group, as well as to limit the capital requirements under exchange rate fluctuations to which the Group is exposed due to its international diversification. The ALM Global corporate unit, through the ALCO, is responsible for the management of this risk all through an active hedging policy, deliberately taken for each objective, and fully aligned with the management strategy.
At the corporate level, the risk monitoring metrics included in the limits framework are aligned with the Risk Appetite Framework, and are targeted to control the effects on the solvency through the economic capital metric and the fluctuations in the Common Equity Tier I fully loaded (CET1 fully loaded) consolidated ratio, as well as the maximum deviation in the Group's attributable profit. The probabilistic metrics make it possible to estimate the joint impact of exposure to different currencies taking into account the different variability in exchange rates and their correlations. These metrics are supplemented with additional assessment indicators.
The suitability of these risk assessment metrics is reviewed on a regular basis through backtesting exercises. The final element of structural exchange-rate risk control is the stress and scenario analysis aimed to assess the vulnerabilities of foreign currency structural exposure not contemplated by the risk metrics and to serve as an additional tool when making management decisions. The scenarios are based both on historical situations simulated by the risk model and on the risk scenarios provided by BBVA Research.
The purpose of the exchange rate risk management of BBVA's long term investments, which arises mainly from its foreign franchises, is to preserve the capital ratios of the Group and to maintain the stability of the profits. The U.S. dollar accumulated an appreciation of 8.3% against the euro in 2021, thus reversing much of the movement in favor of the euro in 2020 after the outbreak of the pandemic. Among the emerging currencies, the sharp depreciation of the Turkish lira in 2021 (-40.2%) stood out, severely penalized by rate cuts in the recent months. The positive side came from the good performance of the Mexican peso, which has appreciated by 5.5% against the euro since the end of 2020. With regard to the South American currencies, the Peruvian Sol finally closed the year with a slight depreciation against Euro (-1.3%) while the Chilean peso (-8.8%) and the Colombian peso (-6.6%) showed a greater depreciation. The Argentine peso depreciated (-11.3%) but in a more contained manner than in previous years.
BBVA maintains its active management policies of the main investments in emerging countries, which are set, on average, between 30% and 50% of the annual profits and around 70% of the excess of the CET1 capital ratio. The sale of BBVA USA in June modified the sensitivity against movements in the exchange rates of the ratio CET1 fully-loaded of the Group. USD sensitivity has been the most affected by this change, reaching +18 basis points in case of a depreciation of -10% in the currency. At the end of December 2021, the sensitivity is estimated as -7 bps for the Mexican Peso and -1 bps for the Turkish lira, both against a depreciation of -10%. Regarding the hedging of the expected profits for 2022, it stands at around 65% in the case of Mexico, 20% for Turkey and 100% for Peru and Colombia.
For the years 2021, 2020 and 2019, the estimated sensitivities of the result attributable to the parent company are shown below, taking into account the coverage, against depreciations and appreciations of 1% of the average rate in the main currencies. To the extent that hedging positions are periodically modulated, the sensitivity estimate attempts to reflect an average (or effective) sensitivity in the year:
Sensitivity to 1% change (Millions of Euros)
| Currency | 2021 | 2020 | 2019 |
|---|---|---|---|
| Mexican peso | 14.0 | 4.9 | 12.7 |
| Turkish lira | 4.7 | 4.5 | 3.1 |
| Peruvian sol | 0.3 | 0.4 | 1.9 |
| Chilean peso | 0.6 | 0.3 | 0.5 |
| Colombian peso | 1.1 | 1.4 | 2.6 |
| Argentine peso | 0.6 | 0.9 | 1.3 |
7.3.3 Structural equity risk
Structural equity risk refers to the possibility of suffering losses in the value of positions in shares and other equity instruments held in the banking book with long or medium term investment horizons due to fluctuations in the value of equity indexes or shares.
BBVA Group's exposure to structural equity risk arises largely from minority shareholdings held on industrial and financial companies, and in new business (innovation). This exposure is modulated in some portfolios with positions held on derivative instruments on the same underlying assets, in order to adjust the portfolio sensitivity to potential changes in equity prices.
The structural equity risk management is aimed at increasing the income-generating capacity of those shares held by the Group, limiting the capital requirements for equity risk and narrowing the impact on the solvency level through a proactive management of the portfolio using hedges. The function of managing the structural equity portfolios is a responsibility of the corporate units of Global ALM and other Group's units specialized in this area. Their activity is subject to the risk management corporate policy on structural equity risk management, complying with the defined management principles and Risk Appetite Framework.
The structural equity risk metrics, designed by GRM according to the corporate model, contribute to the effective monitoring of the risk by estimating the sensitivity and the capital necessary to cover the possible unexpected losses due to changes in the value of the shareholdings in the Group's investment portfolio, with a level of confidence that corresponds to the objective rating of the entity, taking into account the liquidity of the positions and the statistical behavior of the assets to be considered
In order to analyze the risk profile in depth, stress tests and scenario analysis of sensitivity to different simulated scenarios are carried out. They are based on both past crisis situations and forecasts made by BBVA Research. These analyses are carried out regularly to assess the vulnerabilities of structural equity exposure not contemplated by the risk metrics and to serve as an additional tool when making management decisions.
Backtesting is carried out on a regular basis on the risk measurement model used.
Equity markets in Europe and the US have rallied significantly in 2021. The excellent performance of listed companies' corporate earnings and the continuity of central banks' accommodative policies have been behind these revaluations. However, the Spanish stock market has once again lagged behind the rest of the European stock markets.
Structural equity risk, measured in terms of economic capital, has raised during the last year due to the higher exposure taken. The aggregate sensitivity of the BBVA Group’s consolidated equity to a 1% fall in the price of shares of the companies making up the equity portfolio increased to -€27 million as of December 31, 2021, compared to -€20 million as of December 31, 2020. This estimation takes into account the exposure in shares valued at market prices, or if not applicable, at fair value (excluding the positions in the Treasury Area portfolios) and the net delta-equivalent positions in derivatives on the same underlyings.
7.4 Market risk
Market risk originates from the possibility of experiencing losses in the value of positions held as a result of movements in market variables that affect the valuation of financial assets and liabilities. Market risk in the Group's trading portfolios stems mainly from the portfolios originated by Global Markets valued at fair value and held for the purpose of trading and generating short-term results. Market risk in the field of banking book is clearly and distinctly addressed and can be broken down into structural risks relating to interest rate, exchange rate and equity (see Note 7.3).
7.4.1 Market risk in trading portfolios
The main risks in the trading portfolios can be classified as follows:
- Interest-rate risk: This arises as a result of exposure to movements in the different interest-rate curves involved in trading. Although the typical products that generate sensitivity to the movements in interest rates are money-market products (deposits, interest-rate futures, call money swaps, etc.) and traditional interest-rate derivatives (swaps and interest-rate options such as caps, floors, swaptions, etc.), practically all the financial products are exposed to interest-rate movements due to the effect that such movements have on the valuation of the financial discount.
- Equity risk: This arises as a result of movements in share prices. This risk is generated in spot positions in shares or any derivative products whose underlying asset is a share or an equity index. Dividend risk is a sub-risk of equity risk, arising as an input for any equity option. Its variation may affect the valuation of positions and it is therefore a factor that generates risk on the books.
- Exchange-rate risk: This is caused by movements in the exchange rates of the different currencies in which a position is held. As in the case of equity risk, this risk is generated in spot currency positions, and in any derivative product whose underlying asset is an exchange rate. In addition, the quanto effect (operations where the underlying asset and the instrument itself are denominated in different currencies) means that in certain transactions in which the underlying asset is not a currency, an exchange-rate risk is generated that has to be measured and monitored.
- Credit-spread risk: Credit spread is an indicator of an issuer's credit quality. Spread risk occurs due to variations in the levels of spread of both corporate and government issues, and affects positions in bonds and credit derivatives.
- Volatility risk: This occurs as a result of changes in the levels of implied price volatility of the different market instruments on which derivatives are traded. This risk, unlike the others, is exclusively a component of trading in derivatives and is defined as a first-order convexity risk that is generated in all possible underlying assets in which there are products with options that require a volatility input for their valuation.
The metrics developed to control and monitor market risk in the BBVA Group are aligned with market practices and are implemented consistently across all the local market risk units.
Measurement procedures are established in terms of the possible impact of negative market conditions on the trading portfolio of the Group's Global Markets units, both under ordinary circumstances and in situations of heightened risk factors.
The standard metric used to measure market risk is Value at Risk (“VaR”), which indicates the maximum loss that may occur in the portfolios at a given confidence level (99%) and time horizon (one day). This statistic value is widely used in the market and has the advantage of summing up in a single metric the risks inherent to trading activity, taking into account how they are related and providing a prediction of the loss that the trading book could sustain as a result of fluctuations in equity prices, interest rates, foreign exchange rates and credit spreads. The market risk analysis considers various risks, such as credit spread risk, basis risk, as well as volatility and correlation risk.
With respect to the risk measurement models used by the BBVA Group, the Bank of Spain has authorized the use of the internal market risk model to determine bank capital requirements deriving from risk positions on the BBVA S.A. and BBVA Mexico trading book, which jointly accounted for around 77%, 72% and 72% of the Group’s trading-book market risk as of December 31, 2021, 2020 and 2019. For the rest of the geographical areas where the Group operates (applicable mainly to the Group ́s South America subsidiaries and Garanti BBVA), bank capital for the risk positions in the trading book is calculated using the Standardized Approach defined by the Basel Committee on Banking Supervision (which is referred to herein as the "standard model”).
The current management structure includes the monitoring of market-risk limits, consisting of a scheme of limits based on VaR, economic capital (based on VaR measurements) and VaR sub-limits, as well as stop-loss limits for each of the Group’s business units.
The model used estimates VaR in accordance with the historical simulation methodology, which involves estimating losses and gains that would have taken place in the current portfolio if the changes in market conditions that took place over a specific period of time in the past were repeated. Based on this information, it predicts the maximum expected loss of the current portfolio within a given confidence level. This model has the advantage of reflecting precisely the historical distribution of the market variables and not assuming any specific distribution of probability. The historical period used in this model is two years.
VaR figures are estimated with the following methodologies:
- VaR without smoothing, which awards equal weight to the daily information for the previous two years. This is currently the official methodology for measuring market risks for the purpose of monitoring compliance with risk limits.
- VaR with smoothing, which gives a greater weight to more recent market information. This metric supplements the previous one.
The use of VaR by historical simulation methodology as a risk metric has many advantages, but also certain limitations, among which it is worth highlighting:
- The estimate of the maximum daily loss of the Global Markets portfolio positions (with a confidence level of 99%) depends on the market movements of the last two years, not picking up the impact of large market events if they have not occurred within that historical window
- The use of the 99% confidence level does not consider potential losses that can occur beyond this level. To mitigate this limitation, different stress exercises are also performed, as described later.
At the same time, and following the guidelines established by the Spanish and European authorities, BBVA incorporates metrics in addition to VaR with the aim of meeting the Bank of Spain's regulatory requirements with respect to the calculation of bank capital for the trading book. Specifically, the measures incorporated in the Group since December 2011 (stipulated by Basel 2.5) are:
- VaR: In regulatory terms, the VaR charge incorporates the stressed VaR charge, and the sum of the two (VaR and stressed VaR) is calculated. This quantifies the losses associated with the movements of the risk factors inherent to market operations (including interest-rate risk, exchange-rate risk, equity risk and credit risk, among others). Both VaR and stressed VaR are rescaled by a regulatory multiplier (between three and four) and by the square root of ten to calculate the capital charge.
- Specific Risk - Incremental Risk Capital (“IRC”). Quantification of the risks of default and changes of the credit ratings of the bond and derivative positions and debt funds with daily look-through or significant benchmark (correlation > 90%) in the trading portfolio. The IRC charge is exclusively applied in entities in respect of which the internal market risk model is used (i.e. BBVA, S.A. and BBVA Mexico). The IRC charge is determined based on the associated losses (calculated at 99.9% confidence level over a one year horizon under the hypothesis of constant risk) due to a rating change and/or default of the issuer with respect to an asset. In addition, the price risk is included in sovereign positions for the specified items.
- Specific Risk: Securitization, correlation portfolios and Investment funds without look-through. Capital charges for securitizations and correlation portfolios are assessed based on the potential losses associated with the occurrence of a credit event in the underlying exposures. They are calculated by the standard model. The scope of the correlations portfolios refers to the First To Default (FTD)-type market operation and/or tranches of market CDOs and only for positions with an active market and hedging capacity. Capital charge for Funds include losses associated with volatility and credit risk of the underling positions of the fund. All charges are calculated by the standard model.
Validity tests are performed regularly on the risk measurement models used by the Group. They estimate the maximum loss that could have been incurred in the assessed positions with a certain level of probability (backtesting), as well as measurements of the impact of extreme market events on risk positions (stress testing). As an additional control measure, backtesting is conducted at a trading desk level in order to enable more specific monitoring of the validity of the measurement models.
Market risk in 2021
The Group’s market risk related to its trading portfolio remained in 2021 at low levels compared to other risks managed by BBVA, particularly credit risk. This is due to the nature of the business. In 2021 the average VaR was €29 million, above the figure of 2020, with a maximum level in the year reached on the day April 7, 2021 of €36 million. The evolution in the BBVA Group’s market risk during 2021, measured as VaR without smoothing (see Glossary) with a 99% confidence level and a 1-day horizon (shown in Millions of Euros) is as follows:
By type of market risk assumed by the Group's trading portfolio, the main risk factor for the Group continued to be that linked to interest rates, with a weight of 57% of the total at December 31, 2021 (this figure includes the spread risk). The relative weight of this risk has slightly increased compared with the close of 2020 (56%). Exchange-rate risk accounted for 16% of the total risk, decreasing its weight with respect to December 2020 (22%), while equity, volatility and correlation risk has increased, with a weight of 28% at the close of 2021 (vs. 22% at the close of 2020).
As of December 31, 2021, 2020 and 2019 the VaR was €31 million, €28 million and €20 million, respectively. The total VaR figures for 2021, 2020 and 2019 can be broken down as follows:º
VaR by Risk Factor (Millions of Euros)
| Interest/Spread risk | Currency risk | Stock-market | Vega/Correlation risk | Diversification | Total | |
|---|---|---|---|---|---|---|
| 2021 | ||||||
| VaR average in the year | 33 | 10 | 2 | 11 | (28) | 29 |
| VaR max in the year | 32 | 13 | 4 | 1 | (14) | 36 |
| VaR min in the year | 27 | 9 | 1 | 10 | (25) | 22 |
| End of period VaR | 34 | 9 | 5 | 11 | (29) | 31 |
| 2020 | ||||||
| VaR average in the year | 29 | 12 | 4 | 11 | (28) | 27 |
| VaR max in the year | 39 | 20 | 10 | 20 | (14) | 39 |
| VaR min in the year | 20 | 3 | 1 | 6 | (39) | 18 |
| End of period VaR | 32 | 12 | 2 | 11 | (29) | 28 |
| 2019 | ||||||
| VaR average in the year | 21 | 6 | 4 | 9 | (20) | 19 |
| VaR max in the year | 28 | 6 | 3 | 9 | (21) | 25 |
| VaR min in the year | 13 | 5 | 5 | 9 | (18) | 14 |
| End of period VaR | 24 | 5 | 5 | 8 | (22) | 20 |
- (*) The diversification effect is the difference between the sum of the average individual risk factors and the total VaR figure that includes the implied correlation between all the variables and scenarios used in the measurement.
Validation of the internal market risk model
The internal market risk model is validated on a regular basis by backtesting in both, BBVA, S.A. and Global Markets Mexico (in BBVA Mexico). The aim of backtesting is to validate the quality and precision of the internal market risk model used by BBVA Group to estimate the maximum daily loss of a portfolio, at a 99% level of confidence and a 250-day time horizon, by comparing the Group's results and the risk measurements generated by the internal market risk model. These tests showed that the internal market risk model of both, BBVA, S.A. and Global Markets Mexico is adequate and precise.
Two types of backtesting have been carried out in 2021, 2020 and 2019:
- "Hypothetical" backtesting: the daily VaR is compared with the results obtained, not taking into account the intraday results or the changes in the portfolio positions. This validates the appropriateness of the market risk metrics for the end-of-day position.
- "Real" backtesting: the daily VaR is compared with the total results, including intraday transactions, but discounting the possible minimum charges or fees involved. This type of backtesting includes the intraday risk in portfolios.
In addition, each of these two types of backtesting was carried out at a risk factor or business type level, thus making a deeper comparison of the results with respect to risk measurements.
For the period between the year ended December 31, 2020 and the year ended December 31, 2021, the backtesting of the internal VaR calculation model was carried out, comparing the daily results obtained to the risk level estimated by the internal VaR calculation model. In that period, there was one negative exception in BBVA S.A. In BBVA Mexico, there was also a negative exception.
At the end of the year the comparison showed the internal VaR calculation model was working correctly, within the "green" zone (0-4 exceptions), thus validating the internal VaR calculation model, as has been the case each year since the internal market risk model was approved for the Group.
Stress testing
A number of stress tests are carried out on the BBVA Group's trading portfolios. First, global and local historical scenarios are used that replicate the behavior of an extreme past event, such as for example the collapse of Lehman Brothers or the "Tequilazo" crisis. These stress tests are complemented with simulated scenarios, where the aim is to generate scenarios that have a significant impact on the different portfolios, but without being anchored to any specific historical scenario. Finally, for some portfolios or positions, fixed stress tests are also carried out that have a significant impact on the market variables affecting these positions.
Historical scenarios
The historical benchmark stress scenario for the BBVA Group is Lehman Brothers, whose sudden collapse in September 2008 led to a significant impact on the behavior of financial markets at a global level. The following are the most relevant effects of this historical scenario:
- Credit shock: reflected mainly in the increase of credit spreads and downgrades in credit ratings.
- Increased volatility in most of the financial markets (giving rise to a great deal of variation in the prices of different assets (currency, equity, debt).
- Liquidity shock in the financial systems, reflected by a major movement in interbank curves, particularly in the shortest sections of the euro and dollar curves.
Simulated scenarios
Unlike the historical scenarios, which are fixed and therefore not suited to the composition of the risk portfolio at all times, the scenario used for the exercises of economic stress is based on resampling methodology. This methodology is based on the use of dynamic scenarios that are recalculated periodically depending on the main risks affecting the trading portfolios. On a data window wide enough to collect different periods of stress (data are taken from January 1, 2008 until the date of the assessment), a simulation is performed by resampling of historic observations, generating a distribution of losses and gains that serve to analyze the most extreme of births in the selected historical window. The advantage of this methodology is that the period of stress is not predetermined, but depends on the portfolio maintained at each time, and making a large number of simulations (10,000 simulations) allows a greater richness of information for the analysis of expected shortfall than what is available in the scenarios included in the calculation of VaR.
The main features of this approach are: a) the generated simulations respect the correlation structure of the data, b) there is flexibility in the inclusion of new risk factors and c) it allows the introduction of a lot of variability in the simulations (desirable for considering extreme events).
The impact of the stress test under multivariable simulation of the risk factors of the portfolio based on the expected shortfall (expected shortfall calculated at a 97.5% confidence level, 20 days) as of December 31, 2021 is as follows:
Impact of the stress test (Millions of Euros)
| Europe | Mexico | Peru | Venezuela | Argentina | Colombia | Turkey | |
|---|---|---|---|---|---|---|---|
| Expected shortfall | (76) | (75) | (11) | — | (5) | (5) | (8) |
7.4.2 Financial instruments offset
Financial assets and liabilities may be netted in certain cases. In particular, they are presented for a net amount on the consolidated balance sheet only when the Group's entities satisfy the provisions of IAS 32-Paragraph 42, so they have both the legal right to net recognized amounts, and the intention of settling the net amount or of realizing the asset and simultaneously paying the liability.
In addition, the Group has presented as gross amounts assets and liabilities on the consolidated balance sheet for which there are master netting arrangements in place, but for which there is no intention of settling the net amount. The most common types of events that trigger the netting of reciprocal obligations are bankruptcy of the entity, surpassing certain level of indebtedness threshold, failure to pay, restructuring and dissolution of the entity.
In the current market context, derivatives are contracted under different framework contracts being the most widespread the ones developed by the International Swaps and Derivatives Association (“ISDA”) and, for the Spanish market, the Framework Agreement on Financial Transactions (“CMOF”). Almost all portfolio derivative transactions have been concluded under these framework contracts, including in them the netting clauses mentioned in the preceding paragraph as "Master Netting Agreement", greatly reducing the credit exposure on these instruments. Additionally, in contracts signed with counterparties, the collateral agreement annexes called Credit Support Annex (“CSA”) are included, thereby minimizing exposure to a potential default of the counterparty.
Moreover, many of the transactions involving assets purchased or sold under a repurchase agreement are transacted through clearing houses that articulate mechanisms to reduce counterparty risk, as well as through the signing of various master agreements for bilateral transactions, the most widely used being the Global Master Repurchase Agreement (GMRA), published by the International Capital Market Association (“ICMA”), to which the clauses related to the collateral exchange are usually added within the text of the master agreement itself.
A summary of the effect of offsetting (via netting and collateral) for derivatives and securities operations is presented below as of December 31, 2021, 2020 and 2019:
Effect of offsetting for derivatives and securities operation (Millions of Euros)
| Gross amounts not offset in the consolidated balance sheets (D) | |||||||
|---|---|---|---|---|---|---|---|
| Notes | Gross amounts recognized (A) | Gross amounts offset in the consolidated balance sheets (B) | Net amount presented in the consolidated balance sheets (C=A-B) | Financial instruments | Cash collateral received/ pledged | Net amount (E=C-D) | |
| December 2021 | |||||||
| Trading and hedging derivatives | 10, 15 | 36,349 | 3,611 | 32,737 | 22,524 | 8,758 | 1,456 |
| Reverse repurchase, securities borrowing and similar agreements | 54,296 | — | 54,296 | 55,010 | 2,213 | (2,927) | |
| Total assets | 90,645 | 3,611 | 87,034 | 77,534 | 10,971 | (1,471) | |
| Trading and hedging derivatives | 10, 15 | 37,916 | 3,584 | 34,331 | 22,524 | 10,119 | 1,688 |
| Repurchase, securities lending and similar agreementss | 54,159 | — | 54,159 | 58,174 | 679 | (4,694) | |
| Total liabilities | 92,074 | 3,584 | 88,490 | 80,698 | 10,798 | (3,006) | |
| December 2020 | |||||||
| Trading and hedging derivatives | 10, 15 | 47,862 | 5,688 | 42,173 | 33,842 | 9,018 | (686) |
| Reverse repurchase, securities borrowing and similar agreements | 32,121 | — | 32,121 | 32,762 | 161 | (802) | |
| Total Assets | 79,983 | 5,688 | 74,294 | 66,604 | 9,178 | (1,488) | |
| Trading and hedging derivatives | 10, 15 | 49,720 | 5,722 | 43,998 | 33,842 | 9,435 | 721 |
| Repurchase, securities lending and similar agreementss | 41,571 | — | 41,571 | 42,298 | 1,619 | (2,346) | |
| Total liabilities | 91,291 | 5,722 | 85,569 | 76,140 | 11,054 | (1,624) | |
| December 2019 | |||||||
| Trading and hedging derivatives | 10, 15 | 36,349 | 2,388 | 33,961 | 25,020 | 8,210 | 731 |
| Reverse repurchase, securities borrowing and similar agreements | 33,539 | 21 | 33,518 | 33,352 | 204 | (39) | |
| Total Assets | 69,888 | 2,409 | 67,479 | 58,372 | 8,415 | 692 | |
| Trading and hedging derivatives | 10, 15 | 38,693 | 2,394 | 36,299 | 25,020 | 10,613 | 667 |
| Repurchase, securities lending and similar agreementss | 43,712 | 21 | 43,691 | 42,974 | 420 | 297 | |
| Total liabilities | 82,404 | 2,414 | 79,990 | 67,993 | 11,033 | 964 | |
The amount of recognized financial instruments within derivatives includes the effect in case of compensation with counterparties with which the Group holds netting agreements, while, for repos, it reflects the market value of the collateral associated with the transaction.
7.5 Liquidity and funding risk
Liquidity and funding risk is defined as the incapacity of a bank in meeting its payment commitments due to lack of funds or that, to face those commitments, should have to make use of funding under burdensome terms.
7.5.1 Liquidity and Funding Strategy and Planning
The BBVA Group is a multinational financial institution whose business is focused mainly on retail and commercial banking activities. In addition to the retail business model, which forms its core business, the Group engages in corporate and investment banking, through the global CIB (Corporate & Investment Banking) division.
Liquidity and Funding Risk Management aims to maintain a solid balance sheet structure which allows a sustainable business model. The Group’s liquidity and funding strategy is based on the following pillars:
- The principle of the funding self-sufficiency of its subsidiaries, meaning that each of the Liquidity Management Units (LMU) must cover its funding needs independently on the markets where it operates. This avoids possible contagion due to a crisis affecting one or more of the Group’s LMUs.
- Stable customer deposits as the main source of funding in all the LMU, in accordance with the Group’s business model.
- Diversification of the sources of wholesale funding, in terms of maturity, market, instruments, counterparties and currencies, with recurring access to the markets.
- Compliance with regulatory requirements, ensuring the availability of ample liquidity buffers, of high quality, as well as sufficient instruments as required by regulations with the capacity to absorb losses.
- Compliance with the internal Liquidity Risk and Funding metrics, while adhering to the Risk Appetite level established for each LMU at any time.
Liquidity and Financing Risk Management aims, in the short term, to prevent an entity from having difficulties in meeting its payment commitments in due time and form or that, to meet them, it has to resort to obtaining funds in burdensome conditions that deteriorate the image or reputation of the entity.
In the medium term, its objective is to ensure the suitability of the Group's financial structure and its evolution, within the framework of the economic situation, the markets and regulatory changes.
This management of structural and liquidity funding is based on the principle of financial self-sufficiency of the entities that comprise it. This approach helps prevent and limit liquidity risk by reducing the Group’s vulnerability during periods of high risk. This decentralized management prevents possible contagion from a crisis affecting only one or a few Group entities, which must act independently to meet their liquidity requirements in the markets where they operate.
Within this strategy, the BBVA Group is organized into eleven LMUs compose of the parent company and the bank subsidiaries in each geography, plus the branches that depend on them.
In addition, the policy for managing liquidity and funding risk is also based on the model’s robustness and on the planning and integration of risk management into the budgeting process of each LMU, according to the financing risk appetite that it decides to assume in its business.
Liquidity and funding planning is part of the strategic processes for the Group’s budgetary and business planning. This objective is to allow a recurrent growth of the banking business with suitable maturities and costs within the established risk tolerance levels by using a wide range of instruments which allow the diversification of the funding sources and the maintenance of a high volume of available liquid assets.
7.5.2 Governance and monitoring
The responsibility for liquidity and funding management in the development of normal business activity lies with the Finance area as a first line of defense in managing the risks inherent to this activity, in accordance with the principles established by the European Banking Authority (EBA) and in line with the most demanding standards, policies, procedures and controls in the framework established by the governing bodies. Finance, through the Balance-Sheet Management area, plans and executes the funding of the structural long-term gap of each LMU and proposes to the Assets and Liabilities Committee (ALCO) the actions to be taken on this matter, in accordance with the policies established by the Risk Committee in line with the metrics of the Risk Appetite Framework approved by the Board of Directors.
Finance is also responsible for preparing the regulatory reporting of liquidity, coordinating with the responsible areas in each LGU the necessary processes to cover the requirements at corporate and regulatory level, ensuring the integrity of the information provided.
GRM is responsible for ensuring that the liquidity and financing risk in the Group is managed in accordance with the framework established by governing bodies. It also deals with the identification, measurement, monitoring and control of such risks and their communication to the relevant corporate bodies. In order to carry out this task properly, the risk function in the Group has been configured as a single, global function, independent of the management areas.
Additionally, the Group has, in its second line of defense, an Internal Risk Control unit, which performs an independent review of the control of Liquidity and Funding Risk, and a Financial Internal Control Unit that reviews the design and effectiveness of the controls operations on liquidity management and reporting.
As the third line of defense of the Group's internal control model, Internal Audit is in charge of reviewing specific controls and processes in accordance with a work plan that is drawn up annually.
The Group’s fundamental objectives regarding the liquidity and funding risk are determined through the Liquidity Coverage Ratio (LCR) and through the Loan-to-Stable Customer Deposits (LtSCD) ratio.
The LCR ratio is a regulatory metric that aims to guarantee the resilience of entities in a scenario of liquidity tension within a time horizon of 30 days. Within its risk appetite framework and system of limits and alerts, BBVA has established a required LCR compliance level for the entire Group and for each individual LMU. The internal levels required are aimed at efficiently meeting the regulatory requirement, at a widely level above 100%.
The LtSCD ratio measures the relationship between net lending and stable customer funds. The aim is to preserve a stable funding structure in the medium term for each of the LMU which make up the BBVA Group, taking into account that maintaining an adequate volume of stable customer funds is key to achieving a sound liquidity profile. In geographical areas with dual-currency balances, the indicator is also controlled by currency to manage the mismatches that might occur.
Stable customer funds are considered to be the financing obtained and managed from the LMU among their target customers. Those funds are characterized by their low sensitivity to market changes and by their less volatile behavior at aggregated level per operation due to the loyalty of the customer to the entity. The stable resources are calculated by applying to each identified customer segment a haircut determined by the analysis of the stability if the balances by which different aspects are evaluated (concentration, stability, level of loyalty). The main source of stable resources arises from wholesale funding and retail customer funds.
In order to establish the target (maximum) levels of LtSCD in each LMU and provide an optimal funding structure reference in terms of risk appetite, the corporate Structural Risks unit of GRM identifies and assesses the economic and financial variables that condition the funding structures in the different geographical areas.
Additionally, liquidity and funding risk management aims to achieve a proper diversification of the funding structure, avoiding excessive dependence on short-term funding by establishing a maximum level for the short-term funds raised, including both wholesale financing and the least stable proportion of customer funds In relation to long-term financing, the maturity profile does not present significant concentrations, which makes it possible to adapt the schedule of the planned issuance plan to the best financial conditions in the markets. Lastly, concentration risk is monitored at LMU level, with the aim of ensuring a correct diversification of both the counterparty and type of instrument.
One of the fundamental metrics within the general management framework of the liquidity and funding risk is the maintenance of a liquidity buffer consisting of high quality assets free of charges which can be sold or offered as collateral to obtain funding, either under normal market conditions or in stress situations.
The Finance is responsible for the collateral management and determining the liquidity buffer within the BBVA Group. According to the principle of auto-sufficiency of the Group's subsidiaries, each LMU is responsible for maintaining a buffer of liquid assets which complies with the regulatory requirements applicable under each jurisdiction. In addition, the liquidity buffer of each LMU must be aligned with the liquidity and funding risk tolerance as well as the management limits set and approved for each case.
In this context, the short-term resistance of the liquidity risk profile is promoted, ensuring that each LMU has sufficient collateral to deal with the risk of the closing of wholesale markets. Basic capacity is the internal metric for the management and control of shortterm liquidity risk, which is defined as the relationship between the explicit assets available and the maturities of wholesale liabilities and volatile resources, at different time periods up to one year, with special relevance at 30 and 90 days, with the objective of preserving the survival period above 3 months with the available buffer, without considering the balance inflows.
As a fundamental element of the liquidity and financing risk monitoring scheme, stress tests are carried out. They enable to anticipate deviations from the liquidity targets and the limits set in the appetite, and to establish tolerance ranges in the different management areas. They also play a major role in the design of the Liquidity Contingency Plan and the definition of specific measures to be adopted to rectify the risk profile if necessary.
For each scenario, it is checked whether BBVA has a sufficient stock of liquid assets to guarantee its capacity to meet the liquidity commitments/outflows in the different periods analyzed. The analysis considers four scenarios: one central and three crisis-related (systemic crisis; unexpected internal crisis with a considerable rating downgrade and/or affecting the ability to issue in wholesale markets and the perception of business risk by the banking intermediaries and the entity’s clients; and a mixed scenario, as a combination of the two aforementioned scenarios). Each scenario considers the following factors: existing market liquidity, customer behavior and sources of funding, the impact of rating downgrades, market values of liquid assets and collateral, and the interaction between liquidity requirements and the development of BBVA's credit quality.
The stress tests conducted on a regular basis by GRM reveal that BBVA maintains a sufficient buffer of liquid assets to deal with the estimated liquidity outflows in a scenario resulting from the combination of a systemic crisis and an unexpected internal crisis, during a period of longer than 3 months in general for the different LMU (including Turkey closing the year above 6 months), including in the scenario of a significant downgrade of the Bank’s rating by up to three notches.
Together with the results of the stress tests and the risk metrics, the early warning indicators play an important role within the corporate model and the Liquidity Contingency Plan. They are mainly indicators of the funding structure, in relation to asset encumbrance, counterparty concentration, flights of customer deposits, unexpected use of credit facilities, and of the market, which help anticipate possible risks and capture market expectations.
Finance is the area responsible for the elaboration, monitoring, execution and update of the liquidity and funding plan and of the market access strategy to guarantee and improve the stability and diversification of the wholesale funding sources.
In order to implement and establish management in an anticipated manner, limits are set on an annual basis for the main management metrics that form part of the budgeting process for the liquidity and funding plan. This framework of limits contributes to the planning of the joint future performance of:
- The loan book, considering the types of assets and their degree of liquidity, as well as their validity as collateral in collateralized funding.
- Stable customer funds, based on the application of a methodology for establishing which segments and customer balances are considered to be stable or volatile funds based on the principle of sustainability and recurrence of these funds.
- Projection of the credit gap, in order to require a degree of self-funding that is defined in terms of the difference between the loan-book and stable customer funds.
- Incorporating the planning of securities portfolios into the banking book, which include both fixed-interest and equity securities, and are classified as financial assets at fair value through other comprehensive income and at amortized cost, and additionally on trading portfolios.
- The structural gap projection, as a result of assessing the funding needs generated both from the credit gap and by the securities portfolio in the banking book, together with the rest of on-balance-sheet wholesale funding needs, excluding trading portfolios. This gap therefore needs to be funded with customer funds that are not considered stable or on wholesale markets.
As a result of these funding needs, the BBVA Group plans the target wholesale funding structure according to the tolerance set in each LMU target.
Thus, once the structural gap has been identified and after resorting to wholesale markets, the amount and composition of wholesale structural funding is established in subsequent years, in order to maintain a diversified funding mix and guarantee that there is not a high reliance on short-term funding (short-term wholesale funding plus volatile customer funds).
In practice, the execution of the principles of planning and self-funding at the different LMU results in the Group’s main source of funding being customer deposits, which consist mainly of demand deposits, savings deposits and time deposits.
As sources of funding, customer deposits are complemented by access to the interbank market and the domestic and international capital markets in order to address additional liquidity requirements, implementing domestic and international programs for the issuance of commercial paper and medium and long-term debt.
The process of analysis and assessment of the liquidity and funding situation and of the inherent risks is a process carried out on an ongoing basis in the BBVA Group, with the participation of all the Group areas involved in liquidity and funding risk management. This process is carried out at both local and corporate level. It is incorporated into the decision- making process for liquidity and funding management, with integration between the risk appetite strategy and establishment and the planning process, the funding plan and the limits scheme.
7.5.3 Liquidity and funding performance
The BBVA Group maintains a robust and dynamic funding structure with a predominantly retail nature, where customer resources represent the main source of funding.
During 2021, liquidity conditions have remained comfortable in all the countries where the BBVA Group operates. The global crisis caused by COVID-19 had a significant impact on financial markets. The effects of this crisis on the Group's balance sheets materialized fundamentally at first, through greater credit line withdrawals by wholesale clients in view of the worsening financing conditions in the markets, with no significant effect on the retail portfolio. These withdrawals were largely paid off over the following quarters. Dealing with this situation of initial uncertainty, the different central banks provided a joint response through specific measures and programs, whose extension, in some cases, has been prolonged during 2021, to facilitate the financing of the real economy and the provision of liquidity in financial markets, supporting the soundness of liquidity buffers in almost all areas with BBVA presence.
The performance of the indicators show that the robustness of the funding structure remained steady during 2021, 2020 and 2019, in the sense that all LMU held self-funding levels with stable customer resources above the requirements.
LtSCD by LMU
| 2021 | 2020 | 2019 | |
|---|---|---|---|
| Group (average) | 95% | 95% | 108% |
| BBVA S.A. | 98% | 97% | 108% |
| BBVA Mexico | 93% | 98% | 116% |
| Garanti BBVA | 81% | 95% | 99% |
| Other LMU | 93% | 86% | 103% |
With respect to LCR, the Group has maintained a liquidity buffer at both a consolidated and individual level in 2021. As a result, the ratio has remained comfortably above 100%, with the consolidated ratio as of December 31, 2021 standing at 165%.
Although this requirement is only established at a Group level, for banks in the Eurozone, the minimum level required is comfortably exceeded in all subsidiaries. It should be noted that the calculation of the Consolidated LCR does not allow the transfer of liquidity between subsidiaries, so no excess liquidity may be transferred from these entities for the purpose of calculating the consolidated ratio. If the impact of these highly liquid assets was considered, the LCR would be 213%, or +48 basis points above the required level.
LCR main LMU
| 2021 | 2020 | 2019 | |
|---|---|---|---|
| Group | 165% | 149% | 129% |
| BBVA S.A. | 190% | 173% | 147% |
| BBVA Mexico | 245% | 196% | 147% |
| Garanti BBVA | 211% | 183% | 206% |
One of the key elements in BBVA's Group liquidity and funding management is the maintenance of large high quality liquidity buffers in all business areas where the group operates.
Each entity maintains a sound liquidity buffer at the individual level for BBVA, S.A. and for each of its subsidiaries, such as BBVA Mexico, Garanti BBVA and the Latin American subsidiaries. In general, this buffer has been strengthened during 2021 in the LMU.
In this respect, the Group has maintained for the last 12 months an average volume of high quality liquid assets (HQLA) amounting to €138.2 billion, among which, 93% correspond to maximum quality assets (LCR Level 1).
The table below shows the liquidity available by instrument as of December 31, 2021, 2020 and 2019 for the most significant entities based on prudential supervisor’s information (Commission Implementing Regulations (EU) 2017/2114 of November 9, 2017):
Liquidity available by instrument (Millions of Euros)
| BBVA S.A. | BBVA Mexico | Garanti BBVA | Other | |||||||||
|---|---|---|---|---|---|---|---|---|---|---|---|---|
| 2021 | 2020 | 2019 | 2021 | 2020 | 2019 | 2021 | 2020 | 2019 | 2021 | 2020 | 2019 (*) | |
| Cash and withdrawable central bank reserves | 35,258 | 39,330 | 14,516 | 12,146 | 8,930 | 6,246 | 8,179 | 6,153 | 6,450 | 6,469 | 6,831 | 11,317 |
| Level 1 tradable assets | 37,272 | 48,858 | 41,961 | 13,881 | 9,205 | 7,295 | 5,549 | 7,019 | 7,953 | 6,036 | 6,237 | 14,930 |
| Level 2A tradable assets | 5,234 | 5,119 | 403 | 74 | 106 | 316 | — | — | — | — | — | 344 |
| Level 2B tradable assets | 9,492 | 6,080 | 5,196 | 28 | 11 | 219 | — | — | — | 2 | — | 12 |
| Other tradable assets | 27,870 | 20,174 | 22,213 | 343 | 421 | 1,269 | 722 | 701 | 669 | 934 | 745 | 1,538 |
| Non tradable assets eligible for central banks | — | — | — | — | — | — | — | — | — | — | — | 2,935 |
| Cumulated counterbalancing capacity | 115,127 | 119,560 | 84,288 | 26,472 | 18,672 | 15,344 | 14,449 | 13,873 | 15,072 | 13,440 | 13,814 | 31,075 |
(*) In 2019 it includes the balance of the companies in the United States (see Notes 1.3, 3 and 21).
The Net Stable Funding Ratio (NSFR), defined as the result between the amount of stable funding available and the amount of stable funding required, requiring banks to maintain a stable financing profile in relation to the composition of their assets and off-balance sheet activities. This ratio should be at least 100% at all times. The NSFR ratio of the BBVA Group, calculated by applying the regulatory criteria established in Regulation (EU) 2019/876 of the European Parliament and of the Council, of May 20, 2019, entered into force in June 2021, and stood at 135% as of December 31, 2021.
The NSFR of BBVA Group and its main LMU at December 31, 2021, 2020 and 2019, was the following:
NSFR main LMU
| 2021 | 2020(*) | 2019(*) | |
|---|---|---|---|
| Group | 135% | 127% | 120% |
| BBVA S.A. | 126% | 121% | 113% |
| BBVA Mexico | 149% | 138% | 130% |
| Garanti BBVA | 162% | 154% | 151% |
(*) Ratio calculated based on the Basel requirements for 2019 and 2020.
Below is a matrix of residual maturities by contractual periods based on supervisory prudential reporting as of December 31, 2021, 2020 and 2019:
December 2021. Contractual Maturities (Millions of Euros)
| Demand | Up to 1 month |
1 to 3 months |
3 to 6 months |
6 to 9 months |
9 to 12 months |
1 to 2 years | 2 to 3 years | 3 to 5 years | Over 5 years |
Total | |
|---|---|---|---|---|---|---|---|---|---|---|---|
| ASSETS | |||||||||||
| Cash, cash balances at central banks and other demand deposits | 39,761 | 24,598 | — | — | — | — | — | — | — | — | 64,359 |
| Deposits in credit entities | — | 3,781 | 400 | 790 | 373 | 299 | 211 | 166 | 8 | 26 | 6,056 |
| Deposits in other financial institutions | 2 | 901 | 801 | 584 | 727 | 432 | 694 | 470 | 261 | 469 | 5,343 |
| Reverse repo, securities borrowing and margin lending | — | 33,856 | 11,611 | 2,945 | 1,063 | 1,692 | 2,188 | 2,239 | 1,118 | 739 | 57,451 |
| Loans and advances | 174 | 18,531 | 23,185 | 22,141 | 11,769 | 13,782 | 39,656 | 30,049 | 44,508 | 94,780 | 298,574 |
| Securities' portfolio settlement | 10 | 1,779 | 3,606 | 3,395 | 2,333 | 3,958 | 18,854 | 13,135 | 17,214 | 47,331 | 111,614 |
December 2021. Contractual maturities (Millions of Euros)
| Demand | Up to 1 month |
1 to 3 months |
3 to 6 months |
6 to 9 months |
9 to 12 months |
1 to 2 years | 2 to 3 years | 3 to 5 years | Over 5 years |
Total | |
|---|---|---|---|---|---|---|---|---|---|---|---|
| LIABILITIES | |||||||||||
| Wholesale funding | — | 3,065 | 1,077 | 3,498 | 2,914 | 1,885 | 9,477 | 4,931 | 12,332 | 19,991 | 59,169 |
| Deposits in financial institutions | 1,936 | 4,257 | 415 | 825 | 183 | 924 | 496 | 146 | 146 | 579 | 9,907 |
| Deposits in other financial institutions and international agencies | 8,894 | 2,728 | 1,700 | 382 | 289 | 227 | 578 | 231 | 337 | 722 | 16,087 |
| Customer deposits | 281,812 | 28,806 | 11,814 | 4,867 | 1,717 | 1,520 | 1,740 | 578 | 863 | 416 | 334,132 |
| Security pledge funding | — | 52,437 | 6,858 | 2,485 | 1,513 | 8,252 | 29,954 | 5,527 | 4,755 | 1,490 | 113,269 |
| Derivatives, net | (33) | (395) | (176) | (326) | (66) | (641) | 100 | (122) | (155) | (66) | (1,880) |
December 2020. Contractual maturities (Millions of Euros)
| Demand | Up to 1 month |
1 to 3 months |
3 to 6 months |
6 to 9 months |
9 to 12 months |
1 to 2 years | 2 to 3 years | 3 to 5 years | Over 5 years |
Total | |
|---|---|---|---|---|---|---|---|---|---|---|---|
| ASSETS | |||||||||||
| Cash, cash balances at central banks and other demand deposits | 42,518 | 32,741 | — | — | — | — | — | — | — | — | 75,258 |
| Deposits in credit entities | — | 3,616 | 677 | 921 | 356 | 461 | 117 | 120 | 2 | 39 | 6,309 |
| Deposits in other financial institutions | — | 2,202 | 855 | 797 | 734 | 543 | 1,251 | 721 | 515 | 500 | 8,119 |
| Reverse repo, securities borrowing and margin lending | — | 20,033 | 4,757 | 1,351 | 364 | 368 | 3,320 | 1,849 | 891 | 1,089 | 34,021 |
| Loans and advances | 279 | 16,939 | 24,280 | 23,012 | 15,579 | 17,032 | 46,182 | 38,851 | 51,709 | 110,173 | 344,036 |
| Securities' portfolio settlement | — | 3,896 | 6,680 | 6,557 | 5,084 | 13,014 | 9,858 | 15,494 | 17,231 | 50,045 | 127,859 |
(*) It includes the balance of the companies in the United States (see Notes 1.3, 3 and 21).
December 2020. Contractual maturities (Millions of Euros)
| Demand | Up to 1 month |
1 to 3 months |
3 to 6 months |
6 to 9 months |
9 to 12 months |
1 to 2 years | 2 to 3 years | 3 to 5 years | Over 5 years |
Total | |
|---|---|---|---|---|---|---|---|---|---|---|---|
| LIABILITIES | |||||||||||
| Wholesale funding | — | 4,750 | 2,618 | 3,963 | 1,283 | 1,543 | 10,573 | 7,505 | 12,793 | 23,839 | 68,868 |
| Deposits in financial institutions | 8,838 | 7,859 | 254 | 741 | 152 | 726 | 825 | 189 | 166 | 371 | 20,120 |
| Deposits in other financial institutions and international agencies | 12,735 | 4,324 | 2,694 | 588 | 353 | 272 | 957 | 337 | 459 | 870 | 23,589 |
| Customer deposits | 308,360 | 39,978 | 13,416 | 6,808 | 4,526 | 4,366 | 3,361 | 1,213 | 869 | 799 | 383,694 |
| Security pledge funding | — | 41,239 | 5,301 | 1,643 | 1,192 | 368 | 11,304 | 28,510 | 3,740 | 1,516 | 94,812 |
| Derivatives, net | — | (722) | 15 | (961) | (85) | 134 | (400) | (157) | (264) | (159) | (2,599) |
(*) It includes the balance of the companies in the United States (see Notes 1.3, 3 and 21).
December 2019. Contractual maturities (Millions of Euros)
| Demand | Up to 1 month |
1 to 3 months |
3 to 6 months |
6 to 9 months |
9 to 12 months |
1 to 2 years | 2 to 3 years | 3 to 5 years | Over 5 years |
Total | |
|---|---|---|---|---|---|---|---|---|---|---|---|
| ASSETS | |||||||||||
| Cash, cash balances at central banks and other demand deposits |
20,954 | 20,654 | — | — | — | — | — | — | — | — | 41,608 |
| Deposits in credit entities | — | 3,591 | 283 | 488 | 585 | 503 | 189 | 24 | 120 | 432 | 6,216 |
| Deposits in other financial institutions | — | 1,336 | 1,120 | 796 | 589 | 991 | 1,420 | 1,072 | 672 | 2,089 | 10,084 |
| Reverse repo, securities borrowing and margin lending |
— | 21,612 | 3,858 | 2,287 | 561 | 808 | 4,121 | 1,838 | 411 | 803 | 36,299 |
| Loans and advances | 157 | 22,015 | 25,056 | 24,994 | 15,777 | 16,404 | 42,165 | 35,917 | 54,772 | 122,098 | 359,354 |
| Securities' portfolio settlement | — | 1,622 | 3,873 | 6,620 | 2,017 | 7,292 | 21,334 | 6,115 | 13,240 | 46,022 | 108,136 |
(*) It includes the balance of the companies in the United States (see Notes 1.3, 3 and 21).
December 2019. Contractual Maturities (Millions of Euros)
| Demand | Up to 1 month |
1 to 3 months |
3 to 6 months |
6 to 9 months |
9 to 12 months |
1 to 2 years | 2 to 3 years | 3 to 5 years | Over 5 years |
Total | |
|---|---|---|---|---|---|---|---|---|---|---|---|
| LIABILITIES | |||||||||||
| Wholesale funding | 1 | 1,393 | 1,714 | 4,208 | 1,645 | 4,386 | 8,328 | 10,608 | 10,803 | 27,840 | 70,927 |
| Deposits in financial institutions | 7,377 | 7,608 | 493 | 1,122 | 172 | 1,514 | 386 | 614 | 206 | 510 | 20,004 |
| Deposits in other financial institutions and international agencies |
10,177 | 3,859 | 867 | 381 | 367 | 257 | 982 | 503 | 499 | 952 | 18,843 |
| Customer deposits | 271,638 | 43,577 | 18,550 | 10,013 | 7,266 | 6,605 | 3,717 | 2,062 | 854 | 1,039 | 365,321 |
| Security pledge funding | — | 45,135 | 3,202 | 15,801 | 1,456 | 653 | 3,393 | 7,206 | 759 | 1,308 | 78,914 |
| Derivatives, net | — | (66) | (25) | 29 | (11) | 1,097 | (830) | (278) | (333) | (420) | (838) |
- (*) It includes the balance of the companies in the United States (see Notes 1.3, 3 and 21).
With regard to the financing structure, the loan portfolio is mostly financed by retail deposits. The “demand” maturity bucket mainly contains the retail customer sight accounts whose behavior historically showed a high level of stability and little concentration. According to a behavior analysis which is done every year in every entity, this type of account is considered to be stable and for liquidity risk purposes receive a better treatment.
The most relevant aspects related to the main geographical areas are the following:
- In the Eurozone, BBVA has continued to maintain a sound position with a large high-quality liquidity buffer. During 2021, commercial activity has drawdown liquidity amounting to approximately €9 billion due to the increase in lending activity, especially in the last quarter of the year, as well as the decrease in the volume of deposits, mainly wholesale. It should also be noted that in the second quarter of 2021, the payment of the BBVA USA sale transaction was collected. In addition, in March 2021, BBVA S.A. took part in the TLTRO III liquidity window program to take advantage of the improved conditions announced by the European Central Bank (ECB) in December 2020, with an amount drawn of €3.5 billion that, together with the €34.9 billion available at the end of December 2020 , amount to €38.4 billion at the end of December 2021.
- In BBVA Mexico, commercial activity has provided liquidity between January and December 2021 in the amount of approximately 73 billion Mexican pesos, derived from a higher growth in customer funds compared to the growth in lending activity. This increased liquidity is expected to be reduced due to the recovery in lending activity expected in 2022. This solid liquidity position has contributed to an efficient policy in the cost of funding, in an environment of higher interest rates. In terms of wholesale issuances, there was no need to refinance any maturities in 2021, having matured in 2021 a subordinated issue amounting to USD 750 million and a senior issue amounting to 4,500 million Mexican pesos.
- In the fourth quarter, the Central Bank of the Republic of Turkey made a series of cuts in benchmark rates, despite the increases in the inflation rate, for a total of 400 basis points to 14%, triggering an adverse reaction from the markets and severe currency depreciation. In order to alleviate the depreciation of the currency, during the month of December, the Turkish government implemented a new mechanism to encourage local currency deposits. During 2021, the lending gap in local currency has widened, with a higher increase in loans than in deposits, while the lending gap in foreign currency has narrowed, due to a decline in loans and an increase in deposits. Garanti BBVA continues to maintain a stable liquidity position with comfortable ratios.
- In South America, the liquidity situation remains adequate throughout the region, despite the fact that central banks in the region have started rate hike cycles and withdrawal of stimulus programs that mitigate the impact of the COVID-19 crisis. In Argentina, liquidity in the system and in BBVA continues to increase due to the higher growth in deposits than in loans in local currency. In BBVA Colombia, activity picks up accompanied by the growth in deposits. BBVA Peru maintains solid levels of liquidity, while reducing excess liquidity due to growth in lending activity, combined with a contraction of deposits, following a costs control strategy.
The main wholesale financing transactions carried out by the companies of the BBVA Group are listed below:
- In March 2021, BBVA S.A. issued a senior preferred debt for an amount of €1 billion, with a maturity of 6 years and an option for early redemption after five years. In September 2021, BBVA S.A. issued a floating rate senior preferred bond totaling €1 billion and maturing in 2 years, the fifth issue made by BBVA linked to environmental, social and governance (ESG) criteria. Additionally, in January 2022, BBVA S.A. issued a €1 billion senior non-preferred bond, with a maturity of 7 years and an option for early redemption in the sixth year, with a coupon of 0.875%.
- In Turkey, there have been no issuances in 2021. The Bank renewed its syndicated loans in June and November, indexed to sustainability criteria. On June 2, BBVA Garanti renewed 100% of a syndicated loan, formed by two separate tranches, amounting to USD 279m and €294m, with a 1-year maturity and a cost of Libor +2.50% and Euribor +2.25%, respectively. In November, the Bank renewed 100% of the second tranche of the mentioned loan, for USD 365m and €247m, at a cost of Libor + 2.15% and Euribor + 1.75% respectively.
- In South America, BBVA Uruguay issued in February 2021 the first sustainable bond on the Uruguayan financial market for USD 15m at an initial interest rate of 3.854%.
The liquidity position of the rest of subsidiaries has continued to be sound, maintaining a solid liquidity position in all the jurisdictions in which the Group operates.
In this context, BBVA has maintained its objective of strengthening the funding structure of the different Group entities based on growing their self-funding from stable customer funds, while guaranteeing a sufficient buffer of fully available liquid assets, diversifying the various sources of funding available, and optimizing the generation of collateral available for dealing with stress situations in the markets.
7.5.4 Asset encumbrance
As of December 31, 2021, 2020 and 2019, the encumbered (those provided as collateral for certain liabilities) and unencumbered assets are broken down as follows:
Encumbered and unencumbered assets (Millions of Euros)
| Encumbered assets | Unencumbered assets assets | |||||||||||
|---|---|---|---|---|---|---|---|---|---|---|---|---|
| Book value | Fair value | Book value | Fair value | |||||||||
| 2021 | 2020 | 2019 | 2021 | 2020 | 2019 | 2021 | 2020 | 2019 | 2021 | 2020 | 2019 | |
| Assets | 114,336 | 121,999 | 101,792 | 548,548 | 614,260 | 596,898 | ||||||
| Equity instruments | 307 | 2,134 | 3,526 | 307 | 2,134 | 3,526 | 22,280 | 14,556 | 12,113 | 22,280 | 14,556 | 12,113 |
| Debt securities | 31,557 | 29,379 | 29,630 | 29,527 | 26,112 | 29,567 | 89,307 | 100,108 | 95,611 | 89,307 | 100,108 | 95,611 |
| Loans and advances and other assets | 82,472 | 90,486 | 68,636 | 436,962 | 499,595 | 489,174 | ||||||
The committed value of "Loans and Advances and other assets" corresponds mainly to loans linked to the issue of covered bonds, territorial bonds or long-term securitized bonds (see Note 22.4) as well as those used as a guarantee to access certain funding transactions with central banks. Debt securities and equity instruments correspond to underlying that are delivered in repos with different types of counterparties, mainly clearing houses or credit institutions, and to a lesser extent central banks. Collateral provided to guarantee derivative transactions is also included as committed assets.
As of December 31, 2021, 2020 and 2019, collateral pledges received mainly due to repurchase agreements and securities lending, and those which could be committed in order to obtain funding are provided below:
Collateral received (Millions of Euros)
| Fair value of encumbered collateral received or own debt securities issued | Fair value of collateral received or own debt securities issued available for encumbrance | Fair value of collateral received or own debt securities issued not available | |||||||
|---|---|---|---|---|---|---|---|---|---|
| 2021 | 2020 | 2019 | 2021 | 2020 | 2019 | 2021 | 2020 | 2019 | |
| Collateral received | 40,905 | 30,723 | 38,496 | 17,029 | 8,652 | 9,208 | 1,719 | 1,071 | 48 |
| Equity instruments | 289 | 239 | 65 | 265 | 204 | 70 | — | — | — |
| Debt securities | 40,616 | 30,484 | 38,431 | 16,764 | 8,448 | 9,130 | 1,719 | 1,071 | 38 |
| Loans and advances and other assets | — | — | — | — | — | 8 | — | — | 10 |
| Own debt securities issued other than own covered bonds or ABSs | — | 3 | — | 50 | 94 | 82 | — | — | — |
The guarantees received in the form of reverse repurchase agreements or security lending transactions are committed by their use in repurchase agreements, as is the case with debt securities.
As of December 31, 2021, 2020 and 2019, financial liabilities issued related to encumbered assets in financial transactions as well as their book value were as follows:
Sources of encumbrance (Millions of Euros)
| Matching liabilities, contingent liabilities or securities lent | Assets, collateral received and own debt securities issued other than covered bonds and ABSs encumbered | |||||
|---|---|---|---|---|---|---|
| 2021 | 2020 | 2019 | 2021 | 2020 | 2019 | |
| Book value of financial liabilities | 137,242 | 131,352 | 124,252 | 151,275 | 147,523 | 135,500 |
| Derivatives | 15,368 | 16,611 | 19,066 | 15,191 | 16,348 | 20,004 |
| Deposits | 109,311 | 98,668 | 87,906 | 120,957 | 111,726 | 94,240 |
| Outstanding subordinated debt | 12,563 | 16,073 | 17,280 | 15,127 | 19,449 | 21,256 |
| Other sources | 620 | 653 | 449 | 3,966 | 5,202 | 4,788 |
8. Fair value of financial instruments
Framework and processes control
As part of the process established in the Group for determining the fair value in order to ensure that financial assets and liabilities are properly following the IFRS 13 principles: Fair value is the price that would be received to sell an asset or paid to transfer a liability in an orderly transaction between market participants in the principal market or most advantageous market, at the measurement date.
BBVA has established, at a geographic level, a structure of Risk Operational Admission and Product Governance Committees responsible for validating and approving new products or types of financial assets and liabilities before being contracted. Local management responsible for valuation, which are independent from the business (see Management Report - Risk) are members of these committees.
These areas are required to ensure, prior to the approval stage, the existence of not only technical and human resources, but also adequate informational sources to measure the fair value of these financial assets and liabilities, in accordance with the rules established by the valuation global area and using models that have been validated and approved by the responsible areas complying with the governance of BBVA Group's official models.
Fair value hierarchy
All financial instruments, both assets and liabilities are initially recognized at fair value, which at that point is equivalent to the transaction price, unless there is evidence to the contrary in the market. Subsequently, depending on the type of financial instrument, it may continue to be recognized at amortized cost or fair value through adjustments in the consolidated income statement or equity.
When possible, the fair value is determined as the market price of a financial instrument. However, for many of the financial assets and liabilities of the Group, especially in the case of derivatives, there is no market price available, so its fair value is estimated on the basis of the price established in recent transactions involving similar instruments or, in the absence thereof, by using mathematical measurement models that are sufficiently tried and trusted by the international financial community. The estimates of the fair value derived from the use of such models take into consideration the specific features of the asset or liability to be measured and, in particular, the various types of risk associated with such asset or liability. However, the limitations inherent in the measurement models and possible inaccuracies in the assumptions and parameters required by these models may mean that the estimated fair value of an asset or liability does not exactly match the price for which the asset or liability could be exchanged or settled on the date of its measurement.
Additionally, for financial assets and liabilities that show significant uncertainty in inputs or model parameters used for valuation, criteria is established to measure said uncertainty and activity limits are set based on these. Finally, these measurements are compared, as much as possible, against other sources such as the measurements obtained by the business teams or those obtained by other market participants.
The process for determining the fair value requires the classification of the financial assets and liabilities according to the measurement processes used as set forth below:
- Level 1: Valuation using directly the quotation of the instrument, observable and readily and regularly available from independent price sources and referenced to active markets that the entity can access at the measurement date. The instruments classified within this level are fixed-income securities, equity instruments and certain derivatives.
- Level 2: Valuation of financial instruments with commonly accepted techniques that use inputs obtained from observable data in markets.
- Level 3: Valuation of financial instruments with valuation techniques that use significant unobservable inputs in the market. As of December 31, 2021, the affected instruments at fair value accounted for approximately 0.74% of financial assets and 0.35% of the Group’s financial liabilities. Model selection and validation is undertaken by control areas outside the business areas.
8.1 Fair value of financial instruments
The fair value of the Group’s financial instruments in the accompanying consolidated balance sheets and its corresponding carrying amounts, as of December 31, 2021, 2020 and 2019 are presented below:
Fair Value and Carrying Amount (Millions of Euros)
| 2021 | 2020 | 2019 | |||||
|---|---|---|---|---|---|---|---|
| Notes | Carrying amount | Fair value | Carrying amount | Fair value | Carrying amount | Fair value | |
| ASSETS | |||||||
| Cash, cash balances at central banks and other demand deposits | 9 | 67,799 | 67,799 | 65,520 | 65,520 | 44,303 | 44,303 |
| Financial assets held for trading | 10 | 123,493 | 123,493 | 105,878 | 105,878 | 99,469 | 99,469 |
| Non-trading financial assets mandatorily at fair value through profit or loss | 11 | 6,086 | 6,086 | 5,198 | 5,198 | 5,557 | 5,557 |
| Financial assets designated at fair value through profit or loss | 12 | 1,092 | 1,092 | 1,117 | 1,117 | 1,214 | 1,214 |
| Financial assets at fair value through other comprehensive income | 13 | 60,421 | 60,421 | 69,440 | 69,440 | 61,183 | 61,183 |
| Financial assets at amortized cost | 14 | 372,676 | 377,451 | 367,668 | 374,267 | 439,162 | 442,788 |
| Derivatives – Hedge accounting | 15 | 1,805 | 1,805 | 1,991 | 1,990 | 1,729 | 1,729 |
| LIABILITIES | |||||||
| Financial liabilities held for trading | 10 | 91,135 | 91,135 | 84,109 | 84,109 | 86,414 | 86,413 |
| Financial liabilities designated at fair value through profit or loss | 12 | 9,683 | 9,683 | 10,050 | 10,050 | 10,010 | 10,010 |
| Financial liabilities at amortized cost | 22 | 487,893 | 488,733 | 490,606 | 491,006 | 516,641 | 515,910 |
| Derivatives – Hedge accounting | 15 | 2,626 | 2,626 | 2,318 | 2,318 | 2,233 | 2,233 |
Not all financial assets and liabilities are recorded at fair value, so below we provide the information on financial instruments recorded at fair value and subsequently the information of those recorded at amortized cost (including their fair value although this value is not used when accounting for these instruments).
8.1.1 Fair value of financial instruments recognized at fair value, according to valuation criteria
Below are the different elements used in the valuation technique of financial instruments.
Active Market
BBVA considers an active market as a market that allows the observation of bid and offer prices representative of the levels to which the market participants are willing to negotiate an asset, with sufficient frequency and volume.
Furthermore, BBVA would consider as traded in an “Organized Market” quotations for assets or liabilities from Over The Counter (OTC) markets when they are obtained from independent sources, observable on a daily basis and fulfil certain conditions.
The following table shows the financial instruments carried at fair value in the accompanying consolidated balance sheets, broken down by level used to determine their fair value as of December 31, 2021, 2020 and 2019:
Fair Value of Financial Instruments by Levels (Millions of Euros)
| 2021 | 2020 | 2019 | |||||||
|---|---|---|---|---|---|---|---|---|---|
| Level 1 | Level 2 | Level 3 | Level 1 | Level 2 | Level 3 | Level 1 | Level 2 | Level 3 | |
| ASSETS | |||||||||
| Financial assets held for trading | 32,371 | 87,736 | 3,386 | 32,555 | 71,938 | 1,386 | 31,135 | 67,262 | 1,072 |
| Equity instruments | 15,925 | — | 37 | 11,367 | 31 | 60 | 8,832 | — | 59 |
| Debt securities | 11,877 | 13,725 | 189 | 12,790 | 11,123 | 57 | 18,076 | 8,178 | 55 |
| Loans and advances | 615 | 47,279 | 2,913 | 2,379 | 26,741 | 1,148 | 697 | 30,491 | 849 |
| Derivatives | 3,954 | 26,732 | 247 | 6,019 | 34,043 | 121 | 3,530 | 28,593 | 109 |
| Non-trading financial assets mandatorily at fair value through profit or loss | 4,378 | 522 | 1,186 | 3,826 | 381 | 992 | 4,305 | 92 | 1,160 |
| Equity instruments | 4,158 | 394 | 751 | 3,612 | 57 | 465 | 4,223 | 1 | 103 |
| Debt securities | — | 128 | — | 4 | 324 | 28 | — | 91 | 19 |
| Loans and advances | 220 | — | 435 | 210 | — | 499 | 82 | — | 1,038 |
| Financial assets designated at fair value through profit or loss | 916 | 176 | — | 939 | 178 | — | 1,214 | — | — |
| Equity instruments | — | — | — | — | — | — | — | — | — |
| Debt securities | 916 | 176 | — | 939 | 178 | — | 1,214 | — | — |
| Loans and advances | — | — | — | — | — | — | — | — | — |
| Financial assets at fair value through other comprehensive income | 52,157 | 7,545 | 719 | 60,976 | 7,866 | 598 | 50,896 | 9,203 | 1,084 |
| Equity instruments | 1,178 | 36 | 106 | 961 | 34 | 105 | 1,794 | 146 | 480 |
| Debt securities | 50,952 | 7,509 | 613 | 59,982 | 7,832 | 493 | 49,070 | 9,057 | 604 |
| Loans and advances | 27 | — | — | 33 | — | — | 33 | — | — |
| Derivatives – Hedge accounting | 63 | 1,733 | 9 | 120 | 1,862 | 8 | 44 | 1,685 | — |
| LIABILITIES | |||||||||
| Financial liabilities held for trading | 26,215 | 64,305 | 615 | 27,587 | 56,127 | 395 | 26,266 | 59,438 | 710 |
| Trading derivatives | 4,755 | 26,560 | 389 | 7,402 | 34,046 | 232 | 4,425 | 29,466 | 175 |
| Short positions | 15,124 | 11 | — | 11,805 | 504 | 3 | 12,246 | 1 | 2 |
| Deposits | 6,335 | 37,733 | 226 | 8,381 | 21,577 | 159 | 9,595 | 29,971 | 533 |
| Financial liabilities designated at fair value through profit or loss | 1 | 8,243 | 1,439 | — | 8,558 | 1,492 | — | 8,629 | 1,382 |
| Customer deposits | — | 809 | — | — | 902 | — | — | 944 | — |
| Debt certificates | 1 | 1,956 | 1,439 | — | 3,038 | 1,492 | — | 3,274 | 1,382 |
| Other financial liabilities | — | 5,479 | — | — | 4,617 | — | — | 4,410 | — |
| Derivatives – Hedge accounting | 53 | 2,573 | — | 53 | 2,250 | 15 | 30 | 2,192 | 11 |
The following table sets forth the main valuation techniques, hypothesis and inputs used in the estimation of fair value of the financial instruments classified under Levels 2 and 3, based on the type of financial asset and liability and the corresponding balances as of December 31, 2021, 2020 and 2019.
Fair value of Financial Instruments by levels (Millions of euros)
| 2021 | 2020 | 2019 | |||||||
|---|---|---|---|---|---|---|---|---|---|
| Level 2 | Level 3 | Level 2 | Level 3 | Level 2 | Level 3 | Valuation technique(s) | Observable inputs | Unobservable inputs | |
| ASSETS | |||||||||
| Financial assets held for trading | 87,736 | 3,386 | 71,938 | 1,386 | 69,092 | 1,508 | |||
| Equity instruments | — | 37 | 31 | 60 | — | 59 | Comparable pricing (Observable price in a similar market) Net asset value |
- Brokers quotes - Market operations - NAVs published |
- NAV provided by the administrator of the fund |
| Debt securities | 13,725 | 189 | 11,123 | 57 | 8,178 | 55 | Present-value method (Discounted future cash flows) Observed prices in non active markets |
- Issuer´s credit risk - Current market interest rates - Non active markets prices |
- Prepayment rates - Issuer´s credit risk - Recovery rates |
| Loans and advances | 47,279 | 2,913 | 26,741 | 1,148 | 30,491 | 849 | Present-value method (Discounted future cash flows) |
- Issuer's credit risk - Current market interest rates - Funding interest rates observed in the market or in consensus services - Exchange rates |
- Prepayment rates - Issuer´s credit risk - Recovery rates - Funding interest rates not observed in the market or in consensus services |
| Derivatives | 26,732 | 247 | 34,043 | 121 | 28,593 | 109 | |||
| Interest rate |
Interest rate products (Interest rate Swaps, Call money Swaps and FRA): Discounted cash flows Caps/Floors: Black 76, Hull-White and SABR Bond options: Black 76 Swaptions: Black, Hull-White and LGM Other Interest rate Options: Black 76, Hull-White and LGM Constant Maturity Swaps: SABR |
- Exchange rates - Market quoted future prices - Market interest rates - Underlying assets prices: shares, funds, commodities - Market observable volatilities - Issuer credit spread levels - Quoted dividends - Market listed correlations |
- Beta - Implicit correlations between tenors - Interest rates volatility |
||||||
| Equity |
Future and Equity Forward: Discounted future cash flows
Equity Options: Local volatility, Black 76, Momentum adjustment and Heston |
- Volatility of volatility - Implicit assets correlations - Long term implicit correlations - Implicit dividends and long term repos |
|||||||
| Foreign exchange and gold |
Future and Equity Forward: Discounted future cash flows Foreign exchange Options: Local volatility, moments adjustment |
- Volatility of volatility - Implicit assets correlations - Long term implicit correlations |
|||||||
| Credit | Credit Derivatives: Default model and Gaussian copula |
- Correlation default - Credit spread - Recovery rates - Interest rate yield - Default volatility |
|||||||
| Commodities | Commodities: Momentum adjustment and Discounted cash flows | ||||||||
| Non-trading financial assets mandatorily at fair value through profit or loss | 522 | 1,186 | 381 | 992 | 92 | 1,160 | |||
| Equity instruments | 394 | 751 | 57 | 465 | 1 | 103 | Comparable pricing (Observable price in a similar market) Net asset value |
- Brokers quotes - Market operations - NAVs published |
- NAV provided by the administrator of the fund |
| Debt securities | 128 | — | 324 | 28 | 91 | 19 | Present-value method (Discounted future cash flows) |
- Issuer credit risk - Current market interest rates |
- Prepayment rates - Issuer credit risk - Recovery rates |
| Loans and advances | — | 435 | — | 499 | — | 1,038 |
Specific liquidation criteria regarding losses of the EPA proceedings PD and LGD of the internal models, valuations and specific criteria of the EPA proceedings Discounted future cash flows |
- Prepayment rates - Business plan of the underlying asset, WACC, macro scenario - Property valuation |
|
| Financial assets designated at fair value through profit or loss | 176 | — | 178 | — | — | — |
Present-value method (Discounted future cash flows) |
- Issuer credit risk - Current market interest rates |
|
| Debt securities | 176 | — | 178 | — | — | — | |||
| Financial assets at fair value through other comprehensive income | 7,545 | 719 | 7,866 | 598 | 9,203 | 1,084 | |||
| Equity instruments | 36 | 106 | 34 | 105 | 146 | 480 | Comparable pricing (Observable price in a similar market) Net asset value |
- Brokers quotes - Market operations - NAVs published |
- NAV provided by the administrator of the fund |
| Debt securities | 7,509 | 613 | 7,832 | 493 | 9,057 | 604 | Present-value method (Discounted future cash flows) Observed prices in non active markets |
- Issuer´s credit risk - Current market interest rates - Non active market prices |
- Prepayment rates - Issuer credit risk - Recovery rates |
| Hedging derivatives | 1,733 | 9 | 1,862 | 8 | 1,685 | — | |||
| Interest rate |
Interest rate products (Interest rate swaps, Call money Swaps and FRA): Discounted cash flows
Caps/Floors: Black, Hull-White and SABR Bond options: Black 76 Swaptions: Black 76, Hull-White and LGM Other Interest rate options: Black 76, Hull-White and LGM Constant Maturity Swaps: SABR |
- Exchange rates
- Market quoted future prices - Market interest rates - Underlying assets prices: shares, funds, commodities - Market observable volatilities - Issuer credit spread levels - Quoted dividends - Market listed correlations |
|||||||
| Equity |
Future and Equity Forward: Discounted future cash flows
Equity Options: Local Volatility, Momentum adjustment |
||||||||
| Foreign exchange and gold |
Future and Equity Forward: Discounted future cash flows
Foreign exchange Options: Local Volatility, moments adjustment |
||||||||
| Credit | Credit Derivatives: Default model and Gaussian copula | ||||||||
| Commodities | Commodities: Momentum adjustment and Discounted cash flows | ||||||||
Fair Value of Financial Instruments by Levels (Millions of Euros)
| 2021 | 2020 | 2019 | |||||||
|---|---|---|---|---|---|---|---|---|---|
| Level 2 | Level 3 | Level 2 | Level 3 | Level 2 | Level 3 | Valuation technique(s) | Observable inputs | Unobservable inputs | |
| LIABILITIES | |||||||||
| Financial liabilities held for trading | 64,305 | 615 | 56,127 | 395 | 61,588 | 827 | |||
| Deposits | 37,733 | 226 | 21,577 | 159 | 29,971 | 533 |
Present-value method (Discounted future cash flows) |
- Interest rate yield - Funding interest rates observed in the market or in consensus services - Exchange rates. |
- Funding interest rates not observed in the market or in consensus services. |
| Derivates | 26,560 | 389 | 34,046 | 232 | 29,466 | 175 | |||
| Interest rate |
Interest rate products (Interest rate Swaps, call money Swaps y FRA):: Discounted cash flows Caps/Floors: Black 76, Hull-White and SABR Bond options: Black 76 Swaptions: Black 76, Hull-White and LGM Other Interest rate Options: Black 76, Hull-White and LGM Constant Maturity Swaps: SABR |
- Exchange rates - Market quoted future prices - Market interest rates - Underlying assets prices: shares, funds, commodities - Market observable volatilities - Issuer credit spread levels - Quoted dividends - Market listed correlations |
- Beta - Correlation between tenors - Interest rates volatility |
||||||
| Equity |
Future and Equity Forward: Discounted future cash flows Equity Options: Local volatility, momentum adjustment and Heston |
- Volatility of volatility - Assets correlation |
|||||||
| Foreign exchange and gold |
Future and Equity Forward: Discounted future cash flows Foreign exchange Options: Local volatility, moments adjustment |
- Volatility of volatility - Assets correlation |
|||||||
| Credit | Credit Derivatives: Default model and Gaussian copula |
- Correlation default - Credit spread - Recovery rates - Interest rate yield - Default volatility |
|||||||
| Commodities | Commodities: Momentum adjustment and discounted cash flows | ||||||||
| Short positions | 11 | — | 504 | 3 | 1 | 2 |
Present-value method (Discounted future cash flows) |
- Prepayment rates - Issuer´s credit risk - Current market interest rates |
|
| Financial liabilities designated at fair value through profit or loss | 8,243 | 1,439 | 8,558 | 1,492 | 8,629 | 1,382 |
Present-value method (Discounted future cash flows) |
- Prepayment rates - Issuer´s credit risk - Current market interest rates |
- Prepayment rates - Issuer´s credit risk - Current market interest rates |
| Derivatives – Hedge accounting | 2,573 | — | 2,250 | 15 | 2,192 | 11 | |||
| Interest rate |
Interest rate products (Interest rate Swaps, Call money Swaps and FRA): Discounted cash flows Caps/Floors: Black 76, Hull-White and SABR Bond options: Black 76 Swaptions: Black 76, Hull-White and LGM Other Interest rate Options: Black 76, Hull-White and LGM Constant Maturity Swaps: SABR |
- Exchange rates - Market quoted future prices - Market interest rates - Underlying assets prices: shares, funds, commodities - Market observable volatilities - Issuer credit spread levels - Quoted dividends - Market listed correlations |
- Beta - Implicit correlations between tenors - Interest rates volatility |
||||||
| Equity |
Future and Equity Forward: Discounted future cash flows Equity Options: Local volatility, momentum adjustment and Heston |
- Volatility of volatility - Implicit assets correlations - Long term implicit correlations - Implicit dividends and long term repos |
|||||||
| Foreign exchange and gold |
Future and Equity Forward: Discounted future cash flows Foreign exchange Options: Black 76, Local volatility, momentum adjustment |
- Volatility of volatility - Implicit assets correlations - Long term implicit correlations |
|||||||
| Credit | Credit Derivatives: Default model and Gaussian copula |
- Correlation default - Credit spread - Recovery rates - Interest rate yield - Default volatility |
|||||||
| Commodities | Commodities: Momentum adjustment and discounted cash flows | ||||||||
Main valuation techniques
The main techniques used for the assessment of the majority of the financial instruments classified in Level 3, and its main unobservable inputs, are described below:
- The net present value (net present value method): This technique uses the future cash flows of each financial instrument, which are established in the different contracts, and discounted to their present value. This technique often includes many observable inputs, but may also include unobservable inputs, as described below:
- Credit Spread: This input represents the difference in yield of a debt security and the reference rate, reflecting the additional return that a market participant would require to take the credit risk of that debt security. Therefore, the credit spread of the debt security is part of the discount rate used to calculate the present value of the future cash flows.
- Recovery rate: This input represents the percentage of principal and interest recovered from a debt instrument that has defaulted.
- Comparable prices (similar asset prices): This input represents the prices of comparable financial instruments and benchmarks used to calculate a reference yield based on relative movements from the entry price or current market levels. Further adjustments to account for differences that may exist between financial instrument being valued and the comparable financial instrument may be added. It can also be assumed that the price of the financial instrument is equivalent to the comparable instrument.
- Net asset value: This technique utilizes certain assumptions to use net asset value as representative of fair value, which is equal to the total value of the assets and liabilities of a fund published by the managing entity.
- Gaussian copula: This model is used to integrate default probabilities of credit instruments referenced to more than one underlying CDS. The joint density function used to value the instrument is constructed by using a Gaussian copula that relates the marginal densities by a normal distribution, usually extracted from the correlation matrix of events approaching default by CDS issuers.
- Black 76: variant of Black Scholes model, whose main application is the valuation of bond options, cap floors and swaptions where the behavior of the Forward and not the Spot itself, is directly modeled.
- Black Scholes: The Black Scholes model postulates log-normal distribution for the prices of securities, so that the expected return under the risk neutral measure is the risk free interest rate. Under this assumption, the price of vanilla options can be obtained analytically, so that inverting the Black- Scholes formula, the implied volatility for process of the price can be calculated.
- Heston: This model, typically applied to equity OTC options, assumes stochastic behavior of volatility. According to which, the volatility follows a process that reverts to a long-term level and is correlated with the underlying equity instrument. As opposed to local volatility models, in which the volatility evolves deterministically, the Heston model is more flexible, allowing it to be similar to that observed in the short term today.
- Libor market model: This model assumes that the dynamics of the interest rate curve can be modeled based on the set of forward contracts that compose the underlying interest rate. The correlation matrix is parameterized on the assumption that the correlation between any two forward contracts decreases at a constant rate, beta, to the extent of the difference in their respective due dates. The input “Credit default volatility” is a volatility input of the credit factor dynamic applied in rate/credit hybrid operative. The multifactorial frame of this model makes it ideal for the valuation of instruments sensitive to the slope or curve, including interest rate option.
- Local Volatility: In the local volatility models, the volatility, instead of being static, evolves deterministically over time according to the level of moneyness (i.e. probability that the option has a positive value on its date of expiration) of the underlying, capturing the existence of volatility smiles. The volatility smile of an option is the empirical relationship observed between its implied volatility and its strike price. These models are appropriate for options whose value depends on the historical evolution of the underlying which use Monte Carlo simulation technique for their valuation.
Unobservable inputs
Quantitative information of unobservable inputs used to calculate Level 3 valuations is presented below as of December 31, 2021, 2020 and 2019:
Unobservable inputs. December 2021
| Financial instrument | Valuation technique(s) | Significant unobservable inputs | Min | Average | Máx | Units |
|---|---|---|---|---|---|---|
| Debt Securities | Present value method | Credit Spread | 2.72 | 125.41 | 2,374.39 | bp |
| Recovery Rate | 0.00% | 37.34% | 40.00% | % | ||
| 0.10% | 96.63% | 144.11% | % | |||
| Equity/Fund instruments (*) | Net Asset Value | |||||
| Comparable Pricing | ||||||
| Loans and advances | Present value method | Repo funding curve | (2.71)% | 1.16% | 4.99% | Abs Repo rate |
| Credit Derivatives | Gaussian Copula | Correlation Default | 34.56% | 43.47% | 52.78% | % |
| Black 76 | Price Volatility | — | Vegas | |||
| Equity Derivatives | Option models on equities, baskets of equity, funds | Dividends (**) | ||||
| Correlations | (88)% | 60% | 99% | % | ||
| Volatility | 5.57 | 26.30 | 62.00 | Vegas | ||
| FX Derivatives | Option models on FX underlyings | Volatility | 3.96 | 9.71 | 16.34 | Vegas |
| IR Derivatives | Option models on IR underlyings | Beta | 0.25 | 2.00 | 18.00 | % |
| Correlation Rate/Credit | (100) | 100 | % | |||
| Credit Default Volatility | — | — | — | Vegas |
- (*) Due to the diversity of valuation models of equity valuations, we would not include all the unobservable inputs or the quantitative ranges of them.
- (**) The range of unobservable dividends is too wide range to be relevant.
Unobservable inputs. December 2020
| Financial instrument | Valuation technique(s) | Significant unobservable inputs | Min | Average | Máx | Units |
|---|---|---|---|---|---|---|
| Debt Securities | Present value method | Credit Spread | 4.32 | 47.01 | 564.22 | bp |
| Recovery Rate | 0.00% | 37.06% | 40.00% | % | ||
| 0.10% | 99.92% | 143.87% | % | |||
| Equity/Fund instruments (*) | Net Asset Value | |||||
| Comparable Pricing | ||||||
| Loans and advances | Present value method | Repo funding curve | (1.18%) | (0.25%) | 0.74% | Abs Repo rate |
| Credit Derivatives | Gaussian Copula | Correlation Default | 30.40% | 44.87% | 60.95% | % |
| Black 76 | Price Volatility | — | Vegas | |||
| Equity Derivatives | Option models on equities, baskets of equity, funds | Dividends (**) | ||||
| Correlations | (77%) | 51% | 98% | % | ||
| Volatility | 6.52 | 29.90 | 141.77 | Vegas | ||
| FX Derivatives | Option models on FX underlyings | Volatility | 4.11 | 10.00 | 16.14 | Vegas |
| IR Derivatives | Option models on IR underlyings | Beta | 0.25 | 2.00 | 18.00 | % |
| Correlation Rate/Credit | (100) | 100 | % | |||
| Credit Default Volatility | — | — | — | Vegas |
- (*) Due to the diversity of valuation models of equity valuations, we would not include all the unobservable inputs or the quantitative ranges of them.
- (**) The range of unobservable dividends is too wide range to be relevant.
Unobservable inputs. December 2019
| Financial instrument | Valuation technique(s) | Significant unobservable inputs | Min | Average | Max | Units | |
|---|---|---|---|---|---|---|---|
| Loans and advances | Present value method | Repo funding curve | (6) | 16 | 100 | bp | |
| Debt securities | Comparable pricing | Credit spread | 18 | 83 | 504 | bp | |
| Recovery rate | 0.00% | 28.38% | 40.00% | % | |||
| 0.01% | 98.31% | 135.94% | % | ||||
| Equity instruments (*) | Net asset value | ||||||
| Comparable pricing | |||||||
| Credit option | Gaussian Copula | Correlation default | 19.37% | 44.33% | 61.08% | % | |
| Corporate Bond option | Black 76 | Price volatility | — | — | — | Vegas | |
| Equity OTC option | Heston | Forward Volatility Skew | 35.12 | 35.12 | 35.12 | Vegas | |
| Local Volatility | Dividends (**) | ||||||
| Volatility | 2.49 | 23.21 | 60.90 | Vegas | |||
| FX OTC options | Black Scholes / Local Vol | Volatility | 3.70 | 6.30 | 10.05 | Vegas | |
| Interest rate options | Libor Market Model | Beta | 0.25 | 2.00 | 18.00 | % | |
| Correlation rate/Credit | (100) | 100 | % | ||||
| Credit default Volatility | — | — | — | Vegas | |||
- (*) Due to the diversity of valuation models of equity valuations, we would not include all the unobservable inputs or the quantitative ranges of them.
- (**) The range of non-observable dividends has too wide range to be relevant.
Adjustments to the valuation
Under IFRS 13, the entity must estimate the value taking into account the assumptions and conditions that market participants would have when setting the price of the asset or liability on the valuation date.
In order to comply with the fair value requirements, the entity applies adjustments to the fair valuation considering, default criteria, inherent and from the counterparties, valuation risk from funding and valuation risks due to valuation uncertainty and related to the prudent valuation criteria. All of the above are aligned with the regulatory requirements (EBA CRR 105.10) and considering model risk, liquidity risk (Bid / Offer) and price uncertainty risk.
Adjustments to the valuation for risk of default
The fair value of liabilities should reflect the entity's default risk, which includes, among other components, its own credit risk. Taking this into account, the Group makes valuation adjustments for credit risk in the estimates of the fair value of its assets and liabilities.
These adjustments are calculated by estimating Exposure At Default, Probability of Default and Loss Given Default, which are based on the recovery levels for all derivative products on any instrument, deposits and repos at the legal entity level (all counterparties under a same master agreement), in which BBVA has exposure.
Credit Valuation Adjustment (hereinafter “CVA”) and Debit Valuation Adjustments (hereinafter “DVA”) are included in the valuation of derivatives, both assets and liabilities, to reflect the impact on the fair value of the counterparty credit risk and its own, respectively. The Group incorporates in its valuation, for all exposures classified in any of the categories valued at fair value, both the counterparty credit risk and its own. In the trading portfolio, and in the specific case of derivatives, credit risk is recognized through such adjustments.
As a general rule, the calculation of CVA is the sum of the expected positive exposure in time t, the probability of default between t-1 and t, and the Loss Given Default of the counterparty. Consequently, the DVA is calculated as the sum of the expected negative exposure in time t, the probability of default of BBVA between t-1 and t, and the Loss Given Default of BBVA. Both calculations are performed throughout the entire period of potential exposure.
The calculation of the expected positive and negative exposure is done through a Montecarlo simulation of the market variables involved in all trades’ valuation under the same legal netting set.
The information needed to calculate the probability of default and the loss given default of a counterparty comes from the credit markets. The counterparty’s Credit Default Swaps are used if liquid quotes are available. If a market price is not available, BBVA has implemented a mapping process based on the sector, rating and geography of the counterparty to assign probabilities of default and loss given default calibrated directly to market.
An additional adjustment for Own Credit Adjustment (OCA) is applied to the instruments accounted for by applying the Fair Value Option permitted by IFRS 9.
The amounts recognized in the consolidated balance sheet as of December 31, 2021, 2020 and 2019 related to the valuation adjustments to the credit assessment of the derivative asset as Credit Valuation Adjustments (CVA) were €-121 million, €-142 million and €-106 million respectively, and the valuation adjustments to the derivative liabilities as Debit Valuation Adjustment (DVA) were €104 million, €124 million and €117 million, respectively. The impact recorded under “Gains (losses) on financial assets and liabilities held for trading, net” in the consolidated income statement for the year ended December 31, 2021, 2020 and 2019 corresponding to the mentioned adjustments was a net impact of €0 million, €-29 million and €67 million respectively.
Valuation adjustments for financing risk
The fair value of the positions recorded at fair value must reflect the entity's financing risk. Taking into account the above, the Group makes adjustments for financing risk valuation (Funding Valuation Adjustment FVA) in the estimates of the fair value of its assets and liabilities.
The adjustment to the valuation for financing risk incorporates the cost of financing implicit in the valuation of positions at fair value. This adjustment reflects the cost of funding for non-collateralized or partially collateralized operations.
Additionally, as of December 31, 2021, 2020 and 2019, €-11 million, €-9 million and €-8 million related to the “Funding Valuation Adjustments” (“FVA”) were recognized in the consolidated balance sheet, being the impact on results €-1 million, €-1 million and €4 million, respectively.
Valuation adjustments for valuation uncertainty
The fair value of the positions recorded at fair value must reflect the valuation risk derived from the uncertainty in the valuation for concepts of pure uncertainty of prices, liquidity risk and model risks. This adjustment is aligned with the regulatory requirements for prudent valuation via valuation adjustments with an impact on CET1, and meets the requirements of EBA CRR 105.10 for this purpose.
The adjustment to the valuation for liquidity incorporates an adjustment for Bid / Offer spreads in the valuation of derivatives that do not meet the necessary conditions to be considered a Market Maker operation.
The adjustment to the valuation for model risk captures the uncertainty in the price associated with the products valued with the use of a valuation model ("Mark to Model") given the existence of more than one possible model applicable to the valuation of the product or the calibration of its parameters from the observations of inputs in the market.
The adjustment to the valuation for price uncertainty includes the uncertainty associated with the dispersion in the values observed in the market for the prices taken in the valuation of assets or as inputs in the valuation models. The impact recorded under “Gains (losses) on financial assets and liabilities held for trading, net” in the consolidated income statement for the year ended December 31, 2021 corresponding to the mentioned adjustments was a net impact of €-30 million.
Financial assets and liabilities classified as Level 3
The changes in the balance of Level 3 financial assets and liabilities included in the accompanying consolidated balance sheets are as follows:
Financial assets Level 3: Changes in the year (Millions of Euros)
| 2021 | 2020 | 2019 | ||||
|---|---|---|---|---|---|---|
| Assets | Liabilities | Assets | Liabilities | Assets | Liabilities | |
| Balance at the beginning | 2,984 | 1,902 | 3,316 | 2,103 | 3,527 | 4,115 |
| Changes in fair value recognized in profit and loss (*) | 338 | 143 | 611 | 296 | 112 | 71 |
| Changes in fair value not recognized in profit and loss | (47) | (10) | (89) | (4) | 2 | — |
| Acquisitions, disposals and liquidations (**) | 2,531 | 156 | (725) | (652) | (432) | 479 |
| Net transfers to Level 3 | (436) | (80) | 549 | 199 | 76 | (2,751) |
| Exchange differences and others | (69) | (56) | (160) | (35) | 31 | 189 |
| Discontinued operations (***) | — | — | (518) | (5) | — | — |
| Balance at the end | 5,301 | 2,054 | 2,984 | 1,902 | 3,316 | 2,103 |
- (*) Profit or loss that is attributable to gains or losses relating to those financial assets and liabilities held as of December 31, 2021, 2020 and 2019. Valuation adjustments are recorded under the heading “Gains (losses) on financial assets and liabilities (net)”.
- (**) Of which, in 2021, the assets roll forward is comprised of €2,742 million of acquisitions and €211 million of disposals. The liabilities roll forward is comprised of €213 million of acquisitions and €57 million of sales.
- (***) The balance of 2020 corresponds mainly to the companies in the United States included in the USA Sale (see Notes 1.3, 3 and 21).
In 2021 there was an increase in the trading portfolio mainly due to the evolution of loans and advances and their corresponding funding with deposits. In line with this increase in the activity, there is a higher volume of exposures classified as level 3 which mainly corresponds to temporary acquisitions of assets, despite having improved throughout the year the observability of the inputs used to value these assets in the market.
In 2020, a reduction was made in financial assets held for trading and financial liabilities held for trading classified as Level 2 in the fair value hierarchy for an amount of €1,918 million and a reduction in financial assets held for trading and Financial liabilities held for trading classified as Level 3 in the fair value hierarchy for an amount of €461 million euros (see Note 1.3).
In 2019, certain interest rate yields were adapted to those observable in the market, which mainly affected the valuation of certain deposit classes recorded under “Financial liabilities at amortized cost” and certain insurance products recorded under “Financial liabilities designated at fair value through profit or loss - Other financial liabilities”, and, as a result thereof, their classification changed from Level 3 to Level 2. Additionally, €1,285 million in assets held for trading and €649 million in liabilities held for trading were classified in Level 3, mainly due to certain reverse repurchase and repurchase agreements, due to the non-observability and liquidity in the interest rate yield for the financing of assets applied in the calculation of their fair value.
For the years ended December 31, 2021, 2020 and 2019, the profit/loss on sales of financial instruments classified as Level 3 recognized in the accompanying consolidated income statement was not material.
Transfers between levels
The Global Valuation Area, in collaboration with the Group, has established the rules for an appropriate financial instruments held for trading classification according to the fair value hierarchy defined by IFRS.
On a monthly basis, any new assets added to the portfolio are classified, according to this criterion, by the subsidiaries. Then, there is a quarterly review of the portfolio in order to analyze the need for a change in classification of any of these assets.
The financial instruments transferred among the different levels of measurement for the years ended December 31, 2021, 2020 and 2019 are at the following amounts in the accompanying consolidated balance sheets as of December 31, 2021, 2020 and 2019:
Transfers among levels. December 2021 (Millions of Euros)
| From: | Level 1 | Level 2 | Level 3 | ||||
|---|---|---|---|---|---|---|---|
| To: | Level 2 | Level 3 | Level 1 | Level 3 | Level 1 | Level 2 | |
| ASSETS | |||||||
| Financial assets held for trading | 924 | 2 | 35 | 184 | 10 | 637 | |
| Non-trading financial assets mandatorily at fair value through profit or loss | 8 | — | — | — | 14 | 23 | |
| Financial assets designated at fair value through profit or loss | — | — | — | — | — | — | |
| Financial assets at fair value through other comprehensive income | 596 | 17 | 506 | 50 | — | 6 | |
| Derivatives – Hedge accounting | — | — | — | — | — | — | |
| Total | 1,528 | 19 | 542 | 234 | 24 | 665 | |
| LIABILITIES | |||||||
| Financial liabilities held for trading | 562 | — | 24 | 57 | 15 | 95 | |
| Financial liabilities designated at fair value through profit or loss | — | — | — | 38 | — | 65 | |
| Derivatives – Hedge accounting | — | — | — | — | — | — | |
| Total | 562 | — | 24 | 95 | 15 | 160 | |
Transfer among levels (Millions of Euros)
| 2020 | 2019 | ||||||||||||
|---|---|---|---|---|---|---|---|---|---|---|---|---|---|
| From: | Level 1 | Level 2 | Level 3 | Level 1 | Level 2 | Level 3 | |||||||
| To: | Level 2 | Level 3 | Level 1 | Level 3 | Level 1 | Level 2 | Level 2 | Level 3 | Level 1 | Level 3 | Level 1 | Level 2 | |
| ASSETS | |||||||||||||
| Financial assets held for trading | 1,460 | 11 | 203 | 548 | 4 | 98 | 74 | — | 1,119 | 502 | 1 | 160 | |
| Non-trading financial assets mandatorily at fair value through profit or loss | 9 | 11 | 4 | — | — | 17 | — | — | 23 | 2 | — | 44 | |
| Financial assets designated at fair value through profit or loss | 143 | — | — | — | — | — | — | — | — | — | 1 | — | |
| Financial assets at fair value through other comprehensive income | 484 | — | 135 | 96 | — | 6 | 6 | 6 | 4 | 209 | — | 454 | |
| Derivatives – Hedge accounting | — | — | — | 8 | — | — | — | — | — | 26 | — | 10 | |
| Total | 2,096 | 22 | 342 | 652 | 4 | 121 | 79 | 6 | 1,145 | 739 | 2 | 667 | |
| LIABILITIES | |||||||||||||
| Financial liabilities held for trading | 8 | 3 | — | 180 | — | 13 | 1 | — | — | — | — | — | |
| Financial liabilities designated at fair value through profit or loss | — | — | — | 56 | — | 27 | — | — | — | 27 | — | 2,679 | |
| Derivatives – Hedge accounting | — | — | — | — | — | — | — | — | — | 27 | — | 125 | |
| Total | 8 | 3 | — | 236 | — | 40 | 1 | — | — | 54 | — | 2,804 | |
The amount of financial instruments that were transferred among levels of valuation during the year ended December 31, 2021 is not material relative to the total portfolios, and corresponds to the above changes in the classification among levels these financial instruments modified some of their features, specifically:
- Transfers among Levels 1 and 2 represent mainly derivatives, debt securities and short positions, which are either no longer listed on an active market (transfer from Level 1 to 2) or have just started to be listed (transfer from Level 2 to 1).
- Transfers from Level 2 to Level 3 are mainly due to transactions of financial assets held for trading, financial assets at fair value through other comprehensive income, financial liabilities held for trading and financial liabilities designated at fair value through profit or loss.
- Transfers from Level 3 to Level 2 generally affect derivatives, loans and advances and debt securities transactions, for which inputs observable in the market have been obtained.
Sensitivity analysis
Sensitivity analysis is performed on financial instruments with significant unobservable inputs (financial instruments included in level 3), in order to obtain a reasonable range of possible alternative valuations. This analysis is carried out on a monthly basis, based on the criteria defined by the Global Valuation Area taking into account the nature of the methods used for the assessment and the reliability and availability of inputs and proxies used. In order to establish, with a sufficient degree of certainty, the valuation risk that is incurred in such assets without applying diversification criteria between them.
As of December 31, 2021, the effect on profit for the year and total equity of changing the main unobservable inputs used for the measurement of Level 3 financial instruments for other reasonably possible unobservable inputs, taking the highest (most favorable input) or lowest (least favorable input) value of the range deemed probable, would be as follows:
Financial instruments Level 3: Sensitivity analysis (Millions of Euros)
| Potential impact on consolidated income statement | Potential impact on other comprehensive income | |||
|---|---|---|---|---|
| Most favorable hypothesis | Least favorable hypothesis | Most favorable hypothesis | Least favorable hypothesis | |
| ASSETS | ||||
| Financial assets held for trading | 33 | (57) | — | — |
| Loans and Advances | 4 | (4) | — | — |
| Debt securities | 24 | (24) | — | — |
| Equity instruments | 1 | (25) | — | — |
| Derivatives | 5 | (5) | — | — |
| Non-trading financial assets mandatorily at fair value through profit or loss | 35 | (36) | — | — |
| Loans and advances | 16 | (5) | — | — |
| Debt securities | 10 | (10) | — | — |
| Equity instruments | 9 | (21) | — | — |
| Financial assets designated at fair value through profit or loss | — | — | — | — |
| Financial assets at fair value through other comprehensive income | — | — | 41 | (43) |
| Total | 68 | (93) | 41 | (43) |
| LIABILITIES | ||||
| Financial liabilities held for trading | 3 | (3) | — | — |
| Total | 3 | (3) | — | — |
8.2 Fair value of financial instruments carried at cost, by valuation criteria
The valuation technique used to calculate the fair value of financial assets and liabilities carried at cost are presented below:
Financial assets
- Cash, balances at central banks and other demand deposits / loans to central banks / short-term loans to credit institutions/ Repurchase agreements: in general, their fair value is assimilated to their book value, due to the nature of the counterparty and because they are mainly short-term balances in which the book value is the most reasonable estimation of the value of the asset.
- Loans to credit institutions which are not short-term and loans to customers: In general, the fair value of these financial assets is determined by the discount of expected future cash flows, using market interest rates at the time of valuation adjusted by the credit spread and taking all kind of behavior hypothesis if it is considered to be relevant (prepayment fees, optionality, etc.).
- Debt securities: Fair value estimated based on the available market price or by using internal valuation methodologies.
Financial liabilities
- Deposits from central banks: for recurrent liquidity auctions and other monetary policy instruments of central banks / short-term deposits, from credit institutions / repurchase agreements / short term customer deposits: their book value is considered to be the best estimation of their fair value.
- Deposits of credit institutions which are not short-term and term customer deposits: these deposits will be valued by discounting future cash flows using the interest rate curve in effect at the time of the adjustment adjusted by the credit spread and incorporating any behavioral assumptions if this proves relevant (early repayments, optionalities, etc.).
- Debt certificate (Issuances): The fair value estimation of these liabilities depend on the availability of market prices or by using the present value method: discount of future cash flows, using market interest rates at valuation time and taking into account the credit spread.
The following table presents the fair value of key financial instruments carried at amortized cost in the accompanying consolidated balance sheets as of December 31, 2021, 2020 and 2019, broken down according to the method of valuation used for the estimation:
Fair value of financial instruments at amortized cost by Levels (Millions of Euros)
| 2021 | 2020 | 2019 | |||||||
|---|---|---|---|---|---|---|---|---|---|
| Level 1 | Level 2 | Level 3 | Level 1 | Level 2 | Level 3 | Level 1 | Level 2 | Level 3 | |
| ASSETS | |||||||||
| Cash, cash balances at central banks and other demand deposits | 67,581 | — | 218 | 65,355 | — | 165 | 44,111 | — | 192 |
| Financial assets at amortized cost | 33,213 | 13,033 | 331,205 | 35,196 | 15,066 | 324,005 | 29,391 | 217,279 | 196,119 |
| LIABILITIES | |||||||||
| Financial liabilities at amortized cost | 91,870 | 243,847 | 153,016 | 90,839 | 255,278 | 144,889 | 67,229 | 289,599 | 159,082 |
The main valuation techniques and inputs used to estimate the fair value of financial instruments accounted for at cost and classified in levels 2 and 3 is shown below. These are broken down by type of financial instrument and the balances correspond to those as of December 31, 2021, 2020 and 2019:
Fair Value of financial Instruments at amortized cost by valuation technique (Millions of Euros)
| 2021 | 2020 | 2019 | ||||||
|---|---|---|---|---|---|---|---|---|
| Level 2 | Level 3 | Level 2 | Level 3 | Level 2 | Level 3 | Valuation technique(s) | Main inputs used | |
| ASSETS | ||||||||
| Financial assets at amortized cost | 13,033 | 331,205 | 15,066 | 324,005 | 217,279 | 196,119 |
Present-value method (Discounted future cash flows) |
|
| Loans and advances to central banks | — | — | — | — | — | 2 |
- Credit spread - Prepayment rates - Interest rate yield |
|
| Loans and advances to credit institutions | 863 | 12,329 | 1,883 | 12,641 | 9,049 | 4,628 |
- Credit spread - Prepayment rates - Interest rate yield |
|
| Loans and advances to customers | 3,416 | 318,059 | 3,904 | 310,924 | 194,897 | 190,144 |
- Credit spread - Prepayment rates - Interest rate yield |
|
| Debt securities | 8,755 | 817 | 9,279 | 440 | 13,333 | 1,345 |
- Credit spread - Interest rate yield |
|
| LIABILITIES | ||||||||
| Financial liabilities at amortized cost | 243,847 | 153,016 | 255,278 | 144,889 | 289,599 | 159,082 | ||
| Deposits from central banks | — | 300 | — | 207 | 129 | — |
Present-value method (Discounted future cash flows) |
- Issuer´s credit risk - Prepayment rates - Interest rate yield |
| Deposits from credit institutions | 14,853 | 4,916 | 22,914 | 4,633 | 21,575 | 6,831 | ||
| Deposits from customers | 209,345 | 137,803 | 210,097 | 129,525 | 245,720 | 135,514 | ||
| Debt certificates | 10,014 | 4,391 | 14,413 | 4,848 | 14,194 | 11,133 | ||
| Other financial liabilities | 9,636 | 5,606 | 7,854 | 5,676 | 7,981 | 5,604 | ||
In 2020, the level of significance of the unobservable inputs used to determine the fair value hierarchy of loans and advances to customers at amortized cost was refined, resulting in a greater exposure classified as Level 3. This revision was carried out in the context of the availability of new information which was more adjusted to the changes that have occurred both in market conditions and in the composition of credit investment. The effect on consolidated results and equity resulting from this review did not represent any change.
9. Cash, cash balances at central banks and other demand deposits
The breakdown of the balance under the heading “Cash, cash balances at central banks and other demand deposits” in the accompanying consolidated balance sheets is as follows:
Cash, cash balances at central banks and other demand deposits (Millions of Euros)
| Notes | 2021 | 2020 | 2019 | |
|---|---|---|---|---|
| Cash on hand | 6,877 | 6,447 | 7,060 | |
| Cash balances at central banks (*) | 55,004 | 53,079 | 31,756 | |
| Other demand deposits | 5,918 | 5,994 | 5,488 | |
| Total | 8.1 | 67,799 | 65,520 | 44,303 |
(*) The variation in 2020 with respect to 2019 is mainly due to an increase in balances of BBVA, S.A. at the Bank of Spain.
10. Financial assets and liabilities held for trading
10.1 Breakdown of the balance
The breakdown of the balance under these headings in the accompanying consolidated balance sheets is as follows:
Financial assets and liabilities held for trading (Millions of Euros)
| Notes | 2021 | 2020 | 2019 | |
|---|---|---|---|---|
| ASSETS | ||||
| Derivatives (*) | 30,933 | 40,183 | 32,232 | |
| Equity instruments | 7.2.2 | 15,963 | 11,458 | 8,892 |
| Credit institutions | 816 | 633 | 1,037 | |
| Other sectors | 15,147 | 10,824 | 7,855 | |
| Debt securities | 7.2.2 | 25,790 | 23,970 | 26,309 |
| Issued by central banks | 936 | 1,011 | 840 | |
| Issued by public administrations | 21,946 | 19,942 | 23,918 | |
| Issued by financial institutions | 1,130 | 1,479 | 679 | |
| Other debt securities | 1,778 | 1,538 | 872 | |
| Loans and advances (**) | 7.2.2 | 50,807 | 30,268 | 32,037 |
| Loans and advances to central banks | 3,467 | 53 | 535 | |
| Reverse repurchase agreement | 3,467 | 53 | 535 | |
| Loans and advances to credit institutions | 31,916 | 18,317 | 19,020 | |
| Reverse repurchase agreement | 31,901 | 18,310 | 18,953 | |
| Loans and advances to customers | 15,424 | 11,898 | 12,482 | |
| Reverse repurchase agreement | 14,916 | 11,295 | 12,187 | |
| Total assets | 8.1 | 123,493 | 105,878 | 99,469 |
| LIABILITIES | ||||
| Derivatives (*) | 31,705 | 41,680 | 34,066 | |
| Short positions | 15,135 | 12,312 | 12,249 | |
| Deposits (**) | 44,294 | 30,117 | 40,099 | |
| Deposits from central banks | 11,248 | 6,277 | 7,635 | |
| Repurchase agreement | 11,248 | 6,277 | 7,635 | |
| Deposits from credit institutions | 16,176 | 14,377 | 22,704 | |
| Repurchase agreement | 15,632 | 14,035 | 22,313 | |
| Customer deposits | 16,870 | 9,463 | 9,761 | |
| Repurchase agreement | 16,824 | 9,418 | 9,689 | |
| Total liabilities | 8.1 | 91,135 | 84,109 | 86,414 |
(*) The variation in 2021 is mainly due to the evolution of interest rate derivatives at BBVA, S.A.
(**) The variation in 2021 corresponds mainly to the evolution of "Reverse repurchase agreement" of BBVA S.A., partially offset by the evolution of "Repurchase agreement". The information for 2020 and 2019 has been subject to certain non-significant modifications in order to improve comparability with the figures for financial year 2021 (see Note 1.3).
As of December 31, 2021, 2020 and 2019 “Short positions” include €14,298, €11,696 and €11,649 million, respectively, held with general governments.
10.2 Derivatives
The derivatives portfolio arises from the Group’s need to manage the risks it is exposed to in the normal course of business and also to market products amongst the Group’s customers. As of December 31, 2021, 2020 and 2019, trading derivatives were mainly contracted in over-the-counter (OTC) markets, with counterparties, consisting primarily of foreign credit institutions and other financial corporations, and are related to foreign-exchange, interest-rate and equity risk.
Below is a breakdown of the net positions by transaction type of the fair value and notional amounts of derivatives recognized in the accompanying consolidated balance sheets, divided into organized and OTC markets:
Derivatives by type of risk and by product or by type of market (Millions of Euros)
| 2020 | 2019 | 2018 | |||||||
|---|---|---|---|---|---|---|---|---|---|
| Assets | Liabilities | Notional amount - Total | Assets | Liabilities | Notional amount - Total | Assets | Liabilities | Notional amount - Total | |
| Interest rate | 15,782 | 15,615 | 3,902,760 | 26,451 | 26,028 | 3,252,066 | 21,004 | 20,378 | 3,024,794 |
| OTC | 15,774 | 15,610 | 3,884,561 | 26,447 | 26,020 | 3,233,718 | 21,004 | 20,377 | 2,997,443 |
| Organized market | 8 | 5 | 18,199 | 3 | 8 | 18,348 | — | 1 | 27,351 |
| Equity instruments | 2,802 | 4,123 | 72,656 | 2,626 | 4,143 | 72,176 | 2,263 | 3,499 | 84,140 |
| OTC | 775 | 1,930 | 48,695 | 584 | 1,836 | 42,351 | 353 | 1,435 | 40,507 |
| Organized market | 2,028 | 2,192 | 23,962 | 2,042 | 2,307 | 29,825 | 1,910 | 2,065 | 43,633 |
| Foreign exchange and gold | 12,104 | 11,471 | 533,395 | 10,952 | 11,216 | 461,898 | 8,608 | 9,788 | 472,194 |
| OTC | 12,090 | 11,445 | 526,590 | 10,942 | 11,216 | 457,180 | 8,571 | 9,782 | 463,662 |
| Organized market | 14 | 26 | 6,805 | 10 | — | 4,719 | 37 | 6 | 8,532 |
| Credit | 236 | 490 | 19,937 | 153 | 292 | 23,411 | 353 | 397 | 29,077 |
| Credit default swap | 236 | 254 | 18,121 | 146 | 156 | 21,529 | 338 | 283 | 26,702 |
| Credit spread option | — | — | — | — | — | — | — | 2 | 150 |
| Total return swap | — | 236 | 1,815 | 7 | 136 | 1,882 | 14 | 113 | 2,225 |
| Other | — | — | — | — | — | — | — | — | — |
| Commodities | 8 | 7 | 149 | 1 | 1 | 26 | 4 | 4 | 64 |
| DERIVATIVES | 30,933 | 31,705 | 4,528,897 | 40,183 | 41,680 | 3,809,577 | 32,232 | 34,066 | 3,610,269 |
| Of which: OTC - credit institutions | 21,069 | 22,488 | 1,073,921 | 24,432 | 27,244 | 958,017 | 19,962 | 22,973 | 1,000,243 |
| Of which: OTC - other financial corporations | 3,300 | 3,075 | 3,257,382 | 8,211 | 8,493 | 2,663,978 | 6,028 | 6,089 | 2,370,988 |
| Of which: OTC - other | 4,514 | 3,919 | 148,629 | 5,484 | 3,627 | 134,690 | 4,294 | 2,932 | 159,521 |
11. Non-trading financial assets mandatorily at fair value through profit or loss
The breakdown of the balance under this heading in the accompanying consolidated balance sheets is as follows:
Non-trading financial assets mandatorily at fair value through profit or loss (Millions of Euros)
(*) The variation in 2021 is mainly due to increased exposure to investment funds in Mexican insurance companies, as a result of increases in the volume of products and the evolution of investment activity in fintech companies.
12. Financial assets and liabilities designated at fair value through profit or loss
The breakdown of the balance under these headings in the accompanying consolidated balance sheets is as follows:
Financial assets and liabilities designated at fair value through profit or loss (Millions of Euros)
Within “Financial liabilities designated at fair value through profit or loss”, liabilities linked to insurance products where the policyholder bears the risk (unit-link) are recorded. Since the liabilities linked to insurance products in which the policyholder assumes the risk are valued the same way as the assets associated to these insurance products, there is no credit risk component borne by the Group in relation to these liabilities.
In addition, the assets and liabilities are included in these headings to reduce inconsistencies (asymmetries) in the valuation of those operations and those used to manage their risk.
13. Financial assets at fair value through other comprehensive income
13.1 Breakdown of the balance
The breakdown of the balance by the main financial instruments in the accompanying consolidated balance sheets is as follows:
Financial assets at fair value through other comprehensive income (Millions of Euros)
- (*) The variation, in the last 3 years, corresponds mainly to changes in the portfolio of financial assets issued by governments in BBVA, S.A.
During financial years 2021, 2020 and 2019, there have been no significant reclassifications from the heading “Financial assets at fair value through other comprehensive income” to other headings or from other headings to “Financial assets at fair value through other comprehensive income”.
13.2 Equity instruments
The breakdown of the balance under the heading "Equity instruments" of the accompanying consolidated financial statements as of December 31, 2021, 2020 and 2019 is as follows:
Financial assets at fair value through other comprehensive income. Equity instruments. (Millions of Euros)
| 2021 | 2020 | 2019 | ||||||||||
|---|---|---|---|---|---|---|---|---|---|---|---|---|
| Cost | Unrealized gains | Unrealized losses | Fair value | Cost | Unrealized gains | Unrealized losses | Fair value | Cost | Unrealized gains | Unrealized losses | Fair value | |
| Equity instruments | ||||||||||||
| Spanish companies shares | 2,235 | — | (1,146) | 1,088 | 2,182 | — | (1,309) | 873 | 2,181 | — | (507) | 1,674 |
| Foreign companies shares | 98 | 35 | (8) | 125 | 100 | 38 | (17) | 121 | 136 | 87 | (11) | 213 |
| The United States | 29 | — | — | 29 | 27 | — | — | 27 | 30 | 47 | — | 78 |
| Mexico | 1 | 28 | — | 29 | 1 | 33 | — | 34 | 1 | 33 | — | 34 |
| Turkey | — | 4 | — | 5 | 2 | 4 | — | 6 | 3 | 2 | — | 5 |
| Other countries | 69 | 2 | (8) | 63 | 70 | 1 | (17) | 54 | 102 | 5 | (11) | 96 |
| Subtotal listed equity instruments | 2,333 | 35 | (1,154) | 1,214 | 2,282 | 38 | (1,326) | 995 | 2,317 | 87 | (518) | 1,886 |
| Unlisted equity instruments | ||||||||||||
| Spanish companies shares | 5 | 7 | — | 11 | 5 | 1 | — | 5 | 5 | 1 | — | 5 |
| Foreign companies shares | 55 | 41 | (1) | 95 | 58 | 43 | (1) | 100 | 450 | 79 | (1) | 528 |
| The United States | — | — | — | — | — | — | — | — | 387 | 32 | — | 419 |
| Mexico | — | — | — | 1 | — | — | — | 1 | — | — | — | — |
| Turkey | 3 | — | — | 3 | 5 | — | — | 5 | 5 | 4 | — | 9 |
| Other countries | 51 | 41 | (1) | 91 | 52 | 43 | (1) | 94 | 57 | 43 | (1) | 99 |
| Subtotal unlisted equity instruments | 60 | 48 | (1) | 107 | 62 | 44 | (1) | 105 | 454 | 80 | (1) | 533 |
| Total | 2,393 | 83 | (1,155) | 1,320 | 2,344 | 82 | (1,327) | 1,100 | 2,772 | 167 | (519) | 2,420 |
13.3 Debt securities
The breakdown of the balance under the heading “Debt securities” of the accompanying consolidated financial statements as of December 31, 2021, 2020 and 2019, broken down by issuers, is as follows:
Financial assets at fair value through other comprehensive income. Debt securities (Millions of Euros)
| 2021 | 2020 | 2019 | |||||||||||
|---|---|---|---|---|---|---|---|---|---|---|---|---|---|
| Amortized cost | Unrealized gains | Unrealized losses | Fair value | Amortized cost | Unrealized gains | Unrealized losses | Fair value | Amortized cost | Unrealized gains | Unrealized losses | Fair value | ||
| Domestic debt securities | |||||||||||||
| Government and other government agency debt securities | 15,889 | 656 | — | 16,544 | 28,582 | 801 | (16) | 29,367 | 20,740 | 830 | (20) | 21,550 | |
| Central banks | — | — | — | — | — | — | — | — | — | — | — | — | |
| Credit institutions | 1,125 | 51 | — | 1,176 | 1,363 | 76 | — | 1,439 | 959 | 65 | — | 1,024 | |
| Other issuers | 612 | 24 | (1) | 635 | 867 | 40 | (1) | 906 | 907 | 40 | — | 947 | |
| Subtotal | 17,625 | 731 | (2) | 18,355 | 30,811 | 917 | (17) | 31,712 | 22,607 | 935 | (21) | 23,521 | |
| Foreign debt securities | |||||||||||||
| Mexico | 11,097 | 32 | (359) | 10,769 | 9,107 | 291 | (3) | 9,395 | 7,790 | 22 | (26) | 7,786 | |
| Government and other government agency debt securities | 10,467 | 21 | (348) | 10,141 | 8,309 | 271 | (1) | 8,579 | 6,869 | 18 | (19) | 6,858 | |
| Central banks | — | — | — | — | — | — | — | — | — | — | — | — | |
| Credit institutions | 120 | 3 | (6) | 118 | 113 | 5 | — | 118 | 77 | 2 | — | 78 | |
| Other issuers | 509 | 7 | (6) | 510 | 685 | 15 | (2) | 698 | 843 | 2 | (6) | 840 | |
| Italy | 7,407 | 213 | (12) | 7,608 | 3,897 | 367 | — | 4,263 | 2,325 | 244 | (2) | 2,567 | |
| Government and other government agency | 7,274 | 212 | (12) | 7,474 | 3,789 | 366 | — | 4,154 | 2,193 | 244 | (2) | 2,435 | |
| Central banks | — | — | — | — | — | — | — | — | — | — | — | — | |
| Credit institutions | 47 | — | — | 47 | 48 | — | — | 48 | 52 | — | — | 52 | |
| Other issuers | 86 | 1 | — | 87 | 60 | 1 | — | 61 | 80 | 1 | — | 81 | |
| Japan | 4,961 | 7 | — | 4,968 | 4,551 | 1 | (3) | 4,549 | 2,735 | 3 | — | 2,738 | |
| Government and other government agency | 4,906 | 7 | — | 4,913 | 4,492 | — | (3) | 4,489 | 2,691 | 3 | — | 2,694 | |
| Central banks | — | — | — | — | — | — | — | — | — | — | — | — | |
| Credit institutions | 18 | — | — | 18 | — | — | — | — | — | — | — | — | — |
| Other issuers | 36 | 1 | — | 37 | 59 | 1 | — | 60 | 43 | — | — | 44 | |
| The United States | 3,900 | 44 | (18) | 3,926 | 4,642 | 52 | (3) | 4,691 | 11,376 | 68 | (51) | 11,393 | |
| Government and other government agency | 1,754 | 7 | (17) | 1,744 | 2,307 | 9 | (1) | 2,315 | 8,570 | 42 | (12) | 8,599 | |
| Central banks | — | — | — | — | — | — | — | — | — | — | — | — | |
| Credit institutions | 114 | 2 | — | 116 | 186 | 3 | — | 188 | 122 | 2 | — | 124 | |
| Other issuers | 2,032 | 35 | (1) | 2,065 | 2,149 | 40 | (2) | 2,187 | 2,684 | 24 | (39) | 2,670 | |
| Turkey | 2,888 | 199 | (168) | 2,920 | 3,456 | 90 | (73) | 3,473 | 3,752 | 38 | (76) | 3,713 | |
| Government and other government agency | 2,888 | 199 | (168) | 2,920 | 3,456 | 90 | (73) | 3,473 | 3,752 | 38 | (76) | 3,713 | |
| Central banks | — | — | — | — | — | — | — | — | — | — | — | — | |
| Credit institutions | — | — | — | — | — | — | — | — | — | — | — | — | |
| Other issuers | — | — | — | — | — | — | — | — | — | — | — | — | |
| Other countries | 10,298 | 286 | (55) | 10,529 | 9,892 | 372 | (39) | 10,225 | 6,810 | 307 | (104) | 7,013 | |
| Other foreign governments and other government agency debt securities | 2,488 | 115 | (29) | 2,574 | 2,177 | 136 | (14) | 2,300 | 2,079 | 137 | (76) | 2,140 | |
| Central banks | 1,698 | 3 | (5) | 1,696 | 1,599 | 21 | (8) | 1,611 | 1,005 | 9 | (4) | 1,010 | |
| Credit institutions | 2,306 | 92 | (16) | 2,382 | 2,468 | 116 | (8) | 2,576 | 1,743 | 109 | (12) | 1,840 | |
| Other issuers | 3,807 | 76 | (6) | 3,877 | 3,648 | 99 | (8) | 3,738 | 1,983 | 52 | (12) | 2,023 | |
| Subtotal | 40,551 | 780 | (612) | 40,719 | 35,545 | 1,172 | (120) | 36,596 | 34,788 | 681 | (259) | 35,210 | |
| Total | 58,176 | 1,511 | (614) | 59,074 | 66,356 | 2,089 | (137) | 68,308 | 57,395 | 1,617 | 280 | 58,731 | |
The credit ratings of the issuers of debt securities as of December 31, 2021, 2020 and 2019 are as follows:
Debt securities by rating
| 2021 | 2020 | 2019 | ||||
|---|---|---|---|---|---|---|
| Fair value (Millions of Euros) |
% | Fair value (Millions of Euros) |
% | Fair value (Millions of Euros) |
% | |
| AAA | 2,413 | 4.1% | 4,345 | 6.4% | 3,669 | 6.2% |
| AA+ | 586 | 1.0% | 595 | 0.9% | 7,279 | 12.4% |
| AA | 646 | 1.1% | 449 | 0.7% | 317 | 0.5% |
| AA- | 327 | 0.6% | 406 | 0.6% | 265 | 0.5% |
| A+ | 6,179 | 10.5% | 5,912 | 8.7% | 3,367 | 5.7% |
| A | 1,676 | 2.8% | 2,112 | 3.1% | 12,895 | 22.0% |
| A- | 18,760 | 31.8% | 31,614 | 46.3% | 10,947 | 18.6% |
| BBB+ | 11,465 | 19.4% | 8,629 | 12.6% | 9,946 | 16.9% |
| BBB | 10,961 | 18.6% | 4,054 | 5.9% | 2,966 | 5.1% |
| BBB- | 1,310 | 2.2% | 5,116 | 7.5% | 1,927 | 3.3% |
| BB+ or below | 4,379 | 7.4% | 4,731 | 6.9% | 4,712 | 8.0% |
| Unclassified | 372 | 0.6% | 345 | 0.5% | 441 | 0.8% |
| Total | 59,074 | 100.0% | 68,308 | 100.0% | 58,731 | 100.0% |
13.4 Gains/losses
Changes in gains / losses
The changes in the gains/losses (net of taxes) in December 31, 2021, 2020 and 2019 of debt securities recognized under the equity heading “Accumulated other comprehensive income (loss) – Items that may be reclassified to profit or loss – Fair value changes of debt instruments measured at fair value through other comprehensive income” and equity instruments recognized under the equity heading “Accumulated other comprehensive income (loss) – Items that will not be reclassified to profit or loss –Fair value changes of equity instruments measured at fair value through other comprehensive income” in the accompanying consolidated balance sheets are as follows:
Other comprehensive income - Changes in gains (losses) (Millions of Euros)
| Debt securities | Equity instruments | ||||||
|---|---|---|---|---|---|---|---|
| Notes | 2021 | 2020 | 2019 | 2021 | 2020 | 2019 | |
| Balance at the beginning | 2,069 | 1,760 | 943 | (1,256) | (403) | (155) | |
| Valuation gains and losses | (1,058) | 489 | 1,267 | 183 | (803) | (238) | |
| Amounts transferred to income | (63) | (72) | (119) | ||||
| Amounts transferred to Reserves | — | (73) | — | ||||
| Income tax and other | 325 | (107) | (331) | (7) | 23 | (10) | |
| Balance at the end | 30 | 1,274 | 2,069 | 1,760 | (1,079) | (1,256) | (403) |
In 2021, the debt securities presented an impairment amounting to €17 million in the heading “Impairment or reversal of impairment on financial assets not measured at fair value through profit or loss or net gains by modification– Financial assets at fair value through other comprehensive income” in the accompanying consolidated income statement (see Note 47).
In 2020, debt securities presented an impairment amounting to €19 million in the heading “Impairment or reversal of impairment on financial assets not measured at fair value through profit or loss or net gains by modification–Financial assets at fair value through other comprehensive income” in the accompanying consolidated income statement (see Note 47)
In 2019, debt securities presented an impairment amounting to €82 million in the heading “Impairment or reversal of impairment on financial assets not measured at fair value through profit or loss or net gains by modification–Financial assets at fair value through other comprehensive income” in the accompanying consolidated income statement (see Note 47) as a result of the decrease in the rating of debt securities in Argentina during the last quarter of 2019.
In 2021 and 2020, equity instruments presented an increase of €183 million and a decrease of €803 million, respectively, in the heading “Gains and losses from valuation - Accumulated other comprehensive income - Items that will not be reclassified to profit and loss - Fair value changes of equity instruments measured at fair value through other comprehensive income”, mainly due to the Telefónica quotation.
14. Financial assets at amortized cost
14.1 Breakdown of the balance
The breakdown of the balance under this heading in the accompanying consolidated balance sheets, according to the nature of the financial instrument, is as follows:
Financial assets at amortized cost (Millions of Euros)
| Notes | 2021 | 2020 | 2019 | |
|---|---|---|---|---|
| Debt securities | 34,781 | 35,737 | 38,877 | |
| Central banks | 15 | — | — | |
| Government | 32,130 | 28,727 | 31,526 | |
| Credit institutions | 817 | 783 | 719 | |
| Other financial corporations | 525 | 5,027 | 5,254 | |
| Non-financial corporations | 1,295 | 1,200 | 1,379 | |
| Loans and advances to central banks | 5,681 | 6,209 | 4,275 | |
| Loans and advances to credit institutions | 13,276 | 14,575 | 13,649 | |
| Reverse repurchase agreements | 2,788 | 1,914 | 1,817 | |
| Other loans and advances | 10,488 | 12,661 | 11,832 | |
| Loans and advances to customers (*) | 7.2.2 | 318,939 | 311,147 | 382,360 |
| Government | 19,682 | 19,391 | 28,222 | |
| Other financial corporations | 9,804 | 9,817 | 11,207 | |
| Non-financial corporations | 140,993 | 136,424 | 166,789 | |
| Other | 148,461 | 145,515 | 176,142 | |
| Total | 8.1 | 372,676 | 367,668 | 439,162 |
| Of which: impaired assets of loans and advances to customers (*) | 7.2.2 | 14,657 | 14,672 | 15,954 |
| Of which: loss allowances of loans and advances | 7.2.5 | (11,142) | (12,141) | (12,427) |
| Of which: loss allowances of debt securities | (52) | (48) | (52) |
- (*) The variation in 2020 corresponds mainly to the companies in the United States included in the USA Sale (see Notes 1.3, 3 and 21).
During financial years 2021, 2020 and 2019, there have been no significant reclassifications from the heading “Financial assets at amortized cost” to other headings or from other headings to “Financial assets at amortized cost”.
14.2 Debt securities
The breakdown of the balance under the heading “Debt securities” in the accompanying consolidated balance sheets, according to the issuer of the debt securities, is as follows:
Financial assets at amortized cost. Debt securities. (Millions of Euros)
| 2021 | 2020 | 2019 | |||||||||||
|---|---|---|---|---|---|---|---|---|---|---|---|---|---|
| Amortized cost | Unrealized gains | Unrealized losses | Fair value | Amortized cost | Unrealized gains | Unrealized losses | Fair value | Amortized cost | Unrealized gains | Unrealized losses | Fair value | ||
| Domestic debt securities | |||||||||||||
| Government and other government agencies | 17,693 | 1,326 | (7) | 19,013 | 13,656 | 1,212 | — | 14,868 | 12,755 | 630 | (21) | 13,363 | |
| Central banks | — | — | — | — | — | — | — | — | — | — | — | — | |
| Credit institutions | — | — | — | — | — | — | — | — | 26 | — | — | 26 | |
| Other issuers | 337 | 10 | (6) | 341 | 4,835 | 59 | (7) | 4,887 | 4,903 | 38 | (10) | 4,931 | |
| Subtotal | 18,031 | 1,336 | (13) | 19,353 | 18,492 | 1,271 | (7) | 19,756 | 17,684 | 668 | (31) | 18,320 | |
| Foreign debt securities | |||||||||||||
| Mexico | 8,464 | 182 | (138) | 8,508 | 7,771 | 534 | (16) | 8,289 | 6,374 | 168 | (18) | 6,525 | |
| Government and other government agencies debt securities | 7,669 | 170 | (131) | 7,708 | 6,963 | 479 | — | 7,442 | 5,576 | 166 | — | 5,742 | |
| Central banks | — | — | — | — | — | — | — | — | — | — | — | — | |
| Credit institutions | 614 | 11 | — | 625 | 632 | 55 | — | 687 | 526 | 2 | — | 529 | |
| Other issuers | 181 | 1 | (7) | 175 | 176 | — | (16) | 160 | 272 | — | (18) | 254 | |
| The United States | 93 | — | — | 93 | 52 | — | (26) | 26 | 6,125 | 111 | (20) | 6,217 | |
| Government and other government agencies | 10 | — | — | 10 | 14 | — | — | 14 | 5,690 | 111 | (18) | 5,783 | |
| Central banks | — | — | — | — | — | — | — | — | — | — | — | — | |
| Credit institutions | 26 | — | — | 26 | 23 | — | (16) | 7 | 25 | — | (1) | 25 | |
| Other issuers | 57 | — | — | 57 | 15 | — | (10) | 5 | 410 | — | (1) | 409 | |
| Turkey | 2,634 | 143 | (95) | 2,682 | 3,628 | 95 | (25) | 3,698 | 4,113 | 48 | (65) | 4,097 | |
| Government and other government agencies | 2,628 | 143 | (95) | 2,676 | 3,621 | 95 | (25) | 3,691 | 4,105 | 47 | (65) | 4,088 | |
| Central banks | — | — | — | — | — | — | — | — | — | — | — | — | |
| Credit institutions | 5 | — | — | 5 | 6 | — | — | 6 | 7 | 1 | — | 8 | |
| Other issuers | — | — | — | — | 1 | — | — | 1 | 1 | — | — | 1 | |
| Other countries | 5,559 | 289 | (37) | 5,812 | 5,795 | 505 | (1) | 6,299 | 4,581 | 82 | (26) | 4,637 | |
| Other foreign governments and other government agency | 4,144 | 257 | (28) | 4,374 | 4,473 | 467 | (1) | 4,939 | 3,400 | 82 | (22) | 3,459 | |
| Central banks | — | — | — | — | — | — | — | — | — | — | — | — | |
| Credit institutions | 171 | — | — | 171 | 122 | — | — | 122 | 135 | — | — | 135 | |
| Other issuers | 1,243 | 32 | (9) | 1,267 | 1,200 | 38 | — | 1,238 | 1,047 | — | (4) | 1,043 | |
| Subtotal | 16,750 | 614 | (270) | 17,094 | 17,245 | 1,134 | (68) | 18,311 | 21,194 | 409 | (129) | 21,476 | |
| Total | 34,781 | 1,950 | (284) | 36,447 | 35,737 | 2,405 | (75) | 38,067 | 38,877 | 1,077 | (160) | 39,796 | |
As of December 31, 2021, 2020 and 2019, the distribution according to the credit quality (ratings) of the issuers of debt securities classified as financial assets at amortized cost, was as follows:
Debt securities by rating
| 2021 | 2020 | 2019 | ||||
|---|---|---|---|---|---|---|
| Carrying amount (Millions of Euros) |
% | Carrying amount (Millions of Euros) |
% | Carrying amount (Millions of Euros) |
% | |
| AAA | 143 | 0.4% | 151 | 0.4% | 39 | 0.1% |
| AA+ | 77 | 0.2% | 74 | 0.2% | 6,481 | 16.7% |
| AA | 76 | 0.2% | 64 | 0.2% | 14 | — |
| AA- | 69 | 0.2% | 48 | 0.1% | 713 | 1.8% |
| A+ | 62 | 0.2% | 42 | — | — | — |
| A | 619 | 1.8% | 590 | 1.7% | 16,806 | 43.2% |
| A- | 16,312 | 46.9% | 16,736 | 46.8% | 607 | 1.6% |
| BBB+ | 9,336 | 26.8% | 7,919 | 22.2% | 3,715 | 9.6% |
| BBB | 3,853 | 11.1% | 942 | 2.6% | 551 | 1.4% |
| BBB- | 527 | 1.5% | 4,499 | 12.6% | 3,745 | 9.6% |
| BB+ or below | 3,120 | 9.0% | 3,928 | 11.0% | 5,123 | 13.2% |
| Unclassified | 587 | 1.7% | 743 | 2.1% | 1,083 | 2.8% |
| Total | 34,781 | 100.0% | 35,737 | 100.0% | 38,877 | 100.0% |
14.3 Loans and advances to customers
The breakdown of the balance under this heading in the accompanying consolidated balance sheets, according to their nature, is as follows:
Loans and advances to customers (Millions of Euros)
| 2021 | 2020 | 2019 | |
|---|---|---|---|
| On demand and short notice | 3,161 | 2,835 | 3,050 |
| Credit card debt | 14,030 | 13,093 | 16,354 |
| Trade receivables | 19,524 | 15,544 | 17,276 |
| Finance leases | 7,911 | 7,650 | 8,711 |
| Reverse repurchase agreements | 23 | 71 | 26 |
| Other term loans | 268,047 | 267,031 | 332,160 |
| Advances that are not loans | 6,243 | 4,924 | 4,784 |
| Total | 318,939 | 311,147 | 382,360 |
The heading “Financial assets at amortized cost – Loans and advances to customers” in the accompanying consolidated balance sheets also includes certain secured loans that, as mentioned in Appendix X and pursuant to the Mortgage Market Act, are linked to long-term mortgage covered bonds.
The following table sets forth a breakdown of the gross carrying amount "Loans and advances to customers" with maturity greater than one year by fixed and variable rate as of December 31, 2021, 2020 and 2019:
Loans and advances maturing in more than one year by fixed and variable rate (Millions of Euros)
| 2021 | 2020 | 2019 | |||||||
|---|---|---|---|---|---|---|---|---|---|
| Domestic | Foreign | Total | Domestic | Foreign | Total | Domestic | Foreign | Total | |
| Fixed rate | 56,756 | 62,228 | 118,984 | 46,104 | 66,444 | 112,548 | 55,920 | 68,915 | 124,835 |
| Variable rate | 75,544 | 44,237 | 119,781 | 86,710 | 41,452 | 128,162 | 79,329 | 97,765 | 177,095 |
| Total | 132,300 | 106,465 | 238,765 | 132,814 | 107,895 | 240,710 | 135,249 | 166,680 | 301,929 |
As of December 31, 2021, 2020 and 2019, 50%, 47% and 41%, respectively, of "Loans and advances to customers" with maturity greater than one year have fixed-interest rates and 50%, 53% and 59%, respectively, have variable interest rates.
This heading also includes some loans that have been securitized. The balances recognized in the accompanying consolidated balance sheets corresponding to these securitized loans are as follows:
Securitized loans (Millions of Euros)
| 2021 | 2020 | 2019 | |
|---|---|---|---|
| Securitized mortgage assets | 23,695 | 23,953 | 26,169 |
| Other securitized assets | 6,547 | 6,144 | 4,249 |
| Total | 30,242 | 30,098 | 30,418 |
15. Hedging derivatives and fair value changes of the hedged items in portfolio hedges of interest rate risk
The balance of these headings in the accompanying consolidated balance sheets is as follows:
Derivatives – Hedge accounting and fair value changes of the hedged items in portfolio hedge of interest rate risk (Millions of Euros)
| 2021 | 2020 | 2019 | |
|---|---|---|---|
| ASSETS | |||
| Derivatives – Hedge accounting | 1,805 | 1,991 | 1,729 |
| Fair value changes of the hedged items in portfolio hedges of interest rate risk | 5 | 51 | 28 |
| LIABILITIES | |||
| Derivatives - Hedge accounting | 2,626 | 2,318 | 2,233 |
| Fair value changes of the hedged items in portfolio hedges of interest rate risk | — | — | — |
As of December 31, 2021, 2020 and 2019, the main positions hedged by the Group and the derivatives designated to hedge those positions were:
- Fair value hedging:
- Fixed-interest debt securities at fair value through other comprehensive income and at amortized cost: The interest rate risk of these securities is hedged using interest rate derivatives (fixed-variable swaps) and forward sales.
- Long-term fixed-interest debt securities issued by the Bank: the interest rate risk of these securities is hedged using interest rate derivatives (fixed-variable swaps).
- Fixed-interest loans: The equity price risk of these instruments is hedged using interest rate derivatives (fixed-variable swaps).
- Fixed-interest and/or embedded derivative deposit portfolio hedges: it covers the interest rate risk through fixed-variable swaps. The valuation of the borrowed deposits corresponding to the interest rate risk is in the heading "Fair value changes of the hedged items in portfolio hedges of interest rate risk”.
- Cash-flow hedges: Most of the hedged items are floating interest-rate loans and asset hedges linked to the inflation of the financial assets at fair value through other comprehensive income portfolio. This risk is hedged using foreign-exchange, interest-rate swaps, inflation and FRA’s (“Forward Rate Agreement”).
- Net foreign-currency investment hedges: These hedged risks are foreign-currency investments in the Group’s foreign subsidiaries. This risk is hedged mainly with foreign-exchange options and forward currency sales and purchases.
Note 7 analyzes the Group’s main risks that are hedged using these derivatives.
The details of the net positions by hedged risk of the fair value of the hedging derivatives recognized in the accompanying consolidated balance sheets are as follows:
Derivatives - Hedge accounting. Breakdown by type of risk and type of hedge (Millions of Euros)
| 2021 | 2020 | 2019 | ||||
|---|---|---|---|---|---|---|
| Assets | Liabilities | Assets | Liabilities | Assets | Liabilities | |
| Interest rate | 697 | 322 | 989 | 525 | 920 | 488 |
| OTC | 697 | 322 | 989 | 525 | 920 | 488 |
| Organized market | — | — | — | — | — | — |
| Equity | — | — | — | — | — | — |
| OTC | — | — | — | — | — | 3 |
| Organized market | — | — | — | — | — | — |
| Foreign exchange and gold | 463 | 135 | 435 | 350 | 420 | 316 |
| OTC | 463 | 135 | 435 | 350 | 420 | 316 |
| Organized market | — | — | — | — | — | — |
| Credit | — | — | — | — | — | — |
| Commodities | — | — | — | — | — | — |
| Other | — | — | — | — | — | — |
| FAIR VALUE HEDGES | 1,160 | 457 | 1,424 | 874 | 1,341 | 808 |
| Interest rate | 228 | 1,786 | 154 | 1,055 | 224 | 850 |
| OTC | 226 | 1,786 | 154 | 1,041 | 224 | 839 |
| Organized market | 2 | — | — | 15 | — | 11 |
| Equity | — | — | — | — | — | — |
| Foreign exchange and gold | 180 | 79 | 225 | 55 | 115 | 18 |
| OTC | 180 | 79 | 225 | 50 | 115 | 18 |
| Organized market | — | — | — | 5 | — | — |
| Credit | — | — | — | — | — | — |
| Commodities | — | — | — | — | — | — |
| Other | — | — | — | — | — | — |
| CASH FLOW HEDGES | 408 | 1,865 | 379 | 1,111 | 339 | 868 |
| HEDGE OF NET INVESTMENTS IN A FOREIGN OPERATION | 198 | 196 | 166 | 139 | 12 | 242 |
| PORTFOLIO FAIR VALUE HEDGES OF INTEREST RATE RISK | 18 | 95 | 18 | 170 | 37 | 216 |
| PORTFOLIO CASH FLOW HEDGES OF INTEREST RATE RISK | 21 | 13 | 3 | 23 | 1 | 99 |
| DERIVATIVES-HEDGE ACCOUNTING | 1,805 | 2,626 | 1,991 | 2,318 | 2,729 | 2,233 |
| of which: OTC - credit institutions | 1,454 | 2,248 | 1,718 | 1,965 | 1,423 | 1,787 |
| of which: OTC - other financial corporations | 349 | 378 | 273 | 333 | 306 | 426 |
Below there is a breakdown of the items covered by fair value hedges:
Hedged items in fair value hedges (Millions of Euros)
| Carrying amount | Hedge adjustments included in the carrying amount of assets/liabilities | Remaining adjustments for discontinued micro hedges including hedges of net positions | Hedged items in portfolio hedge of interest rate risk | |||||
|---|---|---|---|---|---|---|---|---|
| 2021 | 2020 | 2021 | 2020 | 2021 | 2020 | 2021 | 2020 | |
| ASSETS | ||||||||
| Financial assets measured at fair value through other comprehensive income | 20,333 | 28,091 | (52) | (99) | 11 | 12 | — | — |
| Interest rate | 20,285 | 28,059 | ||||||
| Other | 49 | 33 | ||||||
| Financial assets measured at amortized cost | 8,273 | 11,177 | 168 | 386 | 5 | 3 | 1,997 | 2,500 |
| Interest rate | 8,270 | 11,177 | ||||||
| Foreign exchange and gold | 2 | - | ||||||
| LIABILITIES | ||||||||
| Financial liabilities measured at amortized costs | 24,567 | 23,546 | (690) | (576) | — | 2 | — | |
| Interest rate | 24,563 | 23,543 | ||||||
| Foreign exchange and gold | 5 | 3 | ||||||
The following is the breakdown, by their notional maturities, of the hedging instruments as of December 31, 2021:
Calendar of the notional maturities of the hedging instruments (Millions of Euros)
| Up to 3 months | From 3 months to 1 year | From 1 to 5 years | More than 5 years | Total | |
|---|---|---|---|---|---|
| FAIR VALUE HEDGES | 2,820 | 8,467 | 28,506 | 13,615 | 53,409 |
| Of which: Interest rate | 2,807 | 8,360 | 27,239 | 13,615 | 52,021 |
| CASH FLOW HEDGES | 195 | 3,346 | 36,410 | 4,381 | 44,332 |
| Of which: Interest rate | — | 2,713 | 34,787 | 4,381 | 41,882 |
| HEDGE OF NET INVESTMENTS IN A FOREIGN OPERATION | 2,241 | 2,617 | — | — | 4,857 |
| PORTFOLIO FAIR VALUE HEDGES OF INTEREST RATE RISK | 175 | 647 | 1,258 | 1,108 | 3,187 |
| PORTFOLIO CASH FLOW HEDGES OF INTEREST RATE RISK | 171 | 428 | 851 | 132 | 1,583 |
| DERIVATIVES-HEDGE ACCOUNTING | 5,602 | 15,505 | 67,024 | 19,236 | 107,368 |
In 2021, 2020 and 2019, there was no reclassification in the accompanying consolidated income statements of any amount corresponding to cash flow hedges that was previously recognized in equity (see Note 41).
The amount for derivatives designated as accounting hedges that did not pass the effectiveness test in December 31, 2021, 2020 and 2019 were not material.
IBOR Reform
The transition from IBOR indices to the new risk free rates (RFR) (see Note 2.3) may cause uncertainty about the future of some references or its impact on the contracts held by an entity, which could cause uncertainty about the term or the amounts of the cash flows of the hedged instrument or the hedging instrument. Due to such uncertainties, in the period before the benchmark rate reform actually takes place, some entities may be forced to discontinue hedge accounting, or not be able to designate new hedging relationships. To avoid this, the IASB made a series of transitory amendments to IFRS 9, IAS 39 and IFRS 7 providing temporary exceptions to the application of certain specific hedge accounting requirements that are applicable to all hedging relationships that are affected by the uncertainty derived from the IBOR Reform. These exceptions should end once the uncertainty is resolved (rates to be modified according to the new RFRs) or the hedge ceases to exist.
The nominal amount of the hedging instruments for hedging relationships directly affected by the IBOR reform as of December 31, 2021 is the following:
Hedges affected by the IBOR reform (Millions of Euros)
| LIBOR USD | LIBOR GBP | Other | Total | |
|---|---|---|---|---|
| Cash flow hedges | 1,056 | — | — | 1,056 |
| Fair value hedges | 7,939 | 389 | 583 | 8,910 |
16. Investments in joint ventures and associates
16.1 Joint ventures and associates
The breakdown of the balance of “Investments in joint ventures and associates” in the accompanying consolidated balance sheets is as follows:
Joint Ventures and Associates Entities. Breakdown by entities (Millions of Euros)
| 2021 | 2020 | 2019 | |
|---|---|---|---|
| Joint ventures | |||
| Altura Markets S.V., S.A. | 76 | 77 | 73 |
| RCI Colombia | 40 | 36 | 37 |
| Desarrollo Metropolitanos del Sur, S.L. | 18 | 17 | 14 |
| Other | 18 | 19 | 30 |
| Subtotal | 152 | 149 | 154 |
| Associates | |||
| Divarian Propiedad, S.A.U. | — | 567 | 630 |
| Metrovacesa, S.A. | 259 | 285 | 443 |
| BBVA Allianz Seguros y Reaseguros, S.A. | 254 | 250 | — |
| ATOM Bank PLC | 77 | 64 | 136 |
| Solarisbank AG | 61 | 39 | 36 |
| Cofides | 28 | 25 | 23 |
| Redsys servicios de procesamiento, S.L. | 19 | 14 | 14 |
| Servicios Electrónicos Globales S.A. de CV | 15 | 11 | 11 |
| Other | 35 | 33 | 41 |
| Subtotal | 749 | 1,288 | 1,334 |
| Total | 900 | 1,437 | 1,488 |
Details of the joint ventures and associates as of December 31, 2021 are shown in Appendix II.
The following is a summary of the changes in the years ended December 31, 2021, 2020 and 2019 under this heading in the accompanying consolidated balance sheets:
Joint ventures and associates. Changes in the year (Millions of Euros)
| Notes | 2021 | 2020 | 2019 | |
|---|---|---|---|---|
| Balance at the beginning | 1,437 | 1,488 | 1,578 | |
| Acquisitions and capital increases | 22 | 257 | 161 | |
| Disposals and capital reductions | (1) | (47) | (149) | |
| Transfers and changes of consolidation method | (559) | (7) | (27) | |
| Share of profit and loss | 39 | 1 | (39) | (42) |
| Exchange differences | 9 | (27) | 10 | |
| Dividends, valuation adjustments and others | (9) | (188) | (43) | |
| Balance at the end | 900 | 1,437 | 1,488 |
During the year 2021, the most significant changes in the heading “Investment in joint ventures and associates” correspond to the reclassification of the 20% stake in Divarian Property, S.A.U. under the heading "Non-current assets and disposal groups classified as held for sale" in July 2021 and their subsequent sale in October 2021 (see Note 21).
During the year 2020, the most significant changes in the heading “Investments in joint ventures and associates” correspond to changes in the valuation of Metrovacesa and BBVA Allianz Seguros y Reaseguros, S.A.
During the year 2019, there was no significant change in the heading “Investment in joint ventures and associates”.
Appendix III provides notifications on acquisitions and disposals of holdings in subsidiaries, joint ventures and associates, in compliance with article 155 of the Corporations Act and article 125 of the Securities Market Act 4/2015.
16.2 Other information about associates and joint ventures
If these entities had been consolidated rather than accounted for using the equity method, the change in each of the lines of balance sheet and the consolidated income statement would not be significant.
As of December 31, 2021, 2020 and 2019 there was no financial support agreement or other contractual commitment to associates and joint ventures entities from the holding or the subsidiaries that are not recognized in the financial statements (see Note 53.2).
As of December 31, 2021, 2020 and 2019 there was no contingent liability in connection with the investments in joint ventures and associates (see Note 53.2).
16.3 Impairment
As required by IAS 36, the book value of the associates and joint venture entities has been compared with their recoverable amount, with the latter being calculated as the higher between the value in use and the fair value minus the cost of sale. For the year ended December 31, 2021, there was no impairment recorded in the Group’s consolidated income statement. For the year ended December 31, 2020, €190 million were recorded due to impairment and for the year ended December 31, 2019, €46 million (see Note 48).
17. Tangible assets
The breakdown and movement of the balance and changes of this heading in the accompanying consolidated balance sheets, according to the nature of the related items, is as follows:
Tangible assets. Breakdown by type of assets and changes in the year 2021. (Millions of Euros)
| Right to use asset | Investment Properties | Assets leased out under an operating lease | Total | ||||||
|---|---|---|---|---|---|---|---|---|---|
| Notes | Land and buildings | Work in progress | Furniture, fixtures and vehicles | Own use | Investment Properties | ||||
| Cost | |||||||||
| Balance at the beginning | 4,380 | 52 | 5,515 | 3,061 | 123 | 201 | 345 | 13,677 | |
| Additions | 58 | 31 | 262 | 230 | 4 | — | — | 585 | |
| Retirements | (5) | (1) | (281) | (59) | — | (1) | — | (347) | |
| Acquisition of subsidiaries in the year | — | — | — | — | — | — | — | — | |
| Disposal of entities in the year | — | — | — | — | — | — | — | — | |
| Transfers | (112) | (8) | (29) | (34) | 35 | 1 | — | (147) | |
| Exchange difference and other | 29 | (7) | (79) | (44) | — | (54) | (78) | (233) | |
| Balance at the end | 4,350 | 67 | 5,388 | 3,154 | 162 | 147 | 267 | 13,535 | |
| Accrued depreciation | |||||||||
| Balance at the beginning | 833 | — | 3,859 | 582 | 27 | 16 | 54 | 5,371 | |
| Additions | 45 | 79 | — | 358 | 284 | 15 | 4 | — | 740 |
| Additions transfer to discontinued operations | — | — | — | — | — | — | — | — | |
| Retirements | (19) | — | (259) | (16) | — | (4) | — | (298) | |
| Acquisition of subsidiaries in the year | — | — | — | — | — | — | — | — | |
| Disposal of entities in the year | — | — | — | — | — | — | — | — | |
| Transfers | (23) | — | (17) | (5) | 5 | 1 | — | (39) | |
| Exchange difference and other | 30 | — | (108) | (34) | - | - | (21) | (134) | |
| Balance at the end | 900 | — | 3.833 | 811 | 47 | 17 | 33 | 5,641 | |
| Impairment | |||||||||
| Balance at the beginning | 149 | — | — | 274 | 26 | 34 | — | 483 | |
| Additions (*) | 49 | — | — | 1 | 151 | 8 | 1 | — | 161 |
| Retirements | — | — | — | — | — | — | — | — | |
| Acquisition of subsidiaries in the year | — | — | — | — | — | — | — | — | |
| Disposal of entities in the year | — | — | — | — | — | — | — | — | |
| Transfers | (24) | — | 17 | — | — | 2 | — | (5) | |
| Exchange difference and other | (11) | — | (18) | 2 | — | (16) | — | (43) | |
| Balance at the end | 114 | — | — | 427 | 34 | 21 | — | 596 | |
| Net tangible assets | |||||||||
| Balance at the beginning | 3,398 | 52 | 1,656 | 2,205 | 70 | 151 | 291 | 7,823 | |
| Balance at the end | 3,336 | 67 | 1,555 | 1,916 | 81 | 109 | 234 | 7,298 | |
- (*) In 2021, it includes allowances on right of use of the rented offices after the agreement with union representatives on the collective layoff procedure proposed for Banco Bilbao Vizcaya Argentaria, S.A. in Spain (see Notes 24 and 49).
Tangible assets: Breakdown by type of assets and changes in the year 2020 (Millions of Euros)
| Right to use asset | Investment properties | Assets leased out under an operating lease | Total | ||||||
|---|---|---|---|---|---|---|---|---|---|
| Notes | Land and buildings | Work in progress | Furniture, fixtures and vehicles | Own use | Investment properties | ||||
| Cost | |||||||||
| Balance at the beginning | 6,001 | 56 | 6,351 | 3,516 | 101 | 216 | 337 | 16,578 | |
| Additions | 157 | 54 | 255 | 183 | — | 2 | — | 651 | |
| Retirements | (10) | (23) | (294) | (157) | (3) | (11) | — | (498) | |
| Acquisition of subsidiaries in the year | — | — | — | — | — | — | — | — | |
| Companies held for sale (*) | (925) | (31) | (366) | (294) | — | — | — | (1,616) | |
| Transfers | (248) | (2) | (5) | (60) | 25 | 18 | — | (272) | |
| Exchange difference and other | (595) | (2) | (426) | (127) | — | (24) | 8 | (1,166) | |
| Balance at the end | 4,380 | 52 | 5,515 | 3,061 | 123 | 201 | 345 | 13,677 | |
| Accrued depreciation | |||||||||
| Balance at the beginning | 1.253 | — | 4.344 | 370 | 11 | 15 | 74 | 6.067 | |
| Additions | 45 | 83 | — | 370 | 312 | 12 | 3 | 1 | 781 |
| Additions transfer to discontinued operations (*) | 24 | — | 20 | 32 | — | — | — | 76 | |
| Retirements | (2) | — | (248) | (10) | — | — | — | (260) | |
| Acquisition of subsidiaries in the year | — | — | — | — | — | — | — | — | |
| Companies held for sale (*) | (373) | — | (321) | (71) | — | — | — | (765) | |
| Transfers | (42) | — | (12) | (9) | 4 | 1 | — | (58) | |
| Exchange difference and other | (110) | — | (294) | (42) | — | (3) | (21) | (470) | |
| Balance at the end | 833 | — | 3,859 | 582 | 27 | 16 | 54 | 5,371 | |
| Impairment | |||||||||
| Balance at the beginning | 212 | — | — | 191 | 14 | 26 | — | 443 | |
| Additions | 49 | 18 | — | 26 | 68 | 12 | 1 | — | 125 |
| Retirements | — | — | — | — | — | — | — | — | |
| Acquisition of subsidiaries in the year | — | — | — | — | — | — | — | — | |
| Companies held for sale (*) | (8) | — | — | — | — | — | — | (8) | |
| Transfers | (68) | — | — | 10 | — | 7 | — | (51) | |
| Exchange difference and other | (5) | — | (26) | 5 | — | — | — | (26) | |
| Balance at the end | 149 | — | — | 274 | 26 | 34 | — | 483 | |
| Net tangible assets | |||||||||
| Balance at the beginning | 4,536 | 56 | 2,007 | 2,955 | 76 | 175 | 263 | 10,068 | |
| Balance at the end | 3,398 | 52 | 1,656 | 2,205 | 70 | 151 | 290 | 7,823 | |
- (*) Amount is mainly due to the companies in the United States included in the USA Sale (see Notes 1.3, 3 and 21).
Tangible assets. Breakdown by type of assets and changes in the year 2019 (Millions of Euros)
| Right to use asset | Investment properties | Assets leased out under an operating lease | Total | ||||||
|---|---|---|---|---|---|---|---|---|---|
| Notes | Land and buildings | Work in progress | Furniture, fixtures and vehicles | Own use | Investment properties | ||||
| Cost | |||||||||
| Balance at the beginning | 5,939 | 70 | 6,314 | — | — | 201 | 386 | 12,910 | |
| Additions | 90 | 63 | 335 | 3,574 | 101 | 12 | — | 4,175 | |
| Retirements | (44) | (20) | (302) | (57) | — | (10) | — | (433) | |
| Acquisition of subsidiaries in the year | — | — | — | — | — | — | — | — | |
| Disposal of entities in the year | — | — | — | — | — | — | — | — | |
| Transfers | (41) | (51) | (8) | (1) | — | 13 | — | (88) | |
| Exchange difference and other | 57 | (6) | 12 | — | — | — | (49) | 14 | |
| Balance at the end | 6,001 | 56 | 6,351 | 3,516 | 101 | 216 | 337 | 16,578 | |
| Accrued depreciation | |||||||||
| Balance at the beginning | 1,138 | — | 4,212 | — | — | 11 | 76 | 5,437 | |
| Additions | 45 | 92 | — | 431 | 338 | 11 | 4 | — | 876 |
| Additions transfer to discontinued operations (*) | 34 | — | 26 | 43 | — | — | — | 103 | |
| Retirements | (38) | — | (255) | (3) | — | — | — | (296) | |
| Acquisition of subsidiaries in the year | — | — | — | — | — | — | — | — | |
| Disposal of entities in the year | — | — | — | — | — | — | — | — | |
| Transfers | (16) | — | (13) | (1) | — | — | — | (30) | |
| Exchange difference and other | 43 | — | (57) | (7) | — | — | (2) | (23) | |
| Balance at the end | 1,253 | — | 4,344 | 370 | 11 | 15 | 74 | 6,067 | |
| Impairment | |||||||||
| Balance at the beginning | 217 | — | — | — | — | 27 | — | 244 | |
| Additions | 49 | 14 | — | 20 | 60 | — | — | — | 94 |
| Retirements | (3) | — | — | — | — | — | — | (3) | |
| Acquisition of subsidiaries in the year | — | — | — | — | — | — | — | — | |
| Disposal of entities in the year | — | — | — | — | — | — | — | — | |
| Transfers | (16) | — | — | 127 | 14 | (4) | — | 121 | |
| Exchange difference and other | — | — | (20) | 4 | — | 3 | — | (13) | |
| Balance at the end | 212 | — | — | 191 | 14 | 26 | — | 443 | |
| Net tangible assets | |||||||||
| Balance at the beginning | 4,584 | 70 | 2,102 | — | — | 163 | 310 | 7,229 | |
| Balance at the end | 4,536 | 56 | 2,007 | 2,955 | 76 | 175 | 263 | 10,068 | |
- (*) Amount is mainly due to the companies in the United States included in the USA Sale (see Notes 1.3, 3 and 21).
The right to use asset consists mainly of the rental of commercial real estate premises for central services and the network branches located in the countries where the Group operates whose average term is between 5 and 20 years. The clauses included in rental contracts correspond to a large extent to rental contracts under normal market conditions in the country where the property is rented.
As of December 31, 2021, 2020 and 2019, the cost of fully amortized tangible assets that remained in use were €2,318, €2,299 and €2,658 million respectively while its recoverable residual value was not significant.
As of December 31, 2021, 2020 and 2019 the amount of tangible assets under financial lease schemes on which the purchase option is expected to be exercised was not material. The main activity of the Group is carried out through a network of bank branches located geographically as shown in the following table:
Branches by geographical location (Number of branches)
| 2021 | 2020 | 2019 | |
|---|---|---|---|
| Spain (*) | 1,895 | 2,482 | 2,642 |
| Mexico | 1,716 | 1,746 | 1,860 |
| South America | 1,434 | 1,514 | 1,530 |
| The United States (**) | - | 639 | 643 |
| Turkey | 1,006 | 1,021 | 1,038 |
| Rest/th> | 32 | 30 | 31 |
| Total | 6,083 | 7,432 | 7,744 |
- (*) In 2021, the variation is mainly due to the closing of rented branches after the agreement with the union representatives on the collective layoff procedure that is being carried out at Banco Bilbao Vizcaya Argentaria, S.A (see Notes 24 and 49).
- (**) In 2021, the variation is mainly due to the companies in the United States included in the USA Sale (see Notes 1.3, 3 and 21).
The following table shows the detail of the net carrying amount of the tangible assets corresponding to Spanish and foreign subsidiaries as of December 31, 2021, 2020 and 2019:
Tangible assets by Spanish and foreign subsidiaries. Net assets values (Millions of euros)
| 2021 (*) | 2020 (**) | 2019 | |
|---|---|---|---|
| BBVA and Spanish subsidiaries | 3,873 | 4,294 | 4,865 |
| Foreign subsidiaries | 3,425 | 3,529 | 5,203 |
| Total | 7,298 | 7,823 | 10,068 |
- (*) The variation in 2021 is mainly due to the reclassification of owned offices and facilities from "Tangible assets" to "Non-current assets and disposal groups classified as held for sale" (see Notes 21, 24 and 50).
- (**) The variation in 2020 is mainly due to the companies in the United States included in the USA Sale (see Notes 1.3, 3 and 21), whose owned offices and facilities were reclassified from "Tangible assets" to "Non-current assets and disposal groups classified as held for sale".
18. Intangible assets
18.1 Goodwill
The breakdown of the balance under this heading in the accompanying consolidated balance sheets, according to the CGU to which goodwill has been allocated, is as follows:
Goodwill. Breakdown by CGU and changes of the year (Millions of Euros)
| The United States (*) | Mexico | Turkey | Colombia | Chile | Other | Total | |
|---|---|---|---|---|---|---|---|
| Balance as of December 31, 2018 | 5,066 | 519 | 382 | 161 | 29 | 23 | 6,180 |
| Additions | - | - | - | - | - | - | - |
| Exchange difference | 98 | 31 | (36) | 3 | (2) | (1) | 93 |
| Impairment | (1,318) | — | — | — | — | — | (1,318) |
| Other | — | — | — | — | — | — | — |
| Balance as of December 31, 2019 | 3,846 | 550 | 346 | 164 | 27 | 22 | 4,955 |
| Additions | - | - | - | - | - | - | - |
| Exchange difference | (22) | (72) | (92) | (21) | - | (1) | (208) |
| Impairment | (2,084) | - | - | - | - | (13) | (2,097) |
| Companies held for sale | (1,740) | - | - | - | - | - | (1,740) |
| Other | - | - | - | - | - | - | - |
| Balance as of December 31, 2020 | - | 478 | 254 | 143 | 27 | 8 | 910 |
| Additions | - | - | - | - | - | - | - |
| Exchange difference | - | 26 | (102) | (9) | (3) | - | (88) |
| Impairment | - | - | - | - | - | (4) | (4) |
| Other | - | - | - | - | - | - | - |
| Balance as of December 31, 2021 | - | 504 | 152 | 134 | 24 | 4 | 818 |
- (*) Since the USA sale agreement, the United States is no longer considered a CGU (see Note 3).
Goodwill in business combinations
There were no significant business combinations during 2021, 2020 and 2019.
Impairment Test
As mentioned in Note 2.2.8, the CGU to which goodwill has been allocated, are periodically tested for impairment by including the allocated goodwill in their carrying amount. This analysis is performed at least annually and whenever there is any indication of impairment. Furthermore, it is analyzed whether certain changes in the valuation assumptions used could give rise to differences in the result of the impairment test.
The BBVA Group performs estimations on the recoverable amount of certain CGU by calculating the value in use through the discounted value of future cash flows method.
The main hypotheses used for the value in use calculation are the following:
- The forecast cash flows, including net interest margin and cost of risk, estimated by the Group's management, and based on the latest available budgets for the next 4 to 5 years, considering the macroeconomic variables of each CGU, regarding the existing balance structure as well as macroeconomic variables such as the evolution of interest rates and the CPI of the geography where the CGU is located, among others.
- The constant growth rate for extrapolating cash flows, starting in the fourth or fifth year, beyond the period covered by the budgets or forecasts.
- The discount rate on future cash flows, which coincides with the cost of capital assigned to each CGU, and which consists of a risk-free rate plus a premium that reflects the inherent risk of each of the businesses evaluated.
The focus used by the Group's management to determine the values of the assumptions is based both on its projections and past experience. These values are verified and use external sources of information, wherever possible. Additionally, the valuation of the goodwill of the CGU of Turkey has been reviewed by independent experts (not the Group's external auditors).
Goodwill - Mexico CGU
The Group’s most significant goodwill corresponds to the CGU in Mexico, the main significant assumptions used in the impairment test of this CGU as of December 31, 2021, 2020 and 2019 are as follows:
Impairment test assumptions CGU goodwill in Mexico
| 2021 | 2020 | ||
|---|---|---|---|
| Discount rate (*) | 14.5% | 15.3% | 14.8% |
| Growth rate | 5.7% | 5.7% | 5.9% |
- (*) After tax discount rates.
In accordance with paragraph 33.c of IAS 36, as of December 31, 2021, the Group used a growth rate of 5.7% based on the real GDP growth rate of Mexico, the expected inflation rate and the potential growth of the banking sector in Mexico.
The assumptions with a greater relative weight and whose volatility could have a greater impact in determining the present value of the cash flows starting on the fourth year are the discount rate and the growth rate. Below, in a simplified way, is shown the increased (or decreased) amount of the CGU recoverable amount as a result of a reasonable variation (in basis points) of each of the key assumptions, considered in isolation as of December 31, 2021, where, in each case, the value in use would continue to exceed their book value:
Sensitivity analysis for main assumptions - Mexico (Millions of Euros)
| Increase of 50 basis points (*) | Decrease of 50 basis points (*) | |
|---|---|---|
| Discount rate | (1,709) | 1,913 |
| Growth rate | 1,194 | (1,067) |
- (*) The use of very different discount or growth rates would be inconsistent with the macroeconomic assumptions under which the Unit builds its business plan, such as inflation assumptions or interest rate curves used to determine cash flows.
Goodwill - Turkey CGU
The main significant assumptions used in the impairment test of the CGU of Turkey as of December 31, 2021, 2020 and 2019 are:
Impairment test assumptions CGU goodwill in Turkey
| 2021 | 2020 | 2019 | |
|---|---|---|---|
| Discount rate (*) | 27.7% | 21.0% | 17.4% |
| Growth rate | 7.0% | 7.0% | 7.0% |
- (*) After tax discount rates.
Given the potential growth of the sector in Turkey, in accordance with paragraph 33.c of IAS 36, as of December 31, 2021, 2020 and 2019 the Group used a steady growth rate of 7% based on the real GDP growth rate of Turkey and expected inflation.
The assumptions with a greater relative weight and whose volatility could affect more in determining the present value of the cash flows starting on the fifth year are the discount rate and the growth rate. Below, in a simplified way, is shown the increased (or decreased) amount of the recoverable amount as a result of a reasonable variation (in basis points) of each of the key assumptions, considered in isolation as of December 31, 2021, where, in any case, the value in use would continue to exceed their book value:
Sensitivity analysis for main assumptions - Turkey (Millions of Euros)
| Impact of an increase of 50 basis points (*) | Impact of a decrease of 50 basis points (*) | |
|---|---|---|
| Discount rate | (84) | 88 |
| Growth rate | 14 | (13) |
- (*) The use of very different discount or growth rates would be inconsistent with the macroeconomic assumptions under which the Unit builds its business plan, such as inflation assumptions or interest rate curves used to determine cash flows
Considering the uncertainty caused by the current economic situation, the Group has carried out additional sensitivities on other variables such as the net interest income, the cost of risk, the efficiency ratio and loans and the advances to customers growth forecasts. No required modifications to the result of the impairment test on the CGU were identified.
Goodwill - The United States CGU
Since the USA sale, the United States in 2021 is no longer considered a CGU (see Note 3).
As of March 31, 2020, the Group identified an indicator of impairment of goodwill in the United States CGU and as a result of the goodwill impairment test, the Group estimated impairment in the United States CGU of €2,084 million, which was mainly due to the negative impact of the update of the macroeconomic scenario following the COVID-19 pandemic and the expected evolution of interest rates. This recognition did not affect the tangible book value or the liquidity nor the solvency ratio of the BBVA Group.
As of December 31, 2019, the Group estimated impairment losses in the United States CGU of €1,318 million, which was mainly as a result of the negative evolution of interest rates, especially in the second half of the year, which accompanied by the slowdown of the economy caused the expected evolution of results to be below the previous estimation. This recognition did not affect the tangible book value nor the liquidity or the solvency ratio of the BBVA Group.
The main significant assumptions used in the impairment test of this CGU as of March 31, 2020 and December 31, 2019 were as follows:
Impairment test assumptions CGU goodwill - United States
| 2020 | 2019 | |
|---|---|---|
| Discount rate (*) | 10.3% | 10.0% |
| Growth rate | 3.0% | 3.5% |
- (*) After tax discount rates.
Goodwill - Other CGU
The impairment tests carried out on the rest of the CGU have not detected significant impairment. Likewise, the sensitivity analysis on the main assumptions carried out for the rest of the CGU of the Group indicate that their value in use would continue to exceed their book value.
18.2 Other intangible assets
The breakdown of the balance and changes of this heading in the accompanying consolidated balance sheets, according to the nature of the related items, is as follows:
Other intangible assets (Millions of Euros)
| 2021 | 2020 | 2019 | |
|---|---|---|---|
| Computer software acquisition expense | 1,239 | 1,202 | 1,598 |
| Other intangible assets with an infinite useful life | 12 | 12 | 11 |
| Other intangible assets with a definite useful life | 128 | 221 | 401 |
| Total | 1,379 | 1,435 | 2,010 |
The changes of this heading during the years ended December 31, 2021, 2020 and 2019, are as follows:
Other intangible assets (Millions of Euros)
| Notes | Computer software | Other intangible assets | Total of intangible assets | |||||||
|---|---|---|---|---|---|---|---|---|---|---|
| 2021 | 2020 | 2019 | 2021 | 2020 | 2019 | 2021 | 2020 | 2019 | ||
| Balance at the beginning | 1,202 | 1,598 | 1,605 | 233 | 412 | 529 | 1,435 | 2,010 | 2,134 | |
| Additions | 470 | 452 | 525 | — | 8 | 8 | 470 | 460 | 533 | |
| Amortization in the year | 45 | (446) | (448) | (447) | (48) | (59) | (63) | (494) | (507) | (510) |
| Amortization transfer to discontinued operations (*) | — | (77) | (106) | — | (3) | (4) | — | (80) | (110) | |
| Exchange differences and other | 29 | (38) | 32 | (45) | (91) | (58) | (16) | (129) | (25) | |
| Impairment | (15) | (6) | (11) | — | — | (1) | (15) | (6) | (12) | |
| Decreases by companies held for sale (*) | — | (279) | — | — | (34) | — | — | (313) | — | |
| Balance at the end | 1,239 | 1,202 | 1,598 | 140 | 233 | 412 | 1,379 | 1,435 | 2,010 | |
- (*) Amount is mainly due to the companies in the United States included in the USA Sale (see Notes 1.3, 3 and 21).
As of December 31, 2021, 2020 and 2019, the cost of fully amortized intangible assets that remained in use were €2,992 million, €2,622 million and €2,702 million respectively, while their recoverable value was not significant.
19. Tax assets and liabilities
19.1 Consolidated tax group
Pursuant to current legislation, BBVA consolidated tax group in Spain includes the Bank (as the parent company) and its Spanish subsidiaries that meet the requirements provided for under Spanish legislation regulating the taxation regime for the consolidated profit of corporate groups.
The Group’s non-Spanish banks and subsidiaries file tax returns in accordance with the tax legislation in force in each country.
19.2 Years open for review by the tax authorities
At the date of preparation of these financial statements, the BBVA consolidated tax group in Spain has 2017 and subsequent years subject to inspection, with respect to the main taxes applicable to it.
The remainder of the Spanish consolidated entities in general have the last four years open for inspection by the tax authorities for the main taxes applicable, except for those in which there has been an interruption of the limitation period due to the start of an inspection.
In relation to the consolidated tax group BBVA in Spain, in the year 2021, as a result of the inspection activities of the tax authorities, inspection reports have been issued for the years 2014 to 2016, and have been agreed upon, except for those corresponding to the year 2016 in relation to which a partial disagreement has been expressed. The reports that have been agreed upon have become final as of the date of preparation of these financial statements.
On the other hand, in relation to the main jurisdictions in which the Group is present and carries out its activity, in the case of Mexico, BBVA México S.A., is currently under inspection by the Mexican Tax Authorities for the years 2016 and 2017 corresponding to Corporate Income Tax and Value Added Tax.
In addition, in the case of Turkey, the head entity in this country, Garanti BBVA A.S., is currently under inspection by the Tax Authorities of that country for all the taxes applicable to it corresponding to the years 2017 and 2018.
The conclusion of the previous inspections did not have a material impact on the Consolidated Financial Statements as a whole.
In view of the varying interpretations that can be made of some applicable tax legislation, the outcome of the tax inspections of the open years that may be conducted by the tax authorities in the future may give rise to contingent tax liabilities which cannot be reasonably estimated at the present time. However, the Group considers that the possibility of these contingent liabilities becoming actual liabilities is remote and, in any case, the tax charge which might arise therefore would not materially affect the Group’s accompanying consolidated financial statements.
19.3 Reconciliation
The reconciliation of the Group’s corporate income tax expense resulting from the application of the Spanish corporation income tax rate and the income tax expense recognized in the accompanying consolidated income statements is as follows:
Reconciliation of taxation at the Spanish corporation tax rate to the tax expense recorded for the year (Millions of Euros)
| 2021 | 2020 | 2019 | ||||
|---|---|---|---|---|---|---|
| Amount | Effective tax % | Amount | Effective tax % | Amount | Effective tax % | |
| Profit or (-) loss before tax | 8,399 | 3,576 | 6,398 | |||
| From continuing operations | 7,247 | 5,248 | 7,046 | |||
| From discontinued operations | 1,152 | (1,672) | (648) | |||
| Taxation at Spanish corporation tax rate 30% | 2,519 | 1,073 | 1,920 | |||
| Lower effective tax rate from foreign entities (*) | (332) | (181) | (381) | |||
| Mexico | (109) | 27% | (32) | 29% | (112) | 27% |
| Chile | (5) | 22% | (2) | 23% | (2) | 27% |
| Colombia | - | 30% | 3 | 31% | 6 | 32% |
| Peru | 5 | 31% | (7) | 28% | (12) | 28% |
| Turkey | (125) | 23% | (73) | 25% | (86) | 23% |
| USA | (62) | 19% | (75) | 16% | (97) | 17% |
| Others | (36) | 5 | (78) | |||
| Revenues with lower tax rate (dividends/capital gains) | (30) | (49) | (49) | |||
| Equity accounted earnings | - | 12 | 18 | |||
| USA Sale effect | 544 | - | - | |||
| Other effects (**) | 80 | 661 | 545 | |||
| Income tax | 2,781 | 1,516 | 2,053 | |||
| Of which: Continuing operations | 1,909 | 1,459 | 1,943 | |||
| Of which: Discontinued operations | 872 | 57 | 110 | |||
- (*) Calculated by applying the difference between the tax rate in force in Spain and the one applied to the Group’s earnings in each jurisdiction.
- (**) In 2020 and 2019, related mainly to the impact of the goodwill impairment of the United States' CGU that amounted to €2,084 and €1,318 million respectively. These impacts did not have associated any Corporate Income Tax (CIT) expense credit (once the 30% tax rate is applied, the effect amounted to €625 and €395 million, respectively).
The effective income tax rate for the Group in the years ended December 31, 2021, 2020 and 2019 is as follows:
Effective tax rate (Millions of Euros)
| 2021 | 2020 | 2019 | |
|---|---|---|---|
| Income from: | |||
| Consolidated tax group in Spain | 655 | 259 | (718) |
| Other Spanish entities | 5 | 7 | 7 |
| Foreign entities | 6,587 | 4,982 | 7,757 |
| Gains (losses) before taxes from continuing operations | 7,247 | 5,248 | 7,046 |
| Tax expense or income related to profit or loss from continuing operations | 1,909 | 1,459 | 1,943 |
| Effective tax rate | 26.3% | 27.8% | 27.6% |
In the year 2021, the changes in the nominal tax rate, with respect to those existing in the previous year, in the main countries in which the Group is present, have been as follows: in Turkey (from 22% to 25%), in Argentina (from 30% to 35%) and in Colombia (from 36% to 34%). In 2020, in general terms, there were no changes in the nominal tax rate with respect to those existing in the previous period, except in the case of Colombia where the applicable tax rate was 36% compared to the 33% which was applicable as of the end of the previous year.
19.4 Income tax recognized in equity
In addition to the income tax expense recognized in the accompanying consolidated income statements, the Group has recognized the following income tax charges for these items in the consolidated total equity:
Tax recognized in total equity (Millions of Euros)
| 2021 | 2020 | 2019 | |
|---|---|---|---|
| Charges to total equity | |||
| Debt securities and others | (174) | (230) | (130) |
| Equity instruments | (33) | (43) | (40) |
| Total | (207) | (273) | (170) |
19.5 Current and deferred taxes
The balance under the heading "Tax assets" in the accompanying consolidated balance sheets includes current and deferred tax assets. The balance under the “Tax liabilities” heading includes the Group’s various current and deferred tax liabilities. The details of the mentioned tax assets and liabilities are as follows.
Tax assets and liabilities (Millions of Euros)
| 2021 | 2020 | 2019 | |
|---|---|---|---|
| Tax assets | |||
| Current tax assets | 932 | 1,199 | 1,765 |
| Deferred tax assets | 14,917 | 15,327 | 15,318 |
| Pensions | 416 | 439 | 456 |
| Financial Instruments | 1,408 | 1,292 | 1,386 |
| Loss allowances | 1,676 | 1,683 | 1,636 |
| Other | 1,101 | 1,069 | 1,045 |
| Secured tax assets | 9,304 | 9,361 | 9,363 |
| Tax losses | 1,012 | 1,483 | 1,432 |
| Total | 15,850 | 16,526 | 17,083 |
| Tax Liabilities | |||
| Current tax liabilities | 644 | 545 | 880 |
| Deferred tax liabilities | 1,769 | 1,809 | 1,928 |
| Financial Instruments | 1,124 | 908 | 1,014 |
| Other | 645 | 901 | 914 |
| Total | 2,423 | 2,355 | 2,808 |
The most significant variations of the deferred tax assets and liabilities in the years 2021, 2020 and 2019 were derived from the following items:
Deferred tax assets and liabilities. Annual variations (Millions of Euros)
| 2021 | 2020 | 2019 | ||||
|---|---|---|---|---|---|---|
| Deferred assets | Deferred liabilities | Deferred assets | Deferred liabilities | Deferred assets | Deferred liabilities | |
| Balance at the beginning | 15,327 | 1,809 | 15,318 | 1,928 | 15,316 | 2,046 |
| Pensions | (23) | - | (17) | - | 51 | - |
| Financials instruments | 116 | 216 | (94) | (106) | (15) | (122) |
| Loss allowances | (7) | - | 47 | - | 261 | - |
| Others | 32 | (256) | 24 | (13) | (247) | 4 |
| Guaranteed tax assets | (57) | - | (2) | - | - | - |
| Tax losses | (471) | - | 51 | - | (48) | - |
| Balance at the end | 14,917 | 1,769 | 15,327 | 1,809 | 15,318 | 1,928 |
With respect to the changes in deferred tax assets and liabilities in 2021 contained in the above table, the following should be pointed out:
- Guaranteed tax assets decrease because, in fiscal year 2021, the tax Group in Spain generated positive taxable income and, therefore, offsets guaranteed tax assets. However, the decrease has been partially offset by the increase in guaranteed tax assets that have been generated as a result of the closing of the inspection process for fiscal years 2014-2016.
- The decrease in tax assets due to tax losses occurred because, in 2021, the tax Group in Spain generated positive taxable income and, therefore, offsets tax loss carryforwards and deductions.
- The evolution of deferred tax assets (other than those guaranteed and those linked to tax losses) net of deferred tax liabilities is due to the effect of exchange rates, especially in the case of Mexico and Turkey, and the operation of corporate income tax, where the differences between accounting and taxation give rise to constant movements in deferred taxes.
On the deferred tax assets and liabilities contained in the table above, those included in section 19.4 above have been recognized against the entity's equity, and the rest against earnings for the year or reserves.
As of December 31, 2021, 2020 and 2019, the estimated amount of temporary differences associated with investments in subsidiaries, joint ventures and associates, which were not recognized as deferred tax liabilities in the accompanying consolidated balance sheets, amounted to €93, €106 and €473 million, respectively.
Of the deferred tax assets contained in the above table, the detail of the items and amounts guaranteed by the Spanish government, broken down by the items that originated those assets is as follows:
Secured tax assets (Millions of Euros)
| 2021 | 2020 | 2019 | |
|---|---|---|---|
| Pensions | 1,759 | 1,924 | 1,924 |
| Loss allowances | 7,545 | 7,437 | 7,439 |
| Total | 9,304 | 9,361 | 9,363 |
As of December 31, 2021, non-guaranteed net deferred tax assets of the above table amounted to €3,844 million (€4,156 and €4,027 million as of December 31, 2020 and 2019, respectively), which broken down by major geographies is as follows:
- Spain: Net deferred tax assets recognized in Spain totaled €2,342 million as of December 31, 2021 (€2,590 and €2,447 million as of December 31, 2020 and 2019, respectively). €1,010 million of the figure recorded in the year ended December 31, 2021 for net deferred tax assets related to tax credits and tax loss carry forwards and €1,332 million relate to temporary differences.
- Mexico: Net deferred tax assets recognized in Mexico amounted to €1,121 million as of December 31, 2021 (€1,036 and €1,083 million as of December 31, 2020 and 2019, respectively). Practically all of deferred tax assets as of December 31, 2021 relate to temporary differences.
- South America: Net deferred tax assets recognized in South America amounted to €65 million as of December 31, 2021 (€126 and €84 million as of December 31, 2020 and 2019, respectively). Practically all the deferred tax assets are related to temporary differences.
- Turkey: Net deferred tax assets recognized in Turkey amounted to €302 million as of December 31, 2021 (€395 and €278 million as of December 31, 2020 and 2019, respectively). All the deferred tax assets are related to temporary differences.
Based on the information available as of December 31, 2021, including historical levels of benefits and projected results available to the Group for the coming 15 years, the Group has carried out an analysis of its recovery of deferred tax assets and liabilities taking into account the impact of COVID-19 pandemic (see Note 1.5). It is considered that there is sufficient positive evidence, in excess of the negative evidence, that sufficient positive taxable income will be generated for the recovery of the aforementioned unsecured deferred tax assets when they become deductible in accordance with tax legislation.
On the other hand, the Group has not recognized certain negative tax bases and deductions for which, in general, there is no legal period for offsetting, amounting to approximately €2,037 million, which are mainly originated by Catalunya Banc.
20. Other assets and liabilities
The composition of the balance of these captions of the accompanying consolidated balance sheets is:
Other assets and liabilities (Millions of Euros)
| 2021 | 2020 | 2019 | |
|---|---|---|---|
| ASSETS | |||
| Inventories | 424 | 572 | 581 |
| Transactions in progress | 131 | 160 | 138 |
| Accruals | 730 | 756 | 804 |
| Other items | 649 | 1,025 | 2,277 |
| Total | 1,934 | 2,513 | 3,800 |
| LIABILITIES | |||
| Transactions in progress | 48 | 75 | 39 |
| Accruals | 2,137 | 1,584 | 2,456 |
| Other items | 1,436 | 1,144 | 1,247 |
| Total | 3,621 | 2,802 | 3,742 |
21. Non-current assets and disposal groups classified as held for sale and liabilities included in disposal groups classified as held for sale
The composition of the balances under the headings “Non-current assets and disposal groups classified as held for sale” and “liabilities included in disposal groups classified as held for sale” in the accompanying consolidated balance sheets, broken down by the origin of the assets, is as follows:
Non-current assets and disposal groups classified as held for sale and liabilities included in disposal groups classified as held for sale. Breakdown by items (Millions of Euros)
| 2021 | 2020 | 2019 | |
|---|---|---|---|
| ASSETS | |||
| Foreclosures and recoveries | 1,218 | 1,398 | 1,647 |
| Assets from tangible assets (*) | 563 | 480 | 310 |
| Companies held for sale (**) | 41 | 84,792 | 1,716 |
| Accrued amortization (***) | (112) | (89) | (51) |
| Impairment losses (*) | (650) | (594) | (543) |
| Total non-current assets and disposal groups classified as held for sale | 1,061 | 85,987 | 3,079 |
| LIABILITIES | |||
| Companies held for sale (**) | — | 75,446 | 1,554 |
| Total liabilities included in disposal groups classified as held for sale | — | 75,446 | 1,554 |
- (*) In 2021, it includes the reclassification of owned offices and facilities from "tangible assets" to "non-current assets and disposal groups classified as held for sale" and the adjustments due to the closing of the owned offices and the decommissioning of facilities after the agreement with the union representatives on the collective layoff procedure proposed for Banco Bilbao Vizcaya Argentaria, S.A. in Spain (see Notes 24 and 50).
- (**) It includes mainly BBVA’s stake in BBVA USA in 2020 and BBVA's stake in BBVA Paraguay in 2019 (see Note 3).
- (***) Corresponds to the accumulated depreciation of assets before their classification as "Non-current assets and disposal groups classified as held for sale".
Assets and liabilities from discontinued operations
As mentioned in Notes 1.3 and 3, in 2020 the agreement for the sale of the BBVA subsidiary in the United States was announced, which sale was completed on June 1, 2021. The assets and liabilities corresponding to the 37 companies sold were reclassified to the headings “Non-current assets and disposal groups classified as held for sale” and “Liabilities included in disposal groups classified as held for sale” of the consolidated balance sheet as of December 31, 2020, and the earnings from these companies for the first five months of 2021 and the earnings for the years ended December 31, 2020 and 2019 were classified under the heading "Profit (loss) after tax from discontinued operations" of the accompanying consolidated income statements (see Note 1.3).
The condensed consolidated balance sheets as of December 31, 2021, 2020 and 2019, and the condensed consolidated income statements and condensed consolidated statements of cash flow of the companies held for sale in the United States the first five months of 2021 and for the years 2020 and 2019 are provided below:
Condensed consolidated balance sheets of companies sold in the United States
CONDENSED CONSOLIDATED BALANCE SHEETS (Millions of euros)
| 2021 | 2020 | 2019 | |
|---|---|---|---|
| Cash, cash balances at central banks and other demand deposits | — | 11,368 | 5,678 |
| Financial assets held for trading | — | 821 | 513 |
| Non-trading financial assets mandatorily at fair value through profit or loss | — | 13 | 18 |
| Financial assets at fair value through other comprehensive income | — | 4,974 | 6,834 |
| Financial assets at amortized cost | — | 61,558 | 62,860 |
| Derivatives - Hedge accounting | — | 9 | 10 |
| Tangible assets | — | 799 | 900 |
| Intangible assets | — | 1,949 | 4,183 |
| Tax assets | — | 360 | 263 |
| Other assets | — | 1,390 | 1,463 |
| Non-current assets and disposal groups classified as held for sale | — | 16 | 31 |
| TOTAL ASSETS | — | 83,257 | 82,751 |
| Financial liabilities held for trading | — | 98 | 94 |
| Financial liabilities at amortized cost | — | 73,132 | 70,438 |
| Derivatives - Hedge accounting | — | 2 | 11 |
| Provisions | — | 157 | 186 |
| Tax liabilities | — | 201 | 87 |
| Other liabilities | — | 492 | 464 |
| TOTAL LIABILITIES | — | 74,082 | 71,279 |
| Actuarial gains (losses) on defined benefit pension plans | — | (66) | (80) |
| Hedge of net investments in foreign operations (effective portion) | — | (432) | (432) |
| Foreign currency translation | — | 801 | 1,576 |
| Hedging derivatives, Cash flow hedges (effective portion) | — | 250 | 81 |
| Fair value changes of debt instruments measured at fair value through other comprehensive income | — | 70 | (11) |
| ACCUMULATED OTHER COMPREHENSIVE INCOME (LOSS) | — | 622 | 1,134 |
Condensed consolidated income statements of companies sold in the United States
CONDENSED CONSOLIDATED INCOME STATEMENTS (Millions of Euros)
| 2021 (*) | 2020 | 2019 | |
|---|---|---|---|
| Interest and other income | 974 | 2,638 | 3,221 |
| Interest expense | (53) | (429) | (887) |
| NET INTEREST INCOME | 921 | 2,209 | 2,335 |
| Dividend income | 2 | 4 | 10 |
| Fee and commission income | 285 | 677 | 736 |
| Fee and commission expense | (86) | (183) | (205) |
| Gains (losses) on derecognition of financial assets and liabilities not measured at fair value through profit or loss, net | (4) | 19 | 54 |
| Gains (losses) on financial assets and liabilities held for trading, net | 26 | 90 | 30 |
| Gains (losses) on non-trading financial assets mandatorily at fair value through profit or loss, net | 2 | 8 | — |
| Gains (losses) on financial assets and liabilities designated at fair value through profit or loss, net | 2 | 5 | 3 |
| Gains (losses) from hedge accounting, net | (1) | 4 | 4 |
| Exchange differences, net | 5 | 19 | 5 |
| Other operating income | 9 | 19 | 32 |
| Other operating expense | (30) | (63) | (64) |
| GROSS INCOME | 1,132 | 2,808 | 2,941 |
| Administration costs | (661) | (1,462) | (1,534) |
| Depreciation and amortization | (80) | (205) | (214) |
| Provisions or reversal of provisions | 4 | 2 | (3) |
| Impairment or reversal of impairment on financial assets not measured at fair value through profit or loss or net gains by modification | (66) | (729) | (521) |
| NET OPERATING INCOME | 330 | 413 | 670 |
| Impairment or reversal of impairment on non-financial assets | — | (2,084) | (1,318) |
| Gains (losses) on derecognition of non-financial assets and subsidiaries, net | (2) | (3) | 2 |
| Gains (losses) from non-current assets and disposal groups classified as held for sale not qualifying as discontinued operations | 3 | 2 | (2) |
| PROFIT (LOSS) BEFORE TAX | 330 | (1,671) | (648) |
| Tax expense or income related to profit or loss from continuing operations | (80) | (57) | (110) |
| PROFIT (LOSS) AFTER TAX | 250 | (1,729) | (758) |
| Profit (loss) after tax from the sale | 29 | — | — |
| PROFIT (LOSS) FOR THE PERIOD | 280 | (1,729) | (758) |
| ATTRIBUTABLE TO MINORITY INTEREST (NON-CONTROLLING INTEREST) | - | - | - |
| ATTRIBUTABLE TO OWNERS OF THE PARENT (**) | 280 | (1,729) | (758) |
- (*) Corresponds to the first five months of 2021 (See Notes 1.3 and 3).
- (**) Cumulative profit net of taxes earned and recognized by BBVA Group in relation to the sale of BBVA USA Bancshares has been €582 million, corresponding to the results generated by the entities within the scope of the sale agreement from the date of the agreement to the closing date of the agreement, plus the profit after tax on the sale as of the closing.
Condensed consolidated statements of cash flows of companies sold in the United States
CONDENSED STATEMENTS OF CASH FLOWS (Millions of Euros)
| 2021 (*) | 2020 | 2019 | |
|---|---|---|---|
| A) CASH FLOWS FROM OPERATING ACTIVITIES | 62 | 6,874 | 3,888 |
| B) CASH FLOWS FROM INVESTING ACTIVITIES | (34) | (145) | (133) |
| C) CASH FLOWS FROM FINANCING ACTIVITIES | (26) | (65) | (468) |
| D) EFFECT OF EXCHANGE RATE CHANGES | 60 | (974) | 65 |
| INCREASE (DECREASE) NET CASH AND CASH EQUIVALENTS (A+B+C+D) | 62 | 5,690 | 3,352 |
- (*) Corresponds to the first five months of 2021 (See Notes 1.3 and 3).
Effects of disposal on the financial position of the Group
EFFECT OF DISPOSAL ON THE FINANCIAL POSITION OF THE GROUP (Millions of Euros)
| June 2021 |
|
|---|---|
| Cash, cash balances at central banks and other demand deposits | (11,476) |
| Financial assets held for trading | (638) |
| Non-trading financial assets mandatorily at fair value through profit or loss | (15) |
| Financial assets at fair value through other comprehensive income | (4,620) |
| Financial assets at amortized cost | (61,440) |
| Derivatives - Hedge accounting | (8) |
| Tangible assets | (788) |
| Intangible assets | (1,938) |
| Tax assets | (349) |
| Other assets | (1,439) |
| Non-current assets and disposal groups classified as held for sale | (10) |
| Total assets | (82,720) |
| Financial liabilities held for trading | 129 |
| Financial liabilities at amortized cost | 72,357 |
| Provisions | 156 |
| Tax liabilities | 207 |
| Other liabilities | 491 |
| Total liabilities | 73,341 |
| Total net assets/liabilities | (9,378) |
EFFECT ON NET CASH OUTFLOWS FROM DISCONTINUED OPERATIONS - USA (Millions of Euros)
| June 2021 |
|
|---|---|
| Consideration received satisfied in cash | 9,512 |
| Cash and cash equivalents disposed of | (11,476) |
| Total net cash outflows from discontinued operations - USA | (1,964) |
EFFECT OF THE MOST SIGNIFICANT SALES OF NON-CURRENT ASSETS HELD FOR SALE OF THE BBVA GROUP REFLECTED IN THE CONSOLIDATED STATEMENT OF CASH FLOWS (Millions of Euros)
| December 2021 |
|
|---|---|
| Consideration received satisfied in cash - USA | 9,512 |
| Consideration received satisfied in cash - Divarian | 513 |
| Consideration received satisfied in cash - Paraguay | 210 |
| Other collections from non-current assets and liabilities for sale | 435 |
| Total cash received from non-current assets and liabilities for sale | 10,670 |
Non-current assets and disposal groups classified as held for sale
The changes in the balances of “Non-current assets and disposal groups classified as held for sale” in 2021, 2020 and 2019, are as follows:
Non-current assets and disposal groups classified as held for sale (Millions of Euros)
| Notes | Foreclosed assets | Property, Plant and Equipment (*) | Companies held for sale (**) | Total | |||||||||
|---|---|---|---|---|---|---|---|---|---|---|---|---|---|
| Cost (1) | 2021 | 2020 | 2019 | 2021 | 2020 | 2019 | 2021 | 2020 | 2019 | 2021 | 2020 | 2019 | |
| Balance at the beginning | 1,398 | 1,648 | 2,211 | 391 | 258 | 389 | 84,792 | 1,716 | 29 | 86,581 | 3,622 | 2,629 | |
| Additions | 245 | 285 | 665 | — | — | 10 | 522 | 83,266 | 1,676 | 768 | 83,551 | 2,351 | |
| Contributions from merger transactions | — | — | 2 | — | — | — | — | — | — | — | — | 2 | |
| Retirements (sales and other decreases) | (298) | (288) | (1,023) | (39) | (45) | (206) | (83,172) | (190) | — | (83,509) | (523) | (1,229) | |
| Transfers, other movements and exchange differences (**) | (127) | (228) | (207) | 100 | 180 | 65 | (2,100) | — | 11 | (2,128) | (48) | (131) | |
| Disposals by companies held for sale | — | 19 | — | — | (2) | — | — | — | (21) | — | |||
| Balance at the end | 1,218 | 1,398 | 1,648 | 452 | 391 | 258 | 41 | 84,792 | 1,716 | 1,711 | 86,581 | 3,622 | |
| Impairment (2) | |||||||||||||
| Balance at the beginning | 386 | 411 | 504 | 208 | 132 | 124 | — | — | — | 594 | 543 | 628 | |
| Additions | 50 | 36 | 74 | 67 | 62 | 29 | 5 | — | — | — | 97 | 103 | 72 |
| Additions transfer to discontinued operations | — | — | 5 | — | — | — | — | — | — | — | — | 5 | |
| Contributions from merger transactions | — | — | — | — | — | — | — | — | — | — | — | — | |
| Retirements (sales and other decreases) | (65) | (56) | (164) | (13) | (13) | (22) | — | — | — | (78) | (69) | (186) | |
| Other movements and exchange differences | 24 | (42) | (1) | 12 | 60 | 25 | — | — | — | 36 | 18 | 24 | |
| Disposals by companies held for sale | (1) | — | — | — | — | — | — | (1) | |||||
| Balance at the end | 381 | 386 | 411 | 269 | 208 | 132 | — | — | — | 650 | 594 | 543 | |
| Balance at the end of net carrying value (1)-(2) | 837 | 1,012 | 1,237 | 183 | 183 | 126 | 41 | 84,792 | 1,716 | 1,061 | 85,987 | 3,079 | |
- (*) Net of accumulated amortization until assets were reclassified as “Non-current assets and disposal groups classified as held for sale”.
- (**) In 2020, the variation corresponds mainly to the USA Sale agreement of BBVA USA and in 2019 to the BBVA's stake in BBVA Paraguay (see Note 3).
As indicated in Note 2.2.4, “Non-current assets and disposal groups held for sale” and “Liabilities included in disposal groups classified as held for sale” are valued at the lower amount between its fair value less costs to sell and its carrying amount. As of December 31, 2021, 2020 and 2019 practically all of the carrying amount of the assets recorded at fair value on a non-recurring basis equals their fair value.
Assets from foreclosures or recoveries
As of December 31, 2021, 2020 and 2019, assets from foreclosures and recoveries, net of impairment losses, by nature of the asset, amounted to €608, €747 and €871 million in assets for residential use; €202, €215 and €259 million in assets for tertiary use (industrial, commercial or office) and €19, €21 and €28 million in assets for agricultural use, respectively.
As of December 31, 2021, 2020 and 2019, the average sale time of assets from foreclosures or recoveries was between 2 and 3 years.
During the years 2021, 2020 and 2019, some of the sale transactions for these assets were financed by Group companies. The amount of loans granted to the buyers of these assets in those years amounted to €62, €78 and €79 million, respectively; with an average financing of 33.7% of the sales price during 2021.
As of December 31, 2021, 2020 and 2019, the amount of the profits arising from the sale of assets financed by Group companies that are not recognized in the consolidated income statement amounted to €1 million.
22. Financial liabilities at amortized cost
22.1 Breakdown of the balance
The breakdown of the balance under these headings in the accompanying consolidated balance sheets is as follows:
Financial liabilities measured at amortized cost (Millions of Euros)
| 2021 | 2020 | 2019 | |
|---|---|---|---|
| Deposits | 416,947 | 415,467 | 438,919 |
| Deposits from central banks | 47,351 | 45,177 | 25,950 |
| Demand deposits | 8 | 163 | 23 |
| Time deposits and other | 41,790 | 38,274 | 25,101 |
| Repurchase agreements | 5,553 | 6,740 | 826 |
| Deposits from credit institutions | 19,834 | 27,629 | 28,751 |
| Demand deposits | 7,601 | 7,196 | 7,161 |
| Time deposits and other (**) | 8,599 | 16,079 | 18,896 |
| Repurchase agreements | 3,634 | 4,354 | 2,693 |
| Customer deposits (*) | 349,761 | 342,661 | 384,219 |
| Demand deposits | 293,015 | 266,250 | 280,391 |
| Time deposits and other (**) | 55,479 | 75,666 | 103,293 |
| Repurchase agreements | 1,267 | 746 | 535 |
| Debt certificates | 55,763 | 61,780 | 63,963 |
| Other financial liabilities | 15,183 | 13,358 | 13,758 |
| Total | 487,893 | 490,606 | 516,641 |
- (*) Variation in 2020 is mainly due to the companies in the United States included in the USA Sale (see Notes 1.3, 3 and 21).
- (**) The variation in 2021 is mainly due to the decrease in time deposits at Banco Bilbao Vizcaya Argentaria, S.A. offset by the increase in demand deposits and investment funds (off-balance) due to the current interest rate environment.
The amount recorded in "Deposits from central banks - Time deposits" includes the provisions of the TLTRO III facilities of the European Central Bank, mainly BBVA S.A. amounting to €38,692 and €35,032 million as of December 31, 2021 and 2020 respectively which basically explains the change compared to the previous year 2019 (see Note 7.5).
On April 30, 2020, the European Central Bank modified some of the terms and conditions of the TLTRO III facilities in order to support the continued access of companies and households to bank credit in the face of interruptions and temporary shortages of funds associated with the COVID-19 pandemic. Entities whose eligible net lending exceeded 0% between March 1, 2020 and March 31, 2021 paid an interest rate 0.5% lower than the average rate of the deposit facilities during the period from June 24, 2020 to June 23, 2021.
On December 10, 2020, the European Central Bank extended the support via targeted lending operations (TLTRO), extending by twelve additional months, until June 2022, the period of application of favorable interest rates to credit institutions for which the net variation of their eligible loans, between October 1, 2020 and December 31, 2021, reaches a given lending performance threshold. Additionally, the maximum borrowing amount was increased to 55% of the eligible loans (from 50% previously).This means that the interest rate applicable to the outstanding operations is -1% provided that the lending objectives are met according to the conditions of the European Central Bank.
As of December 31, 2021, the Group fulfilled these lending objectives. Therefore, the recognition of the favorable interest rate associated with the COVID-19 pandemic has been recognized for the period from June 24, 2020 to December 31, 2021 and will continue to be recognized until June 2022.
The positive remuneration currently being generated by the TLTRO III operations is recorded under the heading of "Interest and other income – other income" in the consolidated income statements and amounts to €384 and €211 million for the years ended December 31, 2021 and 2020 respectively (See Note 37.1).
22.2 Deposits from credit institutions
The breakdown by geographical area and the nature of the related instruments of this heading in the accompanying consolidated balance sheets is as follows:
Deposits from credit institutions (Millions of Euros)
| Demand deposits | Time deposits and other (*) | Repurchase agreements | Total | |
|---|---|---|---|---|
| December 2021 | ||||
| Spain | 1,671 | 375 | — | 2,047 |
| Mexico | 444 | 558 | — | 1,002 |
| Turkey | 83 | 672 | 37 | 792 |
| South America | 532 | 1,225 | — | 1,757 |
| Rest of Europe | 1,841 | 3,110 | 2,549 | 7,500 |
| Rest of the world | 3,030 | 2,657 | 1,048 | 6,736 |
| Total | 7,601 | 8,599 | 3,634 | 19,834 |
| December 2020 | ||||
| Spain | 345 | 1,405 | 1 | 1,751 |
| Mexico | 689 | 672 | 188 | 1,549 |
| Turkey | 8 | 580 | 28 | 617 |
| South America | 557 | 1,484 | — | 2,041 |
| Rest of Europe | 2,842 | 4,531 | 4,070 | 11,444 |
| Rest of the world | 2,755 | 7,406 | 67 | 10,228 |
| Total | 7,196 | 16,079 | 4,354 | 27,629 |
| December 2019 | ||||
| Spain | 2,104 | 1,113 | 1 | 3,218 |
| The United States | 2,082 | 4,295 | — | 6,377 |
| Mexico | 432 | 1,033 | 168 | 1,634 |
| Turkey | 302 | 617 | 4 | 924 |
| South America | 394 | 2,285 | 161 | 2,840 |
| Rest of Europe | 1,652 | 5,180 | 2,358 | 9,190 |
| Rest of the world | 194 | 4,374 | — | 4,568 |
| Total | 7,161 | 18,896 | 2,693 | 28,751 |
- (*) Subordinated deposits are included amounting to €14, €12 and €195 million as of December 31, 2021, 2020 and 2019, respectively
22.3 Customer deposits
The breakdown by geographical area of this heading in the accompanying consolidated balance sheets, by type of instrument is as follows:
Customer deposits (Millions of Euros)
| Demand deposits | Time deposits and other | Repurchase agreements | Total | |
|---|---|---|---|---|
| December 2021 | ||||
| Spain | 181,565 | 10,407 | 2 | 191,974 |
| Mexico | 53,359 | 10,383 | 505 | 64,247 |
| Turkey | 19,725 | 13,644 | 6 | 33,376 |
| South America | 28,039 | 9,822 | — | 37,861 |
| Rest of Europe | 8,933 | 9,546 | 754 | 19,234 |
| Rest of the world | 1,393 | 1,677 | — | 3,070 |
| Total | 293,015 | 55,479 | 1,267 | 349,761 |
| December 2020 | ||||
| Spain | 168,690 | 20,065 | 2 | 188,757 |
| Mexico | 43,768 | 10,514 | 117 | 54,398 |
| Turkey | 17,906 | 16,707 | 8 | 34,621 |
| South America | 25,730 | 11,259 | — | 36,989 |
| Rest of Europe | 8,435 | 12,373 | 619 | 21,427 |
| Rest of the world | 1,720 | 4,748 | — | 6,468 |
| Total | 266,250 | 75,666 | 746 | 342,661 |
| December 2019 | ||||
| Spain | 146,651 | 24,958 | 2 | 171,611 |
| The United States | 46,372 | 19,810 | — | 66,181 |
| Mexico | 43,326 | 12,714 | 523 | 56,564 |
| Turkey | 13,775 | 22,257 | 10 | 36,042 |
| South America | 22,748 | 13,913 | — | 36,661 |
| Rest of Europe | 6,610 | 8,749 | — | 15,360 |
| Rest of the world | 909 | 892 | — | 1,801 |
| Total | 280,391 | 103,293 | 535 | 384,219 |
- (*) It includes subordinated deposits amounting to €189 million as of December 31, 2019.
22.4 Debt certificates
The breakdown of the balance under this heading, by financial instruments and by currency, is as follows:
Debt certificates (Millions of Euros)
| 2021 | 2020 | 2019 | |
|---|---|---|---|
| In Euros | 36,289 | 42,462 | 40,185 |
| Promissory bills and notes | 319 | 860 | 737 |
| Non-convertible bonds and debentures | 15,712 | 14,538 | 12,248 |
| Covered bonds (*) | 9,930 | 13,274 | 15,542 |
| Hybrid financial instruments (**) | 366 | 355 | 518 |
| Securitization bonds | 2,302 | 2,538 | 1,354 |
| Wholesale funding | 438 | 2,331 | 1,817 |
| Subordinated liabilities | 7,221 | 8,566 | 7,968 |
| Convertible perpetual certificates | 3,500 | 4,500 | 5,000 |
| Non-convertible preferred stock | - | 159 | 83 |
| Other non-convertible subordinated liabilities | 3,721 | 3,907 | 2,885 |
| In foreign currencies | 19,475 | 19,318 | 23,778 |
| Promissory bills and notes | 579 | 1,024 | 1,210 |
| Non-convertible bonds and debentures | 7,885 | 8,691 | 10,587 |
| Covered bonds (*) | 178 | 217 | 362 |
| Hybrid financial instruments (**) | 2,843 | 455 | 1,156 |
| Securitization bonds | 4 | 4 | 17 |
| Wholesale funding | 412 | 1,016 | 780 |
| Subordinated liabilities | 7,574 | 7,911 | 9,666 |
| Convertible perpetual certificates | 1,771 | 1,633 | 1,782 |
| Non-convertible preferred stock | - | 35 | 76 |
| Other non-convertible subordinated liabilities | 5,803 | 6,243 | 7,808 |
| Total | 55,763 | 61,780 | 63,963 |
- (*) Including mortgage-covered bonds (see Appendix X). In 2021 and 2020, several mortgage-covered bonds reached their maturity date
- (**) Corresponds to structured note issuances whose underlying risk is different from the underlying risk of the derivative.
22.4.1 Subordinated liabilities
The breakdown of this heading in the accompanying consolidated balance sheets is as follows:
Memorandum item: Subordinated liabilities at amortized cost (Millions of Euros)
| 2021 | 2020 | 2019 | |
|---|---|---|---|
| Subordinated deposits | 14 | 12 | 384 |
| Subordinated certificates | 14,794 | 16,476 | 17,635 |
| Preferred stock | - | 194 | 159 |
| Compound convertible financial instruments | 5,271 | 6,133 | 6,782 |
| Other non-convertible subordinated liabilities | 9,523 | 10,149 | 10,693 |
| Total | 14,808 | 16,488 | 18,018 |
The balance variances are mainly due to the following transactions:
Convertible perpetual liabilities
The AGM held on March 17, 2017, resolved, under agenda item five, to confer authority to the Board of Directors to issue securities convertible into newly issued BBVA shares, on one or several occasions, within the maximum term of five years to be counted from the approval date of the authorization, up to a maximum overall amount of €8 billion or its equivalent in any other currency. Likewise, the AGM resolved to confer to the Board of Directors the authority to totally or partially exclude shareholders' pre-emptive subscription rights within the framework of a specific issue of convertible securities, although this power was limited to ensure the nominal amount of the capital increases resolved or effectively carried out for conversion of mandatory convertible issuances made under this authority (without prejudice to anti-dilution adjustments), with exclusion of pre-emptive subscription rights and of those likewise resolved or carried out with exclusion of pre-emptive subscription rights in use of the authority to increase the share capital conferred by the AGM held on March 17, 2017, under agenda item four, do not exceed the maximum nominal amount, overall, of 20% of the share capital of BBVA at the time of the authorization, this limit not being applicable to contingent convertible issues.
Under that delegation, BBVA made the following contingently convertible issuances that qualify as additional tier 1 capital of the Bank and the Group in accordance with Regulation (EU) 575/2013:
- In May and November 2017, BBVA carried out two issues of perpetual contingent convertible securities (additional Tier 1 capital instruments) excluding shareholders' pre-emptive rights, for a nominal amount of 500 million euros and 1,000 million U.S. dollars, respectively. These issues are listed on the Global Exchange Market of Euronext Dublin of the Irish Stock Exchange and were directed only to qualified investors and foreign private banking clients, and cannot be placed or subscribed in Spain or among investors resident in Spain.
- In September 2018 and March 2019, BBVA carried out both issuances of perpetual contingent convertible securities (additional tier 1 instruments), with exclusion of pre-emptive subscription rights of shareholders, for a total nominal amount of €1 billion each. These issuances are listed in the AIAF Fixed Income Securities Market and were targeted only at professional clients and eligible counterparties, not being offered or sold to any retail clients.
- On September 5, 2019, BBVA carried out an issuance of perpetual contingent convertible securities (additional tier 1 instruments), with exclusion of pre-emptive subscription rights of shareholders, for a total nominal amount of $1 billion. This issuance is listed in the Global Exchange Market of Euronext Dublin and was targeted only at qualified investors, not being offered to, and not being subscribed for, in Spain or by Spanish residents
- On July 15, 2020, BBVA carried out an issuance of perpetual contingent convertible securities (additional tier 1 instruments), with exclusion of pre-emptive subscription rights of shareholders, for a total nominal amount of €1 billion. This issuance is listed in the AIAF Fixed Income Securities Market and was targeted only at professional clients and eligible counterparties, not being offered or sold to any retail clients.
These perpetual securities will be converted into newly issued ordinary shares of BBVA if the CET 1 ratio of the Bank or the Group is less than 5.125%, in accordance with their respective terms and conditions.
These issuances may be fully redeemed at BBVA's option only in the cases contemplated in their respective terms and conditions and, in any case, in accordance with the provisions of the applicable legislation. In particular:
- On February 19, 2019 the Bank early redeemed the issuance of contingently convertible preferred securities (additional tier 1 instruments), carried out by the Bank on February 19, 2014, for a total amount of €1.5 billion and once the prior consent from the Regulator had been obtained. On February 19, 2019 the Bank early redeemed the issuance of contingently convertible preferred securities (additional tier 1 instruments), carried out by the Bank on February 19, 2014, for a total amount of €1.5 billion and once the prior consent from the Regulator had been obtained.
- On February 18, 2020, the Bank early redeemed the issuance of contingently convertible preferred securities (additional tier 1 instruments) carried out by the Bank on February 18, 2015, for an amount of €1.5 billion on the First Reset Date of the issuance and once the prior consent from the Regulator had been obtained.
- On 14 April 2021, the Bank early redeemed the issuance of contingently convertible preferred securities (additional tier 1 instruments) carried out by the Bank on 14 April 2016, for an amount of €1.0 billion on the First Reset Date of the issuance and once the prior consent from the Regulator had been obtained.
In addition, the AGM held on April 20, 2021, resolved, under agenda item five, to confer authority to the Board of Directors to issue perpetual contingent convertible securities, envisaged to meet regulatory requirements for their eligibility as capital instruments, pursuant to solvency regulations applicable at any time (CoCos), subject to the legal and statutory provisions applicable at any time, on one or several occasions, within the maximum term of five years to be counted from the approval date of the authorization, up to a maximum overall amount of €8 billion or its equivalent in any other currency. Likewise, the AGM resolved to confer to the Board of Directors the authority to totally or partially exclude shareholders' pre-emptive subscription rights, complying at all times with the requirements and limitations laid down by Law. The AGM also resolved to repeal the powers it conferred on March 17, 2017, under agenda item five.
Preferred securities
The breakdown by issuer of the balance under this heading in the accompanying consolidated balance sheets is as follows:
Preferred securities by issuer (Millions of Euros)
| 2021 | 2020 | 2019 | |
|---|---|---|---|
| BBVA International Preferred, S.A.U. | - | 35 | 37 |
| Unnim Group (*) | - | 159 | 83 |
| BBVA USA | - | - | 19 |
| BBVA Colombia | - | - | 20 |
| Total | - | 194 | 159 |
- (*)Unnim Group: Issuances prior to the acquisition by BBVA.
These issuances were fully subscribed at the moment of the issue by qualified/institutional investors outside the Group and are redeemable, totally or partially, at the issuer’s option after five years from the issue date, depending on the terms of each issuance and with the prior consent from the Bank of Spain or the relevant authority.
In connection with the above, once the necessary authorization from the European Central Bank was received and in conformity with its authority to redeem:
- The Extraordinary and Universal General Meeting of Caixasabadell Preferents, S.A. Unipersonal, at its meeting held on December 11, 2020, decided to delegate on the company's Board of Directors the authority to agree on the total early redemption of its only outstanding issuance, subject to the applicable legal provisions and having previously obtained all necessary authorizations. In use of such delegation, having satisfied all legal and contractual formalities required and having obtained all relevant authorizations, the company's Board of Directors, on the same date, agreed to carry out the early redemption of the total nominal amount of the issuance on January 14, 2021. As a result, once all necessary communications were released, on January 14, 2021 the total early redemption of the issuance took place
- The Extraordinary and Universal General Meeting of BBVA International Preferred, S.A. Unipersonal, at its meeting held on December 11, 2020, decided to delegate on the company's Board of Directors the authority to agree on the total early redemption of its only outstanding issuance, subject to the applicable legal provisions and having previously obtained all necessary authorizations. In use of such delegation, having satisfied all legal and contractual formalities required and having obtained all relevant authorizations, the company's Board of Directors, on the same date, agreed to carry out the early redemption of the total nominal amount of the issuance on January 19, 2021. As a result, once all necessary communications were released, on January 19, 2021 the total early redemption of the issuance took place.
- The Extraordinary and Universal General Meeting of Caixa Terrassa Societat de Participacions Preferents, S.A. Unipersonal, at its meeting held on December 11, 2020, decided to delegate on the company's Board of Directors the implementation of all necessary actions in order to modify its only live issuance so as to include a new clause regarding the early redemption of the preferred securities. In use of the delegated authority and having obtained all necessary authorizations, the company's Board of Directors, on the same date, agreed to modify the relevant issuance in order to include a new clause for the total early redemption of the preferred securities on January 29, 2021, therefore convening the relevant meeting of noteholders of the issuance to be held in Bilbao, on January 14, 2021, at first call, or on January 15, 2021, at second call. Having satisfied all applicable legal requirements, the noteholders' meeting was held at first call and passed, with the necessary majority of votes, among other resolutions, the inclusion of a new total early redemption clause. As a result, on January 29, 2021 the total early redemption of the issuance took place.
22.5 Other financial liabilities
The breakdown of the balance under this heading in the accompanying consolidated balance sheets is as follows:
Other financial liabilities (Millions of Euros):
| 2021 | 2020 | 2019 | |
|---|---|---|---|
| Lease liabilities | 2,560 | 2,674 | 3,335 |
| Creditors for other financial liabilities | 2,657 | 2,408 | 2,623 |
| Collection accounts | 3,839 | 3,275 | 3,306 |
| Creditors for other payment obligations (*) | 6,127 | 5,000 | 4,494 |
| Total | 15,183 | 13,358 | 13,758 |
- (*) ) In 2021, this heading includes the amount committed for the acquisition of treasury shares under the buyback program (see Notes 2.2.14 and 4).
A breakdown of the maturity of the lease liabilities, due after December 31, 2021 is provided below:
Maturity of future payment obligations (Millions of Euros)
| Up to 1 year | 1 to 3 years | 3 to 5 years | Over 5 years | Total | |
|---|---|---|---|---|---|
| Leases | 218 | 406 | 428 | 1,507 | 2,560 |
23. Assets and liabilities under insurance and reinsurance contracts
The Group has insurance subsidiaries mainly in Spain and Latin America (mostly in Mexico). The main product offered by the insurance subsidiaries is life insurance to cover the risk of death (risk insurance) and life-savings insurance. Within life and accident insurance, a distinction is made between freely sold products and those offered to customers who have taken mortgage or consumer loans, which cover the principal of those loans in the event of the customer’s death.
There are two types of savings products: individual insurance, which seeks to provide the customer with savings for retirement or other events, and group insurance, which is taken out by employers to cover their commitments to their employees.
The insurance business is affected by different risks, including those that are related to the BBVA Group such as credit risk, market risk, liquidity risk and operational risk and the methodology for risk measurement, control and follow-up applied in the insurance activity is similar (see Note 7 and Management Report - Risk), although it has a differentiated management due to the particular characteristics of the insurance business, such as the coverage of contracted obligations and the long term of the commitments.
Additionally, the insurance business generates certain specific risks, of a probabilistic nature:
- Technical risk: arises from deviations in the estimation of the casualty rate of insurances, either in terms of numbers, the amount of such claims and the timing of its occurrence.
- Biometric risk: depending on the deviations in the expected mortality behavior or the survival of the insured persons.
The insurance industry is highly regulated in each country. In this regard, it should be noted that the insurance industry is undergoing a gradual regulatory transformation through new risk-based capital regulations, which have already been published in several countries.
The heading “Assets under reinsurance and insurance contracts” in the accompanying consolidated balance sheets includes the amounts that the consolidated insurance entities are entitled to receive under the reinsurance contracts entered into by them with third parties and, more specifically, the share of the reinsurer in the technical provisions recognized by the consolidated insurance subsidiaries. As of December 31, 2021, 2020 and 2019, the balance under this heading amounted to €269 million, €306 million and €341 million, respectively.
The most significant provisions recognized by consolidated insurance subsidiaries with respect to insurance policies issued by them are under the heading “Liabilities under insurance and reinsurance contracts” in the accompanying consolidated balance sheets.
The breakdown of the balance under this heading is as follows:
Technical reserves (Millions of Euros)
| 2021 | 2020 | 2019 | |
|---|---|---|---|
| Mathematical reserves | 9,495 | 8,731 | 9,247 |
| Individual life insurance (*) | 7,265 | 6,268 | 6,731 |
| Group insurance (**) | 2,230 | 2,463 | 2,517 |
| Provision for unpaid claims reported | 706 | 672 | 641 |
| Provisions for unexpired risks and other provisions | 664 | 548 | 718 |
| Total | 10,865 | 9,951 | 10,606 |
- (*) Provides coverage in the event of death, disability and / or serious illness.
- (**) The insurance policies purchased by employers (other than BBVA Group) on behalf of its employees.
The cash flows of those “Liabilities under insurance and reinsurance contracts” are shown below:
Maturity (Millions of Euros). Liabilities under insurance and reinsurance contracts
| Up to 1 year | 1 to 3 years | 3 to 5 years | Over 5 years | Total | |
|---|---|---|---|---|---|
| 2021 | 1,808 | 290 | 1,664 | 7,103 | 10,865 |
| 2020 | 1,227 | 950 | 1,616 | 6,158 | 9,951 |
| 2019 | 1,571 | 1,197 | 1,806 | 6,032 | 10,606 |
The modeling methods and techniques used to calculate the mathematical reserves for the insurance products are actuarial and financial methods and modelling techniques approved by the respective country’s insurance regulator or supervisor. The most important insurance entities are located in Spain and Mexico (which together account for approximately 96% of the insurance revenues), where the modelling methods and techniques are reviewed by the insurance regulator in Spain (General Directorate of Insurance) and Mexico (National Insurance and Bonding Commission), respectively. The modelling methods and techniques used to calculate the mathematical reserves for the insurance products are compliant with IFRS and primarily involve the valuation of the estimated future cash flows, discounted at the technical interest rate for each policy. To ensure this technical interest rate, assetliability management is carried out, acquiring a portfolio of securities that generate the cash flows needed to cover the payment commitments assumed with the customers.
The table below shows the key assumptions as of December 31, 2021, 2020 and 2019 used in the calculation of the mathematical reserves for insurance products in Spain and Mexico, respectively:
Mathematical reserves
| 2021 | 2020 | 2019 | ||||||||||||||||
|---|---|---|---|---|---|---|---|---|---|---|---|---|---|---|---|---|---|---|
| Mortality table | Average technical interest type | Mortality table | Average technical interest type | Mortality table | Average technical interest type | |||||||||||||
| Spain | Mexico | Spain | Mexico | Spain | Mexico | Spain | Mexico | Spain | Mexico | Spain | Mexico | |||||||
| Individual life insurance (*) | GRMF 80-2, GKM 80 / GKMF 95, PASEM, GKMF 80/95, PERFM 2000 | Tables of the Comisión Nacional de Seguros y Fianzas 2000-individual | 0.24%-2.85% | 3.60% | GRMF 80-2, GKM 80 / GKMF 95, PASEM, GKMF 80/95, PERFM 2000 | Tables of the Comisión Nacional de Seguros y Fianzas 2000-individual | 0.25%-2.87% | 2.50% | GRMF 80-2, GKMF 80/95, PASEM, PERMF 2000 | Tables of the Comisión Nacional de Seguros y Fianzas 2000-individual | 0.25%-2.91% | 2.50% | ||||||
| Group insurance(**) | PERFM 2000 | Tables of the Comisión Nacional de Seguros y Fianzas 2000-grupo | Depending on the related portfolio | 5.50% | PERMF 2000 | Tables of the Comisión Nacional de Seguros y Fianzas 2000-grupo | Depending on the related portfolio | 5.50% | PERMF 2000 | Tables of the Comisión Nacional de Seguros y Fianzas 2000-grupo | Depending on the related portfolio | 5.50% | ||||||
- (*) Provides coverage in the case of one or more of the following events: death and disability.
- (**) Insurance policies purchased by companies (other than BBVA Group entities) on behalf of their employees.
24. Provisions
The breakdown of the balance under this heading in the accompanying consolidated balance sheets, based on type of provisions, is as follows:
Provisions. Breakdown by concepts (Millions of Euros)
| Notes | 2021 | 2020 | 2019 | |
|---|---|---|---|---|
| Provisions for pensions and similar obligations | 25 | 3,576 | 4,272 | 4,631 |
| Other long term employee benefits (*) | 25 | 632 | 49 | 61 |
| Provisions for taxes and other legal contingencies | 623 | 612 | 677 | |
| Provisions for contingent risks and commitments | 691 | 728 | 711 | |
| Other provisions (**) | 366 | 479 | 457 | |
| Total | 5,889 | 6,141 | 6,538 |
- (*) The variation is mainly explained by the collective layoff procedure that is being carried out at Banco Bilbao Vizcaya Argentaria, S.A.
- (**) Individually insignificant provisions or contingencies, for various concepts in different geographies.
The change in provisions for pensions and similar obligations for the years ended December 31, 2021, 2020 and 2019 is as follows:
Provisions for pensions, other post-employement obligations for defined benefit plans, and other long term employee benefits. Changes over the year (Millions of Euros)
| Notes | 2021 | 2020 | 2019 | |
|---|---|---|---|---|
| Balance at the beginning | 4,272 | 4,631 | 4,787 | |
| Charges to income for the year | 141 | 298 | 327 | |
| Interest expense and similar charges | 37 | 44 | 63 | |
| Personnel expense | 44.1 | 49 | 49 | 49 |
| Provision expense | 56 | 205 | 215 | |
| Charges to equity (*) | 25 | (206) | 191 | 329 |
| Transfers and other changes (**) | (21) | (71) | (29) | |
| Benefit payments | 25 | (608) | (654) | (718) |
| Employer contributions | 25 | (4) | (124) | (65) |
| Balance at the end | 3,576 | 4,272 | 4,631 |
- (*) Correspond to actuarial losses (gains) arising from certain post-employment defined-benefit commitments for pensions recognized in “Equity” (see Note 2.2.11).
- (**) In 2020, it includes the amount of the USA Sale (see Notes 1.3, 3 and 21).
Provisions for taxes, legal contingencies and other provisions. Changes over the year (Millions of Euros)
| 2021 | 2020 | 2019 | |
|---|---|---|---|
| Balance at beginning | 1,091 | 1,134 | 1,286 |
| Additions (*) | 1,175 | 555 | 396 |
| Acquisition of subsidiaries | - | - | - |
| Unused amounts reversed during the year | (227) | (215) | (96) |
| Amount used and other variations (*) | (1,050) | (383) | (453) |
| Balance at the end | 990 | 1,091 | 1,134 |
(*)In 2021, it includes the initial recognition of the estimated cost of the collective layoff procedure that is being carried out at Banco Bilbao Vizcaya Argentaria, S.A., and the subsequent reclassification from "Other provisions" to "Other long term employee benefits" for the remaining amount at the time of the reclassification.
Collective layoff procedure
On June 8, 2021, BBVA reached an agreement with the union representatives on the collective layoff procedure proposed for Banco Bilbao Vizcaya Argentaria, S.A. in Spain on April 13, 2021, which would affect 2,935 employees. The agreement also included the closing of 480 offices (most of which had closed as of December 31, 2021). The cost of the process amounts to €994 million before taxes, of which €754 million correspond to the collective layoff and €240 million to the closing of offices (see Notes 17, 21, 46, 49 and 50). As of December 31, 2021, 2,888 employees had already signed out of BBVA S.A. (some of them effectively departed on January 1, 2022). It is expected that during January and February, additional departures will take place until the agreement is completed, which could be extended until March 31, 2022.
Ongoing legal proceedings and litigation
The financial sector faces an environment of increased regulatory pressure and litigation. In this environment, the various Group entities are often sued on lawsuits and are therefore involved in individual or collective legal proceedings and litigation arising from their activity and operations, including proceedings arising from their lending activity, from their labor relations and from other commercial, regulatory or tax issues, as well as in arbitration.
On the basis of the information available, the Group considers that, as of December 31, 2021, the provisions made in relation to judicial proceedings and arbitration, where so required, are adequate and reasonably cover the liabilities that might arise, if any, from such proceedings. Furthermore, on the basis of the information available and with the exceptions indicated in Note 7.1 "Risk factors", BBVA considers that the liabilities that may arise from such proceedings will not have, on a case-by-case basis, a significant adverse effect on the Group's business, financial situation or results of operations
25. Post-employment and other employee benefit commitments
As stated in Note 2.2.11, the Group has assumed commitments with employees including short-term employee benefits (see Note 44.1), defined contribution and defined benefit plans (see Glossary), healthcare and other long-term employee benefits.
The Group sponsors defined-contribution plans for the majority of its active employees with the plans in Spain and Mexico being the most significant. Most defined benefit plans are closed to new employees with liabilities relating largely to retired employees, the most significant being those in Spain, Mexico and Turkey. In Mexico, the Group provides medical benefits to a closed group of employees and their family members, both active service and in retirees.
The breakdown of the net defined benefit liability recorded on the balance sheet as of December 31, 2021, 2020 and 2019 is provided below:
Net defined benefit liability (asset) on the consolidated balance sheet (Millions of Euros)
| Notes | 2021 | 2020 | 2019 | |
|---|---|---|---|---|
| Pension commitments | 4,218 | 4,539 | 5,050 | |
| Early retirement commitments | 952 | 1,247 | 1,486 | |
| Medical benefits commitments | 1,377 | 1,562 | 1,580 | |
| Other long term employee benefits | 632 | 49 | 61 | |
| Total commitments | 7,180 | 7,398 | 8,177 | |
| Pension plan assets | 1,494 | 1,608 | 1,961 | |
| Medical benefit plan assets | 1,494 | 1,484 | 1,532 | |
| Total plan assets (*) | 2,988 | 3,092 | 3,493 | |
| Total net liability / asset | 4,193 | 4,305 | 4,684 | |
| Of which: Net asset on the consolidated balance sheet (**) | (15) | (16) | (8) | |
| Of which: +Net liability on the consolidated balance sheet for provisions for pensions and similar obligations (***) | 24 | 3,576 | 4,272 | 4,631 |
| Of which: Net liability on the consolidated balance sheet for other long term employee benefits (****) | 24 | 632 | 49 | 61 |
- (*) In Turkey, the foundation responsible for managing the benefit commitments holds an additional asset of €165 million as of December 31, 2021 which, in accordance with IFRS regarding the asset ceiling, has not been recognized in the Consolidated Financial Statements, because although it could be used to reduce future pension contributions it could not be immediately refunded to the employer.
- (**) Recorded under the heading “Other Assets - Other” of the consolidated balance sheet (see Note 20).
- (***) Recorded under the heading “Provisions - Provisions for pensions and similar obligations” of the consolidated balance sheet.
- (****) Recorded under the heading “Provisions – Other long-term employee benefits” of the consolidated balance sheet. The variation is mainly explained by the collective layoff procedure that is being carried out at Banco Bilbao Vizcaya Argentaria, S.A.
The impact relating to benefit commitments charged to consolidated income statement for the years 2021, 2020 and 2019 is as follows:
Consolidated income statement impact (Millions of Euros)
| Notes | 2021 | 2020 | 2019 | |
|---|---|---|---|---|
| Interest and other expense | 37 | 44 | 63 | |
| Interest expense | 257 | 265 | 293 | |
| Interest income | (220) | (220) | (230) | |
| Personnel expense | 120 | 121 | 143 | |
| Defined contribution plan expense | 44.1 | 71 | 72 | 95 |
| Defined benefit plan expense | 44.1 | 49 | 49 | 49 |
| Provisions or (reversal) of provisions | 46 | 61 | 210 | 213 |
| Early retirement expense | 100 | 224 | 190 | |
| Past service cost expense | (28) | (8) | 18 | |
| Remeasurements (*) | (16) | (11) | 7 | |
| Other provision expense | 6 | 4 | (1) | |
| Total impact on consolidated income statement expense (income) | 218 | 375 | 419 |
- (*) Actuarial losses (gains) on remeasurement of the net defined benefit liability relating to early retirements in Spain and other long-term employee benefits that are charged to the income statements (see Note 2.2.12).
The amounts relating to post-employment benefits charged to the consolidated balance sheet correspond to the actuarial gains (losses) on remeasurement of the net defined benefit liability relating to pension and medical commitments before income taxes as of December 31, 2021, 2020 and 2019 are as follows:
Equity Impact (Millons of Euros)
| 2021 | 2020 | 2019 | |
|---|---|---|---|
| Defined benefit plans | 52 | 161 | 254 |
| Post-employment medical benefits | (257) | 30 | 74 |
| Total impact on equity: debit (credit) | 206 | 191 | 329 |
In 2021, the aggregate impact of this heading amounted to a credit of €206 million driven by the variation in financial assumptions, gains of €171 million for the commitments in Mexico, and gains of €55 million for the commitments in Spain. These amounts are offset by other geographies and demographic and experience effects. In 2020, the aggregate impact of this heading amounted to €191 million, driven mainly by the variation in interest rates and losses on commitments (€91 million in Mexico and €68 million in Spain) and, to a lesser extent, the updating of the mortality tables in Spain (€49 million losses). These amounts are partially offset by the effect in other geographies and experience. In 2019, this heading amounted to €329 million mainly due to the variation in two geographies. Firstly, as a consequence of the €231 million euros increase in actuarial losses on commitments in Spain, due to the variation in discount rates from 1.75% to 1%. Secondly, driven by the €83 million increase in actuarial losses on commitments in Mexico, due to the decrease in discount rates from 10.45% to 9.04%.
25.1 Defined benefit plans
Defined benefit commitments relate mainly to employees who have already retired or taken early retirement, certain closed groups of active employees still accruing defined benefit pensions, and in-service death and disability benefits provided to most active employees. For the latter, the Group pays the required premiums to fully insure the related liability. The change in these pension commitments during the years ended December 31, 2021, 2020 and 2019 is presented below:
Defined benefits (Millions of Euros)
| 2021 | 2020 | 2019 | |||||||
|---|---|---|---|---|---|---|---|---|---|
| Defined benefit obligation | Plan assets | Net liability (asset) | Defined benefit obligation | Plan assets | Net liability (asset) | Defined benefit obligation | Plan assets | Net liability (asset) | |
| Balance at the beginning | 7,348 | 3,092 | 4,256 | 8,116 | 3,493 | 4,622 | 7,585 | 2,839 | 4,746 |
| Current service cost | 53 | — | 53 | 53 | — | 53 | 52 | — | 52 |
| Interest income/expense | 253 | 220 | 33 | 261 | 219 | 42 | 290 | 230 | 60 |
| Contributions by plan participants | 5 | 5 | — | 4 | 4 | — | 4 | 4 | — |
| Employer contributions | — | 4 | (4) | — | 124 | (124) | — | 65 | (65) |
| Past service costs(*) | 75 | — | 75 | 219 | — | 219 | 210 | — | 210 |
| Remeasurements: | (406) | (184) | (223) | 364 | 176 | 187 | 783 | 454 | 329 |
| Return on plan assets (**) | — | (184) | 184 | — | 176 | (176) | — | 454 | (454) |
| From changes in demographic assumptions | (121) | — | (121) | 57 | — | 57 | (15) | — | (15) |
| From changes in financial assumptions | (259) | — | (259) | 276 | — | 276 | 688 | — | 688 |
| Other actuarial gains and losses | (27) | — | (27) | 30 | — | 30 | 110 | — | 110 |
| Benefit payments | (765) | (158) | (608) | (839) | (185) | (654) | (905) | (187) | (718) |
| Settlement payments | (1) | (1) | — | — | — | — | — | — | — |
| Business combinations and disposals (***) | (2) | 1 | (3) | (371) | (327) | (44) | 15 | 12 | 3 |
| Effect on changes in foreign exchange rates | (24) | 8 | (32) | (459) | (409) | (50) | 63 | 69 | (6) |
| Conversions to defined contributions | — | — | — | — | — | — | — | — | — |
| Other effects | 13 | — | 13 | 1 | (3) | 4 | 19 | 6 | 13 |
| Balance at the end | 6,547 | 2,988 | 3,560 | 7,348 | 3,092 | 4,256 | 8,116 | 3,493 | 4,623 |
| Of which: Spain | 3,670 | 206 | 3,464 | 4,288 | 249 | 4,039 | 4,592 | 266 | 4,326 |
| Of which: Mexico | 2,150 | 2,149 | 1 | 2,219 | 2,122 | 97 | 2,231 | 2,124 | 107 |
| Of which: The United States | - | - | - | — | — | — | 375 | 323 | 52 |
| Of which: Turkey | 272 | 209 | 63 | 367 | 282 | 85 | 444 | 359 | 86 |
- (*) Including gains and losses arising from settlements.
- (**) Excluding interest, which is recorded under "Interest income or expense".
- (***) The amount in 2020 in mainly due to the companies in the United States included in the USA Sale (see Notes 1.3, 3 and 21).
The balance under the heading “Provisions - Pensions and other post-employment defined benefit obligations” of the accompanying consolidated balance sheet as of December 31, 2021 includes €311 million relating to post-employment benefit commitments to former members of the Board of Directors and the Bank’s Management (see Note 54).
The most significant commitments are those in Spain and Mexico and, to a lesser extent, in Turkey. The remaining commitments are located mostly in Portugal and South America. Unless otherwise required by local regulation, all defined benefit plans have been closed to new entrants, who instead are able to participate in the Group´s defined contribution plans.
Both the costs and the present value of the commitments are determined by independent qualified actuaries using the “projected unit credit” method. In order to guarantee the good governance of these plans, the Group has established specific benefits committees. These benefit committees include members from the different areas of the business to ensure that all decisions are made taking into consideration all of the associated impacts.
The following table sets out the key actuarial assumptions used in the valuation of these commitments as of December 31, 2021, 2020 and 2019:
Actuarial assumptions (%)
| 2021 | 2020 | 2019 | ||||||||||
|---|---|---|---|---|---|---|---|---|---|---|---|---|
| Spain | Mexico | Turkey | Spain | Mexico | Turkey | Spain | Mexico | Turkey | ||||
| Discount rate | 0.74% | 9.68% | 19.10% | 0.53% | 8.37% | 13.00% | 0.68% | 9.04% | 12.50% | |||
| Rate of salary increase | — | 4.00% | 16.60% | — | 4.00% | 11.20% | — | 4.75% | 9.70% | |||
| Rate of pension increase | — | 2.95% | 15.10% | — | 1.94% | 9.70% | — | 2.47% | 8.20% | |||
| Medical cost trend rate | — | 7.00% | 19.30% | — | 7.00% | 13.90% | — | 7.00% | 12.40% | |||
| Mortality tables | PER 2020 | EMSSA0 | CSO2001 | PER202 | EMSSA | CSO20 | PERM/F 2000P |
EMSSA09 | CSO2001 | |||
In Spain, the discount rate shown as of December 31, 2021, corresponds to the weighted average rate, the actual discount rates used are 0% and 1% depending on the type of commitment.
Discount rates used to value future benefit cash flows have been determined by reference to high quality corporate bonds (Note 2.2.12) denominated in Euro in the case of Spain and Mexican peso for Mexico, and government bonds denominated in Turkish Lira for Turkey.
The expected return on plan assets has been set in line with the adopted discount rate
Assumed retirement ages have been set by reference to the earliest age at which employees are entitled to retire, the contractually agreed age in the case of early retirements in Spain or by using retirement rates.
Changes in the main actuarial assumptions may affect the valuation of the commitments. The table below shows the sensitivity of the benefit obligations to changes in the key assumptions:
Sensitivity analysis (Millions of Euros)
| Basis points change | 2021 | 2020 | 2019 | ||||
|---|---|---|---|---|---|---|---|
| Increase | Decrease | Increase | Decrease | Increase | Decrease | ||
| Discount rate | 50 | (282) | 307 | (354) | 390 | (367) | 405 |
| Rate of salary increase | 50 | 2 | (2) | 4 | (4) | 3 | (3) |
| Rate of pension increase | 50 | 28 | (26) | 29 | (27) | 27 | (26) |
| Medical cost trend rate | 50 | 109 | (98) | 145 | (129) | 169 | (133) |
| Change in obligation from each additional year of longevity | — | 170 | — | 211 | — | 137 | — |
The sensitivities provided above have been determined at the date of these consolidated financial statements, and reflect solely the impact of changing one individual assumption at a time, keeping the rest of the assumptions unchanged, thereby excluding the effects which may result from combined assumption changes.
In addition to the commitments to employees shown above, the Group has other less material long-term employee benefits. These include long-service awards, which consist of either an established monetary award or some vacation days granted to certain groups of employees when they complete a given number of years of service. Additionally, this heading includes a fund related to the collective layoff procedure that has been carried out in Banco Bilbao Vizcaya Argentaria, S.A. in 2021. As of December 31, 2021, 2020 and 2019, the actuarial liabilities for the outstanding awards amounted to €632 million, €50 million and €61 million, respectively. These commitments are recorded under the heading "Provisions - Other long-term employee benefits" of the accompanying consolidated balance sheet (see Note 24).
25.1.1 Post-employment commitments and similar obligations
These commitments relate mostly to pension payments, and which have been determined based on salary and years of service. For most plans, pension payments are due on retirement, death and long term disability.
In addition, during the year 2021, Group entities in Spain offered certain employees the option to take retirement or early retirement (that is, earlier than the age stipulated in the collective labor agreement in force). This offer was accepted by 432 employees (781 and 616 during years 2020 and 2019, respectively). These commitments include the compensation and indemnities due as well as the contributions payable to external pension funds during the early retirement period. As of December 31, 2021, 2020 and 2019, the value of these commitments amounted to €952 million, €1,247 million and €1,486 million, respectively.
The change in the benefit plan obligations and plan assets during the year ended December 31, 2021 was as follows:
Post-employment commitments 2021 (Millions of Euros)
| Spain | Mexico | Turkey | Rest of the world | ||
| Defined benefit obligation | |||||
| Balance at the beginning | 4,287 | 666 | 367 | 465 | |
| Current service cost (*) | 5 | 5 | 16 | 3 | |
| Interest income or expense | 22 | 53 | 40 | 6 | |
| Contributions by plan participants | — | — | 3 | 2 | |
| Employer contributions | — | — | — | — | |
| Past service costs (*) | 75 | — | 2 | 2 | |
| Remeasurements: | (106) | 79 | 21 | (24) | |
| Return on plan assets (**) | — | — | — | — | |
| From changes in demographic assumptions | — | (4) | — | (2) | |
| From changes in financial assumptions | (61) | 84 | (18) | (7) | |
| Other actuarial gains and losses | (45) | (2) | 39 | (15) | |
| Benefit payments | (625) | (67) | (13) | (12) | |
| Settlement payments | — | — | — | (1) | |
| Business combinations and disposals | — | — | — | (2) | |
| Effect on changes in foreign exchange rates | — | 42 | (166) | 9 | |
| Conversions to defined contributions | — | — | — | - | |
| Other effects | 12 | — | — | — | |
| Balance at the end | 3,670 | 779 | 272 | 449 | |
| Of which: Vested benefit obligation relating to current employees | 3,596 | ||||
| Of which: Vested benefit obligation relating to retired employees | 74 | ||||
| Plan Assets | |||||
| Balance at the beginning | 249 | 638 | 282 | 439 | |
| Current service cost | — | — | — | — | |
| Interest income or expense | 2 | 52 | 32 | 5 | |
| Contributions by plan participants | — | — | 3 | 2 | |
| Employer contributions | (11) | 2 | 11 | 1 | |
| Past service costs (*) | — | — | — | — | |
| Remeasurements: | (8) | (49) | 11 | (19) | |
| Return on plan assets (**) | (8) | (49) | 11 | (19) | |
| From changes in demographic assumptions | — | — | — | — | |
| From changes in financial assumptions | — | — | — | — | |
| Other actuarial gains and losses | — | — | — | — | |
| Benefit payments | (26) | (65) | (7) | (11) | |
| Settlement payments | — | — | — | (1) | |
| Business combinations and disposals | — | 40 | — | — | |
| Effect on changes in foreign exchange rates | — | 37 | (123) | 9 | |
| Conversions to defined contributions | — | — | — | — | |
| Other effects | — | — | — | (1) | |
| Balance at the end | 206 | 655 | 209 | 424 | |
| Net liability (asset) | |||||
| Balance at the beginning | 4,038 | 28 | 85 | 27 | |
| Current service cost | 5 | 5 | 16 | 3 | |
| Interest income or expense | 20 | 1 | 9 | 1 | |
| Contributions by plan participants | — | — | — | — | — |
| Employer contributions | 11 | (2) | (11) | (1) | |
| Past service costs (*) | 75 | — | 2 | 2 | Remeasurements: | (98) | 128 | 10 | (5) |
| Return on plan assets (**) | 8 | 49 | (11) | 19 | |
| From changes in demographic assumptions | — | (4) | — | (2) | |
| From changes in financial assumptions | (61) | 84 | (18) | (7) | |
| Other actuarial gains and losses | (45) | (2) | 39 | (15) | |
| Benefit payments | (599) | (1) | (6) | (1) | |
| Settlement payments | — | — | — | — | |
| Business combinations and disposals | — | (40) | — | (2) | |
| Effect on changes in foreign exchange rates | — | 5 | (43) | 1 | |
| Conversions to defined contributions | — | — | — | — | |
| Other effects (3) | 12 | — | — | — | |
| Balance at the end | 3,464 | 124 | 63 | 24 | |
- (*) Including gains and losses arising from settlements.
- (**) Excluding interest, which is recorded under "Interest income or expense".
The change in net liabilities (assets) during the years ended 2020 and 2019 was as follows:
Post-employment commitments (Millions of Euros)
| 2020: Net liability (assets) | 2019: Net liability (assets) | ||||||||||
|---|---|---|---|---|---|---|---|---|---|---|---|
| Spain | Mexico | The United States | Turkey | Rest of the world | Spain | Mexico | The United States | Turkey | Rest of the world | ||
| Balance at the beginning | 4,326 | 72 | 52 | 86 | 38 | 4,547 | 71 | 39 | 83 | 36 | |
| Current service cost | 5 | 5 | 1 | 18 | 3 | 4 | 4 | - | 20 | 3 | |
| Interest income or expense | 28 | 6 | 2 | 8 | 1 | 42 | 9 | - | 11 | 3 | |
| Contributions by plan participants | - | - | - | - | - | - | - | - | - | - | |
| Employer contributions | - | (86) | - | (14) | (1) | - | (47) | (3) | (14) | (1) | |
| Past service costs (*) | 224 | (1) | - | 2 | 3 | 190 | 15 | - | 3 | 2 | |
| Remeasurements: | 95 | 62 | (4) | 18 | (14) | 231 | 9 | 16 | 2 | (1) | |
| Return on plan assets (**) | (41) | (31) | (35) | 23 | (26) | (67) | (90) | (28) | 5 | (50) | |
| From changes in demographic assumptions | 60 | - | (3) | - | - | - | - | - | (13) | (2) | |
| From changes in financial assumptions | 79 | (19) | 34 | 54 | 17 | 239 | 87 | 42 | (41) | 52 | |
| Other actuarial gain and losses | (3) | 112 | - | (59) | (5) | 59 | 12 | 2 | 51 | (1) | |
| Benefit payments | (643) | (1) | (2) | (6) | (1) | (702) | (1) | (2) | (11) | (3) | |
| Settlement payments | - | - | - | - | - | - | - | - | - | - | |
| Business combinations and disposals | - | (19) | (44) | - | - | - | 7 | 3 | - | - | |
| Effect on changes in foreign exchange rates | - | (10) | (5) | (26) | (4) | - | - | 5 | - | (9) | 1 |
| Conversions to defined contributions | - | - | - | - | - | - | - | - | - | - | |
| Other effects | 3 | - | - | - | - | 14 | - | (1) | - | 0 | |
| Balance at the end | 4,039 | 28 | - | 85 | 27 | 4,326 | 72 | 52 | 86 | 38 | |
- (*) Includes gains and losses from settlements.
- (**) Excludes interest which is reflected in the line item “Interest income and expense”.
In Spain, local regulation requires that pension and death benefit commitments must be funded, either through a qualified pension plan or an insurance contract.
In the Spanish entities these commitments are covered by insurance contracts which meet the requirements of the accounting standard regarding the non-recoverability of contributions. However, a significant number of the insurance contracts are with BBVA Seguros, S.A. – a consolidated subsidiary and related party – and consequently these policies cannot be considered plan assets under IAS 19. For this reason, the liabilities insured under these policies are fully recognized under the heading "Provisions – Pensions and other post-employment defined benefit obligations" of the accompanying consolidated balance sheet (see Note 24), while the related assets held by the insurance company are included within the Group´s consolidated assets (recorded according to the classification of the corresponding financial instruments). As of December 31, 2021 the value of these separate assets was €2,326 million, (€2,572 and €2,620 million as of December 31, 2021, 2020 and 2019, respectively) representing direct rights of the insured employees held in the consolidated balance sheet, hence these benefits are effectively fully funded.
On the other hand, some pension commitments have been funded through insurance contracts with insurance companies not related to the Group. In this case the accompanying consolidated balance sheet reflects the value of the obligations net of the fair value of the qualifying insurance policies. As of December 31, 2021, 2020 and 2019, the value of the aforementioned insurance policies (€206, €249 and €266 million, respectively) exactly match the value of the corresponding obligations and therefore no amount for this item has been recorded in the accompanying consolidated balance sheet.
Pension benefits are paid by the insurance companies with whom BBVA has insurance contracts and to whom all insurance premiums have been paid. The premiums are determined by the insurance companies using cash flow matching techniques to ensure that benefits can be met when due, guaranteeing both the actuarial and interest rate risk.
In Mexico, there is a defined benefit plan for employees hired prior to 2001. Other employees participate in a defined contribution plan. External funds/trusts have been constituted locally to meet benefit payments as required by local regulation.
In 2008, the Turkish government passed a law to unify the different existing pension systems under a single umbrella Social Security system. Such system provides for the transfer of the various previously established funds.
The financial sector is in this stage at present, maintaining these pension commitments managed by external pension funds (foundations) established for that purpose.
The foundation that maintains the assets and liabilities relating to employees of Garanti BBVA in Turkey, as per the local regulatory requirements, has registered an obligation amounting to €243 million as of December 31, 2021 pending future transfer to the Social Security system. Furthermore, Garanti BBVA has set up a defined benefit pension plan for employees, additional to the social security benefits, reflected in the consolidated balance sheet.
25.1.2 Medical benefit commitments
The change in defined benefit obligations and plan assets during the years 2021, 2020 and 2019 was as follows:
Medical benefits commitments (Millions of Euros)
| 2021 | 2020 | 2019 | |||||||
|---|---|---|---|---|---|---|---|---|---|
| Defined benefit obligation | Plan assets | Net liability (asset) | Defined benefit obligation | Plan assets | Net liability (asset) | Defined benefit obligation | Plan assets | Net liability (asset) | |
| Balance at the beginning | 1,562 | 1,484 | 77 | 1,580 | 1,532 | 48 | 1,114 | 1,146 | (32) |
| Current service cost | 24 | — | 24 | 21 | — | 21 | 21 | — | 21 |
| Interest income or expense | 131 | 129 | 2 | 117 | 120 | (3) | 119 | 123 | (4) |
| Contributions by plan participants | — | — | — | — | — | — | — | — | — |
| Employer contributions | — | 1 | (1) | — | 22 | (22) | — | — | — |
| Past service costs(*) | (5) | — | (5) | (8) | — | (8) | — | — | — |
| Remeasurements: | (377) | (119) | (257) | 95 | 66 | 30 | 298 | 224 | 74 |
| Return on plan assets(**) | — | (119) | 119 | — | 66 | (66) | — | 224 | (224) |
| From changes in demographic assumptions | (115) | — | (115) | — | — | — | — | — | — |
| From changes in financial assumptions | (257) | — | (257) | 110 | — | 110 | 311 | — | 311 |
| Other actuarial gain and losses | (4) | — | (4) | (15) | — | (15) | (13) | — | (13) |
| Benefit payments | (49) | (48) | — | (37) | (37) | — | (39) | (39) | (1) |
| Settlement payments | — | — | — | — | — | — | — | — | — |
| Business combinations and disposals | — | (39) | 39 | — | (19) | 19 | — | 7 | (7) |
| Effect on changes in foreign exchange rates | 90 | 86 | 4 | (207) | (201) | (6) | 68 | 71 | (2) |
| Other effects | — | — | — | — | — | — | (1) | — | — |
| Balance at the end | 1,377 | 1,494 | (116) | 1,562 | 1,484 | 77 | 1,580 | 1,532 | 48 |
- (*) Including gains and losses arising from settlements.
- (**) Excluding interest, which is recorded under "Interest income or expense".
In Mexico, there is a medical benefit plan for employees hired prior to 2007. New employees from 2007 are covered by a medical insurance policy. An external trust has been constituted locally to fund the plan, in accordance with local legislation and Group policy.
In Turkey, employees are currently provided with medical benefits through a foundation in collaboration with the Social Security system, although local legislation prescribes the future unification of this and similar systems into the general Social Security system itself.
The valuation of these benefits and their accounting treatment follow the same methodology as that employed in the valuation of pension commitments.
25.1.3 Estimated benefit payments
As of December 31, 2021, the estimated benefit payments over the next ten years for all the entities in Spain, Mexico and Turkey are as follows:
Estimated benefit payments (Millions of Euros)
| 2022 | 2023 | 2024 | 2025 | 2026 | 2027-2031 | |
|---|---|---|---|---|---|---|
| Commitments in Spain | 625 | 477 | 395 | 332 | 284 | 920 |
| Commitments in Mexico | 133 | 139 | 146 | 155 | 164 | 941 |
| Commitments in Turkey | 16 | 11 | 15 | 17 | 23 | 206 |
| Total | 774 | 627 | 556 | 505 | 471 | 1,066 |
25.1.4 Plan assets
The majority of the Group´s defined benefit plans are funded by plan assets held in external funds/trusts legally separate from the Group sponsoring entity. However, in accordance with local regulation, some commitments are not externally funded and covered through internally held provisions, principally those relating to early retirements.
Plan assets are those assets which will be used to directly settle the assumed commitments and which meet the following conditions: they are not part of the Group sponsoring entities assets, they are available only to pay post-employment benefits and they cannot be returned to the Group sponsoring entity.
To manage the assets associated with defined benefit plans, BBVA Group has established investment policies designed according to criteria of prudence and minimizing the financial risks associated with plan assets.
The investment policy consists of investing in a low risk and diversified portfolio of assets with maturities consistent with the term of the benefit obligation and which, together with contributions made to the plan, will be sufficient to meet benefit payments when due, thus mitigating the plans‘ risks.
In those countries where plan assets are held in pension funds or trusts, the investment policy is developed consistently with local regulation. When selecting specific assets, current market conditions, the risk profile of the assets and their future market outlook are all taken into consideration. In all the cases, the selection of assets takes into consideration the term of the benefit obligations as well as short-term liquidity requirements.
The risks associated with these commitments are those which give rise to a deficit in the plan assets. A deficit could arise from factors such as a fall in the market value of plan assets, an increase in long-term interest rates leading to a decrease in the fair value of fixed income securities, or a deterioration of the economy resulting in more write-downs and credit rating downgrades.
The table below shows the allocation of plan assets of the main companies of the BBVA Group as of December 31, 2021, 2020 and 2019:
Plan assets breakdown (Millions of Euros)
| 2021 | 2020 | 2019 | |
|---|---|---|---|
| Cash or cash equivalents | 24 | 38 | 56 |
| Debt securities (government bonds) | 2,394 | 2,707 | 2,668 |
| Mutual funds | 1 | 1 | 2 |
| Insurance contracts | 148 | 140 | 142 |
| Total | 2,566 | 2,887 | 2,869 |
| Of which: Bank account in BBVA | 3 | 4 | 4 |
| Of which: Debt securities issued by BBVA | — | — | — |
| Of which: Property occupied by BBVA | — | — | — |
In addition to the above there are plan assets relating to the previously mentioned insurance contracts in Spain and the foundation in Turkey.
The following table provides details of investments in listed securities (Level 1) as of December 31, 2021, 2020 and 2019:
Investments in listed markets (Millions of Euros)
| 2021 | 2020 | 2019 | |
|---|---|---|---|
| Cash or cash equivalents | 24 | 38 | 56 |
| Debt securities (Government bonds) | 2,394 | 2,707 | 2,668 |
| Mutual funds | 1 | 1 | 2 |
| Total | 2,418 | 2,747 | 2,727 |
| Of which: Bank account in BBVA | 3 | 4 | 4 |
| Of which: Debt securities issued by BBVA | — | — | — |
| Of which: Property occupied by BBVA | — | — | — |
The remainder of the assets are mainly invested in Level 2 assets in in accordance with the classification established under IFRS 13 (mainly insurance contracts). As of December 31, 2021, almost all of the assets related to employee commitments corresponded to fixed income securities.
25.2 Defined contribution plans
Certain Group entities sponsor defined contribution plans. Some of these plans allow employees to make contributions which are then matched by the employer.
Contributions are recognized as and when they are accrued, with a charge to the consolidated income statement in the corresponding year. No liability is therefore recognized in the accompanying consolidated balance sheet (see Note 44.1).
26. Common stock
As of December 31, 2021, 2020 and 2019, BBVA’s common stock amounted to €3,267,264,424.20 divided into 6,667,886,580 fully subscribed and paid-up registered shares, all of the same class and series, at €0.49 par value each, represented through bookentries. All of the Bank shares carry the same voting and dividend rights, and no single stockholder enjoys special voting rights. Each and every share is part of the Bank’s common stock.
The Bank’s shares are traded on the stock markets of Madrid, Barcelona, Bilbao and Valencia through the Sistema de Interconexión Bursátil Español (Mercado Continuo), as well as on the London and Mexico stock markets. BBVA American Depositary Shares (ADSs) traded on the New York Stock Exchange under the ticker “BBVA”.
Additionally, as of December 31, 2021, the shares of Banco BBVA Peru, S.A., BBVA Banco Provincial, S.A., Banco BBVA Colombia, S.A., Banco BBVA Argentina, S.A., and Garanti BBVA A.S., were listed on their respective local stock markets. Banco BBVA Argentina, S.A. was also quoted in the Latin American market (Latibex) of the Madrid Stock Exchange and the New York Stock Exchange. Also, the Depositary Receipts (“DR”) of Garanti BBVA, A.S. are listed in the London Stock Exchange. BBVA is also currently included, amongst other indexes, in the IBEX 35® Index, which is made up by the 35 most liquid securities traded on the Spanish Market and, technically, it is a price index that is weighted by capitalization and adjusted according to the free float of each company comprised in the index.
As of December 31, 2021, State Street Bank and Trust Co., The Bank of New York Mellon SA NV and Chase Nominees Ltd in their capacity as international custodian/depositary banks, held 14.26%, 2.45%, and 7.69% of BBVA common stock, respectively. Of said positions held by the custodian banks, BBVA is not aware of any individual shareholders with direct or indirect holdings greater than or equal to 3% of BBVA common stock outstanding.
On April 18, 2019, Blackrock, Inc. reported to the Spanish Securities and Exchange Commission (CNMV) that, it had an indirect holding of BBVA common stock totaling 5.917%, of which 5.480% are voting rights attributed to shares and 0.437% are voting rights through financial instruments.
GQG Partners LLC, on February 11, 2021, notified the Spanish National Securities Market Commission (CNMV) that it now has a direct interest in BBVA's capital stock, totaling 3.090%, through voting rights attributed to the shares.
On the other hand, BBVA is not aware of any direct or indirect interests through which control of the Bank may be exercised. Furthermore, BBVA has not received any information on stockholder agreements including the regulation of the exercise of voting rights at its annual general meetings or restricting or placing conditions on the free transferability of BBVA shares. No agreement is known that could give rise to changes in the control of the Bank.
BBVA banking subsidiaries, associates and joint ventures worldwide, are subject to supervision and regulation from a variety of regulatory bodies in relation to, among other aspects, the satisfaction of minimum capital requirements. The obligation to satisfy such capital requirements may affect the ability of such entities to transfer funds in the form of cash dividends, loans or advances. In addition, under the laws of the various jurisdictions where such entities are incorporated, dividends may only be paid out through funds legally available for such purpose. Even when the minimum capital requirements are met and funds are legally available, the relevant regulators or other public administrations could discourage or delay the transfer of funds to the Group in the form of cash, dividends, loans or advances for prudential reasons.
Resolutions adopted by the Annual General Meeting
Capital increase
BBVA's AGM held on March 17, 2017 resolved, under agenda item four, to confer authority on the Board of Directors to increase Bank's share capital, on one or several occasions, within the legal term of five years of the approval date of the authorization, up to the maximum amount corresponding to 50% of Bank's share capital at the time on which the resolution was adopted, likewise conferring authority to the Board of Directors to totally or partially exclude shareholders' pre-emptive subscription rights over any specific issue that may be made under such authority.
However, the power to exclude pre-emptive subscription rights was limited, such that the nominal amount of the capital increases resolved or effectively carried out with the exclusion of pre-emptive subscription rights in use of the referred authority and those that may be resolved or carried out to cover the conversion of mandatory convertible issues that may also be made with the exclusion of pre-emptive subscription rights in use of the authority to issue convertible securities conferred by the AGM held on March 17, 2017, under agenda item five (without prejudice to the anti-dilution adjustments and this limit not being applicable to contingent convertible issues) shall not exceed the nominal maximum overall amount of 20% of the share capital of BBVA at the time of the authorization.
As of the date of this document, the Bank's Board of Directors has not exercised the authority conferred by the AGM.
Convertible and/or exchangeable securities:
Note 22.4 introduces the details of the convertible and/or exchangeable securities.
27. Share premium
As of December 31, 2021, the balance under this heading in the accompanying consolidated balance sheets was €23,599 million. As of December 31, 2020 and 2019, the balance under this heading was €23,992 million (see Note 4).
The amended Spanish Corporation Act expressly permits the use of the share premium balance to increase capital and establishes no specific restrictions as to its use (see Note 26).
28. Retained earnings, revaluation reserves and other reserves
28.1 Breakdown of the balance
The breakdown of the balance under this heading in the accompanying consolidated balance sheets is as follows:
Retained earnings, revaluation reserves and other reserves. Breakdown by concepts (Millions of Euros)
| 2021 | 2020 | 2019 | |
|---|---|---|---|
| Legal reserve | 653 | 653 | 653 |
| Restricted reserve | 761 | 120 | 124 |
| Voluntary reserves (*) | 3.994 | 8.117 | 8.331 |
| Total reserves holding company (**) | 5.409 | 8.890 | 9.108 |
| Consolidation reserves attributed to the Bank and subsidiary consolidated companies. | 24.575 | 21.454 | 20.161 |
| Total | 29.984 | 30.344 | 29.269 |
- (*) The variation in 2021 is mainly due to the allocation of earnings of BBVA, S.A. and the share repurchase program (see Note 4).
- (**) Total reserves of BBVA, S.A. (See Appendix IX).
28.2 Legal reserve
Under the amended Spanish Corporations Act, 10% of any profit made each year must be transferred to the legal reserve. The transfer must be made until the legal reserve reaches 20% of the common stock.
The legal reserve can be used to increase the common stock provided that the remaining reserve balance does not fall below 10% of the increased capital. While it does not exceed 20% of the common stock, it can only be allocated to offset losses exclusively in the case that there are not sufficient reserves available.
28.3 Restricted reserves
As of December 31, 2021, 2020 and 2019, the Bank’s restricted reserves are as follows:
Restricted reserves. Breakdown by concepts (Millions of Euros)
| 2021 | 2020 | 2019 | |
|---|---|---|---|
| Restricted reserve for retired capital | 88 | 88 | 88 |
| Restricted reserve for Parent Company shares and loans for those shares (*) | 672 | 30 | 34 |
| Restricted reserve for redenomination of capital in euros | 2 | 2 | 2 |
| Total | 761 | 120 | 124 |
- (*) The variation in 2021 is mainly due to the share buyback program (see Note 4).
The restricted reserve for retired capital resulted from the reduction of the nominal par value of the BBVA shares made in April 2000.
The second heading corresponds to restricted reserves related to the amount of shares issued by the Bank in its possession at each date, as well as the amount of customer loans outstanding at those dates that were granted for the purchase of, or are secured by, the parent company shares.
Finally, pursuant to Law 46/1998 on the Introduction of the Euro, a restricted reserve is recognized as a result of the rounding effect of the redenomination of the parent company common stock in euros.
28.4 Retained earnings, Revaluation reserves and Other reserves by entity
The breakdown, by company or corporate group, under the headings “Retained earnings”, “Revaluation reserves” and “other reserves” in the accompanying consolidated balance sheets is as follows:
Retained earnings, revaluation reserves and other reserves. Breakdown by company or corporate group (Millions of Euros)
| 2021 | 2020 | 2019 | |
|---|---|---|---|
| Retained earnings (losses), revaluation reserves and other reserves | |||
| Holding Company | 12,467 | 15,014 | 16,623 |
| BBVA Mexico Group | 13,894 | 12,890 | 10,645 |
| Garanti BBVA Group | 3,043 | 2,509 | 1,985 |
| BBVA Provincial Group | 1,721 | 1,731 | 1,736 |
| BBVA Argentina Group | 1,423 | 1,302 | 1,169 |
| BBVA Colombia Group | 1,393 | 1,287 | 1,130 |
| BBVA Peru Group | 1,031 | 984 | 848 |
| Corporación General Financiera, S.A. | 322 | 920 | 932 |
| Forum Servicios Financieros S.A. | 604 | 619 | 597 |
| Sociedades inmobiliarias CX | 277 | 251 | 266 |
| BBV America, S.L. | 270 | 262 | 247 |
| BBVA Seguros, S.A. | 239 | (35) | (99) |
| Pecri Inversión, S.L. | 118 | 114 | (50) |
| BBVA Uruguay Group | 106 | 87 | 56 |
| Bilbao Vizcaya Holding, S.A. | 68 | 77 | 62 |
| Compañía de Cartera de Inversiones, S.A. | 42 | 59 | 47 |
| Gran Jorge Juan, S.A. | 57 | 42 | 27 |
| BBVA USA Group | - | (1,098) | (308) |
| Anida Grupo Inmobiliario | (556) | (594) | (587) |
| Sociedades inmobiliarias Unnim | (655) | (617) | (594) |
| Anida Operaciones Singulares, S.A. | (5,512) | (5,409) | (5,375) |
| Other | (121) | 112 | 27 |
| Subtotal (*) | 30,231 | 30,508 | 29,388 |
| Other reserves or accumulated losses of investments in joint ventures and associates | |||
| ATOM Bank PLC | (158) | (91) | (56) |
| Metrovacesa, S.A. | (84) | (84) | (75) |
| Other | (5) | 11 | 12 |
| Subtotal | (247) | (164) | (119) |
| Total | 29,984 | 30,344 | 29,269 |
- (*) In 2021 includes the accounting for shares pending from buyback program (see Note 4) and the reclassification of items not subject to reclassification to income statement to by results for "Actuarial gains (losses) in defined benefit pension plans".
For the purpose of allocating the reserves and accumulated losses to the consolidated entities and to the parent company, the transfers of reserves arising from the dividends paid and transactions between these entities are taken into account in the period in which they took place.
29. Treasury shares
In the years ended December 31, 2021, 2020 and 2019 the Group entities performed the following transactions with shares issued by the Bank:
Treasury shares (Millions of Euros)
| 2021 | 2020 | 2019 | ||||
|---|---|---|---|---|---|---|
| Number of Shares |
Millions of Euros |
Number of Shares |
Millions of Euros |
Number of Shares |
Millions of Euros |
|
| Balance at beginning | 14,352,832 | 46 | 12,617,189 | 62 | 47,257,691 | 296 |
| + Purchases (*) | 203,530,570 | 1,022 | 234,691,887 | 807 | 214,925,699 | 1,088 |
| - Sales and other changes | (90,250.003) | (417) | (232,956,244) | (830) | (249,566,201) | (1,298) |
| +/- Derivatives on BBVA shares | - | (4) | - | 7 | - | (23) |
| +/- Other changes | - | - | - | - | - | - |
| Balance at the end | 127,633,399 | 647 | 14,352,832 | 46 | 12,617,189 | 62 |
| Of which: | ||||||
| Held by BBVA, S.A. (*) | 112,733,730 | 574 | 592,832 | 9 | - | |
| Held by Corporación General Financiera, S.A. | 14,899,669 | 72 | 13,760,000 | 37 | 12,617,189 | 62 |
| Held by other subsidiaries | - | - | - | - | - | - |
| Average purchase price in Euros | 5.02 | - | 3.44 | - | 5.06 | - |
| Average selling price in Euros | 4.89 | - | 3.63 | - | 5.20 | - |
| Net gains or losses on transactions (Shareholders' funds-Reserves) | 17 | - | 13 | |||
- (*) In 2021 includes the share buyback program (see Note 4).
The number of BBVA shares accepted by the Group in pledge of loans as of December 31, 2021, 2020 and 2019 is as follows:
Treasury Stock
| 2021 | 2020 | 2019 | |||||||
|---|---|---|---|---|---|---|---|---|---|
| Min | Max | Closing | Min | Max | Closing | Min | Max | Closing | |
| % treasury stock | 0.108% | 1,922% | 1,914% | 0.008% | 0.464% | 0.215% | 0.138% | 0.746% | 0.213% |
The percentages of treasury shares held by the Group in the years ended December 31, 2021, 2020 and 2019 are as follows:
Shares of BBVA accepted in pledge
| 2021 | 2020 | 2019 | |
|---|---|---|---|
| Number of shares in pledge | 29,372,853 | 39,407,590 | 43,018,382 |
| Nominal value | 0.49 | 0.49 | 0.49 |
| % of share capital | 0.44% | 0.59% | 0.65% |
The number of BBVA shares owned by third parties but under management of a company within the Group as of December 31, 2021, 2020 and 2019 is as follows:
Shares of BBVA owned by third parties but managed by the Group
| 2021 | 2020 | 2019 | |
|---|---|---|---|
| Number of shares owned by third parties | 17,645,506 | 18,266,509 | 23,807,398 |
| Nominal value | 0.49 | 0.49 | 0.49 |
| % of share capital | 0.26% | 0.27% | 0.36% |
30. Accumulated other comprehensive income (loss)
The breakdown of the balance under this heading in the accompanying consolidated balance sheets is as follows:
Accumulated other comprehensive income (loss). Breakdown by concepts (Millions of Euros)
| Notes | 2021 | 2020 | 2019 | |
|---|---|---|---|---|
| Items that will not be reclassified to profit or loss | (2,075) | (2,815) | (1,875) | |
| Actuarial gains (losses) on defined benefit pension plans | (998) | (1,474) | (1,498) | |
| Non-current assets and disposal groups classified as held for sale | — | (65) | 2 | |
| Fair value changes of equity instruments measured at fair value through other comprehensive income | 13.4 | (1,079) | (1,256) | (403) |
| Fair value changes of financial liabilities at fair value through profit or loss attributable to changes in their credit risk | 2 | (21) | 24 | |
| Items that may be reclassified to profit or loss | (14,401) | (11,541) | (8,351) | |
| Hedge of net investments in foreign operations (effective portion) | (146) | (62) | (896) | |
| Mexican peso | (681) | (362) | (588) | |
| Turkish lira | 555 | 317 | 163 | |
| Other exchanges | (19) | (18) | (471) | |
| Foreign currency translation | (14,988) | (14,185) | (9,147) | |
| Mexican peso | (4,503) | (5,220) | (3,557) | |
| Turkish lira | (6,607) | (4,960) | (3,750) | |
| Argentine peso | (1,024) | (1,247) | (1,124) | |
| Venezuela Bolívar | (1,858) | (1,860) | (1,854) | |
| Other exchanges | (995) | (898) | (1,138) | |
| Hedging derivatives. Cash flow hedges (effective portion) | (533) | 10 | (44) | |
| Fair value changes of debt instruments measured at fair value through other comprehensive income | 13.4 | 1,274 | 2,069 | 1,760 |
| Non-current assets and disposal groups classified as held for sale (*) | — | 644 | (18) | |
| Share of other recognized income and expense of investments in subsidiaries, joint ventures and associates | (9) | (17) | (5) | |
| Total | (16,476) | (14,356) | (10,226) |
(*) Corresponds mainly to BBVA USA in 2020 (see Notes 1.3, 3 and 21).
The balances recognized under these headings are presented net of tax.
The main changes in 2021 are explained by the depreciation against the euro of some of the currencies of the main geographies where the Group operates against the euro such as the Turkish lira (40.2%), Peruvian sol (1.3%), Colombian peso (6.6%) and Argentine peso (11.3%); partially offset by the appreciation against the euro of the Mexican peso (5.5%) and the application of IAS 29 of Argentina (see Note 2.2.19).
31. Non-controlling interest
The table below is a breakdown by groups of consolidated entities of the balance under the heading “Minority interests (non- controlling interest)” of total equity in the accompanying consolidated balance sheets is as follows:
Non-controlling interests: breakdown by subgroups (Millions of Euros)
| 2021 | 2020 | 2019 | |
|---|---|---|---|
| Garanti BBVA | 2,851 | 3,692 | 4,240 |
| BBVA Peru | 1,212 | 1,171 | 1,334 |
| BBVA Argentina | 557 | 416 | 422 |
| BBVA Colombia | 76 | 70 | 76 |
| BBVA Venezuela | 70 | 65 | 71 |
| Other entities | 87 | 56 | 57 |
| Total | 4,853 | 5,471 | 6,201 |
These amounts are broken down by groups of consolidated entities under the heading “Attributable to minority interests (non-controlling interests)” in the accompanying consolidated income statements:
Profit attributable to non-controlling interests (Millions of Euros)
| 2021 | 2020 | 2019 | |
|---|---|---|---|
| Garanti BBVA | 758 | 579 | 524 |
| BBVA Peru | 143 | 126 | 236 |
| BBVA Argentina | 26 | 38 | 60 |
| BBVA Colombia | 9 | 6 | 11 |
| BBVA Venezuela | 3 | 2 | (1) |
| Other entities | 25 | 5 | 4 |
| Total | 965 | 756 | 833 |
Dividends distributed to non-controlling interest of the Group during the year 2021 are: BBVA Banco Continental Group €76 million, BBVA Garanti Group €38 million and other Group entities accounted for €5 million.
32. Capital base and capital management
32.1 Capital base
As of December 31, 2021, 2020 and 2019, own funds is calculated in accordance to the applicable regulation of each year on minimum capital requirements for Spanish credit institutions –both as individual entities and as consolidated group– that establish how to calculate them, as well as the various internal capital adequacy assessment processes they should have in place and the information they should disclose to the market.
Following the latest SREP (Supervisory Review and Evaluation Process) decision, applicable as from March 1, 2022, the ECB has informed the Group that the Pillar 2 requirement would remain at 1.5% (0.84% must be CET1 at least). Therefore, BBVA must maintain a CET1 capital ratio of 8.60% and a total capital ratio of 12.76% at the consolidated level.
The BBVA Group has set the objective of maintaining a fully-loaded CET1 ratio at a consolidated level of between 11.5% -12.0%, increasing the target distance to the minimum requirement (currently at 8.60%) at 290-340 basis points. At closing of the financial year 2021, the fully-loaded CET1 ratio is above this target management range.
A reconciliation of the main figures between the accounting and regulatory own funds as of December 31, 2021, 2020 and 2019 is shown below:
Eligible capital resources (Millions of Euros)
| Notes | 2021 (*) | 2020 | 2019 | |
|---|---|---|---|---|
| Capital | 26 | 3,267 | 3,267 | 3,267 |
| Share premium | 27 | 23,599 | 23,992 | 23,992 |
| Retained earnings, revaluation reserves and other reserves | 28 | 29,984 | 30,344 | 29,269 |
| Other equity instruments, net | 60 | 42 | 56 | |
| Treasury shares | 29 | (647) | (46) | (62) |
| Profit (loss) attributable to the parent company | 5 | 4,653 | 1,305 | 3,512 |
| Interim dividend | (532) | - | (1,084) | |
| Total equity | 60,384 | 58,904 | 58,950 | |
| Accumulated other comprehensive income (loss) | 30 | (16.476) | (14,356) | (10,226) |
| Non-controlling interest | 31 | 4,853 | 5,472 | 6,201 |
| Shareholders' equity | 48,760 | 50,020 | 54,925 | |
| Goodwill and other intangible assets | (1,484) | (3,455) | (6,803) | |
| Deductions | (1,484) | (3,455) | (6,803) | |
| Differences from solvency and accounting perimeter | (131) | (186) | (215) | |
| Equity not eligible at solvency level | (131) | (186) | (215) | |
| Other adjustments and deductions (**) | (7,208) | (3,449) | (4,253) | |
| Common Equity Tier 1 (CET 1) | 39,937 | 42,931 | 43,653 | |
| Additional Tier 1 before Regulatory Adjustments | 5,737 | 6,666 | 6,048 | |
| Total Regulatory Adjustments to Additional Tier 1 | - | - | - | |
| Tier 1 | 45,674 | 49,597 | 49,701 | |
| Tier 2 | 7,383 | 8,547 | 8,304 | |
| Total Capital (Total Capital=Tier 1 + Tier 2) | 53,057 | 58,145 | 58,005 | |
| Total Minimum equity required | 39,274 | 45,042 | 46,540 |
- (*) Provisional data.
- (**) Other adjustments and deductions includes, among others, the adjustment of non-eligible minority interests, the amount of repurchase of own shares up to the maximum limit authorized by the ECB for the BBVA Group (see Note 4) and the amount of shareholders remuneration pending to be distributed.
The Group’s own funds in accordance with the aforementioned applicable regulation as of December 31, 2021, 2020 and 2019 are shown below:
Amount of capital CC1 (Millions of Euros)
| 2021 (*) | 2020 | 2019 | |
|---|---|---|---|
| Capital and share premium | 26,866 | 27,259 | 27,259 |
| Retained earnings and equity instruments | 30,745 | 29,974 | 29,127 |
| Other accumulated income and other reserves | (17,200) | (14,023) | (10,133) |
| Minority interests | 2,800 | 3,656 | 4,404 |
| Net interim attributable profit | 2,564 | 860 | 1,316 |
| Common Equity Tier I (CET1) before other regulatory adjustments | 45,775 | 47,726 | 51,974 |
| Goodwill and intangible assets | (1,484) | (3,455) | (6,803) |
| Direct, indirect and synthetic holdings in own Common Equity Tier I instruments (**) | (2,800) | (366) | (484) |
| Deferred tax assets | (1,009) | (1,478) | (1,420) |
| Other deductions and filters | (545) | 504 | 386 |
| Total common equity Tier 1 regulatory adjustments | (5,838) | (4,795) | (8,321) |
| Common equity TIER 1 (CET1) | 39,937 | 42,931 | 43,653 |
| Capital instruments and share premium accounts classified as liabilities and qualifying as Additional Tier I | 5,265 | 6,130 | 5,400 |
| Qualifying Tier 1 capital included in consolidated AT1 capital issued by subsidiaries and held by third parties | 472 | 536 | 648 |
| Additional Tier 1 (CET 1) before regulatory adjustments | 5,737 | 6,667 | 6,048 |
| Transitional CET 1 adjustments | — | — | — |
| Total regulatory adjustments to additional Tier 1 | — | — | — |
| Additional Tier 1 (AT1) | 5,737 | 6,666 | 6,048 |
| Tier 1 (Common equity TIER 1+ additional TIER 1) | 45,674 | 49,597 | 49,701 |
| Capital instruments and share premium accounted as Tier 2 | 4,324 | 4,540 | 3,242 |
| Qualifying Tier 2 capital included in consolidated T2 capital issued by subsidiaries and held by third parties | 2,516 | 3,410 | 4,512 |
| Credit risk adjustments | 722 | 604 | 631 |
| Tier 2 before regulatory adjustments | 7,562 | 8,554 | 8,385 |
| Tier 2 regulatory adjustments | (179) | (6) | (82) |
| Tier 2 | 7,383 | 8,547 | 8,304 |
| Total capital (Total capital=Tier 1 + Tier 2) | 53,057 | 58,145 | 58,005 |
| Total RWA | 307,791 | 353,273 | 364,448 |
| CET 1 (phased-in) | 12.98% | 12.15% | 11.98% |
| Tier 1 (phased-in) | 14.84% | 14.04% | 13.64% |
| Total capital (phased-in) | 17.24% | 16.46% | 15.92% |
- (*) Provisional data.
- (**) Includes mainly the amount of repurchase of own shares pending to be executed and up to the maximum limit authorized by the ECB for the BBVA Group (see Note 4).
As of December 2021 Common Equity Tier 1 (CET1) fully-loaded ratio stood at 12.75% which represented an increase of 102 basis points with respect to 2020, with the CET1 phased-in ratio at 12.98%, which represented an increase of 82 basis points with respect to 2020. The difference is mainly explained by the effect of the transitory adjustments for the treatment in the solvency ratios of the impacts of IFRS 9.
These fully-loaded ratios include the effect of divestment in BBVA Paraguay in the first quarter and in the United States in the second quarter (see Note 3). In addition, these ratios include the singular effects of the restructuring process (see Note 24) and the deduction of the total amount of the share buyback program authorized by the European Central Bank for €3,500 million. Excluding these impacts, during the period, the high organic generation of profits, net of shareholder remuneration and the payment of the Contingent Convertible bonds (CoCos) contributed by +81 basis points to the CET1 ratio and covered the negative evolution of market variables, as well as the supervisory impacts and regulatory changes.
Fully-loaded risk-weighted assets (RWAs) decreased by approximately €-45.400 million, mainly as a result of the sale of BBVA USA and BBVA Paraguay.
The fully-loaded additional Tier 1 capital ratio (AT1) stood at 1.87% (1.86% phased-in) at December 31, 2021, which included the reduction of €1.000 million due to the early amortization of a series of CoCos issued in 2016, offset by the positive effect of RWA reduction.
The fully-loaded Tier 2 ratio stood at 2.37%, which represents an increase of +7 basis points compared to December 31, 2020, mainly explained by the RWA reduction during the year. The phased-in Tier 2 ratio stood at 2.40%. The difference with the fully-loaded Tier 2 ratio relates mainly to the transitional treatment of certain subordinated issuances.
In February 2021, BBVA Uruguay issued the first sustainable bond in the Uruguayan financial market for USD15 million at an initial interest rate of 3.854%.
As result of the above, the total fully-loaded capital ratio stood at 16.98% as of December 31, 2021, and total phased-in ratio stood at 17.24%.
Regarding MREL (Minimum Requirement for own funds and Eligible Liabilities) requirements, BBVA has received a new communication from the Bank of Spain regarding its minimum requirement that has been calculated taking into account the financial and supervisory information as of December 31, 2019.
In accordance with this new MREL communication, BBVA has to reach, by January 1, 2022, an amount of own funds and eligible liabilities equal to 24.78% (in accordance with the new applicable regulation, the MREL in RWAs and the subordination requirement in RWAs do not include the combined capital buffer requirement; for these purposes, the applicable combined capital buffer requirement, 2.5%, without prejudice to any other buffer that may be applicable at any time) of the total RWAs of its resolution group, on sub-consolidated level (the “MREL in RWAs”). Within this MREL in RWAs, an amount equal to 13.50% of the RWAs shall be met with subordinated instruments (the "subordination requirement in RWA"). This MREL in RWAs is equal to 10.25% in terms of the total exposure considered for calculating the leverage ratio (the “MREL in LR”), while the subordination requirement in RWAs is equal to 5.84% in terms of the total exposure considered for calculating the leverage ratio (the "subordination requirement in LR"). For BBVA, the most restrictive requirement as of today is the one expressed in RWA. The current own funds and eligible liabilities structure of the resolution group as of June 30, 2021 meets the MREL in RWAs, being the MREL ratio in terms of RWA of 28.34%. Finally, as of December 31, 2021, the MREL in LR is 11.35% and the subordination ratios in terms of RWA and in terms of LR are 24.65% and 9.87%, respectively.
32.2 Leverage ratio
The leverage ratio (LR) is a regulatory measure complementing capital designed to guarantee the soundness and financial strength of institutions in terms of indebtedness. This measurement can be used to estimate the percentage of the assets and off-balance sheet arrangements financed with Tier 1 capital, being the carrying amount of the assets used in this ratio adjusted to reflect the bank’s current or potential leverage of a given balance-sheet position (Leverage ratio exposure).
Breakdown of leverage ratio as of December 31, 2021, 2020 and 2019, calculated according to CCR, is as follows:
Leverage ratio
| 2021 (*) | 2020 | 2019 | |
|---|---|---|---|
| Tier 1 (millions of Euros) (a) | 45,674 | 49,597 | 49,701 |
| Exposure to leverage ratio (millions of Euros) (b) | 673,729 | 741,095 | 731,087 |
| Leverage ratio (a)/(b) (percentage) | 6,78 % | 6,69 % | 6,80 % |
- (*) Provisional data.
Finally, as of December 31, 2021, the phased-in leverage ratio, which includes the transitory treatment of certain capital elements (mainly the impact of IFRS 9), stood at 6.78%. These figures include the effect of the temporary exclusion of certain positions with central banks provided for in the "CRR-Quick fix”.
32.3 Capital management
The aim of capital management within BBVA and the Group is to ensure that both BBVA and the Group have the necessary capital at any given time to develop the corporate strategy reflected in the Strategic Plan, in line with the risk profile set out in the Group Risk Appetite Framework.
In this regard, BBVA's capital management is also part of the most relevant forward-looking strategic decisions in the Group's management and monitoring, which include the Annual Budget and the Liquidity and Funding Plan, with which it is coordinated — all with the aim of achieving the Group's overall strategy.
Capital must be allocated optimally in order to meet the need to preserve the solvency of BBVA and the Group at all times. Together with the Group's solvency risk profile included in the RAF, this optimal allocation serves as a guide for the Group's capital management and seeks a solid capital position that makes it possible to:
- Anticipate ordinary and extraordinary consumption that may occur, even under stress;
- Promote the development of the Group's business and align it with capital and profitability objectives by allocating resources appropriately and efficiently;
- Cover all risks—including potential risks—to which it is exposed;
- Comply with regulatory and internal management requirements at all times; and
- Remunerate BBVA shareholders in accordance with the Shareholder Remuneration Policy in force at any given time.
The areas involved in capital management in the Group shall follow and respect the following principles in their respective areas of responsibility:
- Ensuring that capital management is integrated and consistent with the Group's Strategic Plan, RAF, Annual Budget and other strategic-prospective processes, to help achieve the Group's long-term sustainability.
- Taking into account both the applicable regulatory and supervisory requirements and the risks to which the Group is—or may be—exposed when conducting its business (economic vision), when establishing a target capital level, all while adopting a forward-looking vision that takes adverse scenarios into consideration.
- Carrying out efficient capital allocation that promotes good business development, ensuring that expectations for the evolution of activity meet the strategic objectives of the Group and anticipating the ordinary and extraordinary consumption that may occur.
- Ensuring compliance with the solvency levels, including the minimum requirement for own funds and eligible liabilities (MREL), required at any given time.
- Compensating BBVA shareholders in an adequate and sustainable manner.
- Optimizing the cost of all instruments used for the purpose of meeting the target capital level at any given time.
The areas involved in capital management in the Group shall follow and respect the following principles in their respective areas of responsibility:
- Ensuring that capital management is integrated and consistent with the Group's Strategic Plan, RAF, Annual Budget and other strategic-prospective processes, to help achieve the Group's long-term sustainability.
- Taking into account both the applicable regulatory and supervisory requirements and the risks to which the Group is—or may be—exposed when conducting its business (economic vision), when establishing a target capital level, all while adopting a forward-looking vision that takes adverse scenarios into consideration.
- Carrying out efficient capital allocation that promotes good business development, ensuring that expectations for the evolution of activity meet the strategic objectives of the Group and anticipating the ordinary and extraordinary consumption that may occur.
- Ensuring compliance with the solvency levels, including the minimum requirement for own funds and eligible liabilities (MREL), required at any given time.
- Compensating BBVA shareholders in an adequate and sustainable manner.
- Optimizing the cost of all instruments used for the purpose of meeting the target capital level at any given time
To achieve the aforementioned principles, capital management will be based on the following essential elements:
- An adequate governance and management scheme, both at the corporate body level and at the executive level.
- Planning, managing and monitoring capital properly, using the measurement systems, tools, structures, resources and quality data necessary to do so.
- A set of metrics, which is duly updated, to facilitate the tracking of the capital situation and to identify any relevant deviations from the target capital level.
- A transparent, correct, consistent and timely communication and dissemination of capital information outside the Group.
- An internal regulatory body, which is duly updated, including the regulations and procedures that, ensure adequate capital management.
33. Commitments and guarantees given
The breakdown of the balance under these headings in the accompanying consolidated balance sheets is as follows:
Commitments and guarantees given (Millions of Euros)
| Notes | 2021 | 2020 | 2019 | |
|---|---|---|---|---|
| Loan commitments given | 7.2.2 | 119,618 | 132,584 | 130,923 |
| Of which: impaired | 171 | 265 | 270 | |
| Central banks | - | - | - | |
| General governments | 3,483 | 2,919 | 3,117 | |
| Credit institutions | 16,085 | 11,426 | 11,742 | |
| Other financial corporations | 4,583 | 5,862 | 4,578 | |
| Non-financial corporations | 59,475 | 71,011 | 65,475 | |
| Households | 35,991 | 41,366 | 46,011 | |
| Financial guarantees given | 7.2.2 | 11,720 | 10,665 | 10,984 |
| Of which: impaired (*) | 245 | 290 | 224 | |
| Central banks | — | 1 | — | |
| General governments | 162 | 132 | 125 | |
| Credit institutions | 312 | 339 | 995 | |
| Other financial corporations | 1,026 | 587 | 583 | |
| Non-financial corporations | 10,039 | 9,376 | 8,986 | |
| Households | 181 | 231 | 295 | |
| Other commitments given | 7.2.2 | 34,604 | 36,190 | 39,209 |
| Of which: impaired (*) | 541 | 477 | 506 | |
| Central banks | 2 | 124 | 1 | |
| General governments | 212 | 199 | 521 | |
| Credit institutions | 4,266 | 5,285 | 5,952 | |
| Other financial corporations | 1,753 | 2,902 | 2,902 | |
| Non-financial corporations | 28,224 | 27,496 | 29,682 | |
| Households | 147 | 182 | 151 | |
| Total | 7.2.2 | 165,941 | 179,440 | 181,116 |
- (*) In December 2020, it includes the balance of the Group's businesses in the United States included in the USA Sale (see Notes 1.3, 3 and 21). Non-performing financial guarantees given amounted to €786, €767 and €731 million, respectively, as of December 31, 2021, 2020 and 2019.
As of December 31, 2021, the provisions for loan commitments, financial guarantees and other commitments, recorded in the consolidated balance sheet amounted to €272 million, €164 million and €256 million, respectively (see Note 24).
Since a significant portion of the amounts above will expire without any payment being made by the consolidated entities, the aggregate balance of these commitments cannot be considered to be the actual future requirement for financing or liquidity to be provided by the BBVA Group to third parties.
In the years 2021, 2020 and 2019, no issuance of debt securities carried out by associates of the BBVA Group, joint venture entities or non-Group entities have been guaranteed.
34. Other contingent assets and liabilities
As of December 31, 2021, 2020 and 2019 there were no material contingent assets or liabilities other than those disclosed in the accompanying Notes to the consolidated financial statements.
35. Purchase and sale commitments and future payment obligations
The purchase and sale commitments of the BBVA Group are disclosed in Notes 10, 14 and 22.
Future payment obligations mainly correspond to leases payable derived from operating lease contracts, as detailed in Note 22.5, and estimated employee benefit payments, as detailed in Note 25.1.3.
36. Transactions on behalf of third parties
The details of the relevant transactions on behalf of third parties are as follows:
Transactions on behalf of third parties. Breakdown by concepts (Millions of Euros)
| 2021 | 2020 | 2019 | |
|---|---|---|---|
| Financial instruments entrusted to BBVA by third parties | 356,985 | 357,022 | 693,497 |
| Conditional bills and other securities received for collection | 10,795 | 10,459 | 13,133 |
| Securities lending | 2,605 | 5,285 | 7,129 |
| Total | 370,385 | 372,766 | 713,759 |
37. Net interest income
37.1 Interest and other income
The breakdown of the interest and other income recognized in the accompanying consolidated income statement is as follows:
Interest and other income. Breakdown by origin (Millions of Euros)
| 2021 | 2020 | 2019 | |
|---|---|---|---|
| Financial assets held for trading | 1,084 | 1,189 | 2,037 |
| Financial assets designated at fair value through profit or loss | 11 | 8 | 5 |
| Financial assets at fair value through other comprehensive income | 1,880 | 1,392 | 1,629 |
| Financial assets at amortized cost | 18,364 | 18,357 | 22,741 |
| Insurance activity | 1,084 | 1,021 | 1,079 |
| Adjustments of income as a result of hedging transactions | (84) | (112) | (72) |
| Other income (*) | 675 | 534 | 343 |
| Total | 23,015 | 22,389 | 27,762 |
- (*)Includes accrued interest following TLTRO III transactions (see Note 22.1).
The amounts recognized in consolidated equity in connection with hedging derivatives for the years ended December 31, 2021, 2020 and 2019 and the amounts derecognized from the consolidated equity and taken to the consolidated income statements during those years are included in the accompanying “Consolidated statements of recognized income and expense”.
37.2 Interest expense
The breakdown of the balance under this heading in the accompanying consolidated income statements is as follows:
Interest expense. Breakdown by origin (Millions of Euros)
| 2021 | 2020 | 2019 | |
|---|---|---|---|
| Financial liabilities held for trading | 1,339 | 742 | 1,229 |
| Financial liabilities designated at fair value through profit or loss | 52 | 61 | 6 |
| Financial liabilities at amortized cost | 6,130 | 6,346 | 9,953 |
| Adjustments of expense as a result of hedging transactions | (360) | (413) | (250) |
| Insurance activity | 773 | 721 | 753 |
| Cost attributable to pension funds | 52 | 57 | 85 |
| Other expense | 342 | 284 | 196 |
| Total | 8,329 | 7,797 | 11,972 |
38. Dividend income
The balances for this heading in the accompanying consolidated income statements correspond to dividends on shares and equity instruments other than those from shares in entities accounted for using the equity method (see Note 39), as can be seen in the breakdown below:
Dividend Income (Millions of Euros)
| 2021 | 2020 | 2019 | |
|---|---|---|---|
| Non-trading financial assets mandatorily at fair value through profit or loss | 64 | 15 | 26 |
| Financial assets at fair value through other comprehensive income | 112 | 122 | 126 |
| Total | 176 | 137 | 153 |
39. Share of profit or loss of entities accounted for using the equity method
Results from “Share of profit or loss of entities accounted for using the equity method” resulted in a positive impact of €1 million as of December 31, 2021, compared with the negative impact of €39 million and the negative impact of €42 million recorded as of December 31, 2020 and 2019, respectively.
40. Fee and commission income and expense
The breakdown of the balance under these headings in the accompanying consolidated income statements is as follows:
Fee and commission income. Breakdown by origin (Millions of Euros)
| 2021 | 2020 | 2019 | |
|---|---|---|---|
| Bills receivables | 23 | 27 | 39 |
| Demand accounts | 425 | 322 | 301 |
| Credit and debit cards and OPS | 2,628 | 2,089 | 2,862 |
| Checks | 136 | 136 | 198 |
| Transfers and other payment orders | 664 | 555 | 623 |
| Insurance product commissions | 215 | 159 | 158 |
| Loan commitments given | 234 | 185 | 187 |
| Other commitments and financial guarantees given | 364 | 349 | 377 |
| Asset management | 1,250 | 1,100 | 1,026 |
| Securities fees | 267 | 367 | 294 |
| Custody securities | 169 | 135 | 123 |
| Other fees and commissions | 622 | 556 | 599 |
| Total | 6,997 | 5,980 | 6,786 |
The breakdown of fee and commission expense under these heading in the accompanying consolidated income statements is as follows:
Fee and commission expense. Breakdown by origin (Millions of Euros)
| 2021 | 2020 | 2019 | |
|---|---|---|---|
| Demand accounts | 5 | 5 | 6 |
| Credit and debit cards | 1,427 | 1,130 | 1,566 |
| Transfers and other payment orders | 120 | 97 | 81 |
| Commissions for selling insurance | 51 | 54 | 54 |
| Custody securities | 55 | 52 | 30 |
| Other fees and commissions | 574 | 519 | 548 |
| Total | 2,232 | 1,857 | 2,284 |
41. Gains (losses) on financial assets and liabilities, hedge accounting and exchange differences, net
The breakdown of the balance under this heading, by source of the related items, in the accompanying consolidated income statement is as follows:
Gains (losses) on financial assets and liabilities, hedge accounting and exchange differences, net. Breakdown by heading (Millions of Euros)
| 2021 | 2020 | 2019 | |
|---|---|---|---|
| Gains (losses) on derecognition of financial assets and liabilities not measured at fair value through profit or loss, net | 134 | 139 | 186 |
| Financial assets at amortized cost | 27 | 106 | 44 |
| Other financial assets and liabilities | 106 | 33 | 141 |
| Gains (losses) on financial assets and liabilities held for trading, net | 341 | 777 | 419 |
| Reclassification of financial assets from fair value through other comprehensive income | — | — | — |
| Reclassification of financial assets from amortized cost | — | — | — |
| Other gains (losses) | 341 | 777 | 419 |
| Gains (losses) on non-trading financial assets mandatorily at fair value through profit or loss, net | 432 | 208 | 143 |
| Reclassification of financial assets from fair value through other comprehensive income | — | — | — |
| Reclassification of financial assets from amortized cost | — | — | — |
| Other gains (losses) | 432 | 208 | 143 |
| Gains (losses) on financial assets and liabilities designated at fair value through profit or loss, net | 335 | 56 | (98) |
| Gains (losses) from hedge accounting, net | (214) | 7 | 55 |
| Subtotal gains (losses) on financial assets and liabilities | 1,027 | 1,187 | 705 |
| Exchange differences, net | 883 | 359 | 581 |
| Total | 1,910 | 1,546 | 1,286 |
The breakdown of the balance (excluding exchange rate differences) under this heading in the accompanying income statements by the nature of financial instruments is as follows:
Gains (losses) on financial assets and liabilities. Breakdown by nature of the financial instrument (Millions of Euros)
| 2021 | 2020 | 2019 | |
|---|---|---|---|
| Debt instruments | 158 | 848 | 945 |
| Equity instruments | 2,059 | (28) | 1,336 |
| Trading derivatives and hedge accounting | (1,866) | 277 | (1,133) |
| Loans and advances to customers | 100 | 128 | 78 |
| Customer deposits | 55 | (79) | (26) |
| Other | 522 | 42 | (497) |
| Total | 1,027 | 1,187 | 705 |
The breakdown of the balance of the impact of the derivatives (trading and hedging) under this heading in the accompanying consolidated income statements is as follows:
Derivatives - Hedge accounting (Millions of Euros)
| 2021 | 2020 | 2019 | |
|---|---|---|---|
| Derivatives | |||
| Interest rate agreements | 73 | 269 | (85) |
| Securities agreements | (1,500) | (36) | (1,072) |
| Commodity agreements | 3 | 1 | 5 |
| Credit derivative agreements | (255) | (89) | 74 |
| Foreign-exchange agreements | 40 | 88 | (75) |
| Other agreements | (12) | 37 | (35) |
| Subtotal | (1,651) | 270 | (1,187) |
| Hedging derivatives ineffectiveness | |||
| Fair value hedges | (235) | 5 | 55 |
| Hedging derivative | 90 | (151) | (36) |
| Hedged item | (325) | 156 | 91 |
| Cash flow hedges | 21 | 2 | — |
| Subtotal | (214) | 7 | 55 |
| Total | (1,866) | 277 | (1,133) |
In addition, in the years ended December 31, 2021, 2020 and 2019, under the heading “Exchange differences, net" in the accompanying consolidated income statements negative amounts of € 41 million, €57 million and €225 million, respectively, were recognized for transactions with foreign exchange trading derivatives.
42. Other operating income and expense
The breakdown of the balance under the heading “Other operating income” in the accompanying consolidated income statements is as follows:
Other operating income (Millions of Euros)
| 2021 | 2020 | 2019 | |
|---|---|---|---|
| Gains from sales of non-financial services | 301 | 244 | 258 |
| Hyperinflation adjustment (*) | 177 | 94 | 146 |
| Other operating income | 183 | 154 | 235 |
| Total | 661 | 492 | 639 |
(*) See Note 2.2.19.
The breakdown of the balance under the heading “Other operating expense” in the accompanying consolidated income statements is as follows:
Other operating expense (Millions of Euros)
| 2021 | 2020 | 2019 | |
|---|---|---|---|
| Change in inventories | 151 | 124 | 107 |
| Contributions to guaranteed banks deposits funds | 829 | 800 | 746 |
| Hyperinflation adjustment (*) | 585 | 348 | 538 |
| Other operating expense | 475 | 390 | 551 |
| Total | 2,041 | 1,662 | 1,943 |
(*) See Note 2.2.19.
43. Income and expense from insurance and reinsurance contracts
The detail of the headings “Income and expense from insurance and reinsurance contracts” in the accompanying consolidated income statements is as follows:
Income and expense from insurance and reinsurance contracts (Millions of Euros)
| 2021 | 2020 | 2019 | |
|---|---|---|---|
| Income from insurance and reinsurance contracts | 2,593 | 2,497 | 2,890 |
| Expense from insurance and reinsurance contracts | (1,685) | (1,520) | (1,751) |
| Total | 908 | 977 | 1,138 |
The table below shows the contribution of each insurance product to the Group ́s income for the years ended December 31, 2021, 2020 and 2019:
Income by type of insurance product (Millions of Euros)
| 2021 | 2020 | 2019 | |
|---|---|---|---|
| Life insurance | 622 | 497 | 631 |
| Individual | 583 | 439 | 477 |
| Group insurance | 39 | 59 | 154 |
| Non-Life insurance | 286 | 480 | 508 |
| Home insurance | — | 91 | 90 |
| Other non-life insurance products | 286 | 389 | 418 |
| Total | 908 | 977 | 1,138 |
44. Administration costs
44.1 Personnel expense
The breakdown of the balance under this heading in the accompanying consolidated income statements is as follows:
Personnel expense (Millions of Euros)
44.1.1 Share-based employee remuneration
The amounts recognized under the heading “Administration costs - Personnel expense - Other personnel expense” in the consolidated income statements for the year ended December 31, 2021, 2020 and 2019, corresponding to the remuneration plans based on equity instruments in each year, amounted to €33 million, €16 million and €31 million, respectively. These amounts have been recognized with a corresponding entry under the heading “Shareholders’ funds - Other equity instruments” in the accompanying consolidated balance sheets, net of tax effect.
The characteristics of the Group's remuneration plans based on equity instruments are described below.
Variable remuneration in shares
BBVA has a specific remuneration scheme applicable to those employees whose professional activities have a material impact on the risk profile of BBVA and/or its Group (hereinafter “Identified Staff”) involving the delivery of BBVA shares, designed within the framework of applicable regulations to credit institutions and considering best practices and recommendations at the local and international levels in this matter.
In 2021, this remuneration scheme is reflected in the following remuneration policies:
- BBVA Group General Remuneration Policy, approved by the Board of Directors on June 30, 2021, that applies to employees and senior managers at BBVA (excluding BBVA executive directors) and at Group companies with respect to which BBVA exercises control over management. This policy includes the specific rules applicable to the members of the Identified Staff, including Senior Management.
- BBVA Directors’ Remuneration Policy, approved by the General Shareholders’ Meeting of BBVA held on April 20, 2021, that it’s applicable to the members of the Board of Directors of BBVA. The remuneration system for executive directors corresponds, generally, with the applicable system to the Identified Staff, incorporating some particularities of their own, derived from their condition of directors.
The variable remuneration for the Identified Staff members is subject to the following rules established in their corresponding remuneration policies, specifically:
- Annual Variable Remuneration for Identified Staff members for each financial year will be subject to ex ante adjustments, so that it shall be reduced at the time of their appraisal in the event of a downturn in the Group’s results or other parameters such as the level of achievement of budgeted targets, and it will not accrue or it will accrue in a reduced amount, should a certain level of profits and capital ratio not be achieved in accordance with the provisions of applicable regulations at any given time.
- 60% of the Annual Variable Remuneration will be vested and paid, if conditions are met, as a general rule, in the first four months of the financial year following that to which the Annual Variable Remuneration corresponds (the “Upfront Portion”). For executive directors, members of the Senior Management and Identified Staff members with particularly high variable remuneration, the Upfront Portion will be 40% of the Annual Variable Remuneration. The remaining portion will be deferred in time (hereinafter, the “Deferred Portion”) for a 5 year-period for executive directors and members of the Senior Management, and 4 years for the remaining members of the Identified Staff.
- 50% of the Annual Variable Remuneration, including both the Upfront Portion and the Deferred Portion, shall be established in BBVA shares or in instruments linked to BBVA shares. As regards executive directors and Senior Management, 60% of the Deferred Portion shall be established in shares.
- The shares or instruments awarded as Annual Variable Remuneration, both from the Upfront Portion and the Deferred Portion, shall be withheld for a one-year period after delivery. This will not apply to those shares or instruments the sale of which would be required to honor the payment of taxes accruing on delivery.
- The Deferred Portion of the Annual Variable Remuneration may be reduced, but never increased, depending on the results of multi-year performance indicators which are aligned with the Group’s core risk management and control metrics related to the solvency, liquidity, profitability or value creation.
- The cash amounts of the Deferred Portion of Annual Variable Remuneration finally vested, shall be updated by applying the Consumer Price Index (CPI), measured as year-on-year change in prices, or any other criteria established for such purposes by the Board of Directors.
- The entire Annual Variable Remuneration corresponding to each financial year shall be subject to arrangements for the reduction of variable remuneration ("malus") and arrangements for the recovery of variable remuneration already paid ("clawback") during the whole deferral and withholding period, which will be applicable in the event of the occurrence of any of the circumstances expressly named in the remuneration policies.
- No personal hedging strategies or insurances shall be used in connection with variable remuneration or liability that may undermine the effects of alignment with prudent risk management.
- The variable component of the remuneration for a financial year (understood as the sum of all variable components of the remuneration) shall be limited to a maximum amount of 100% of the fixed component of the total remuneration (understood as the sum of all fixed components of the remuneration), unless the General Shareholders' Meeting of BBVA resolves to increase this percentage up to a maximum of 200%.
In this regard, the General Shareholders’ Meeting of BBVA held on April 20, 2021 resolved to increase this limit to a maximum level of 200% of the fixed component of the total remuneration for a given number of the Identified Staff members, in the terms indicated in the report issued for this purpose by the Board of Directors dated March 15, 2021. - Any type of remuneration, other than Annual Variable Remuneration, considered to be variable remuneration shall be subject to the rules regarding award, vesting and payment applicable in accordance with the type and nature of the remuneration component itself.
During 2021, in accordance with the applicable remuneration policies, a total amount of 2,945,689 BBVA shares corresponding to the Upfront Portion of 2020 Annual Variable Remuneration, mostly, and other variable components of remuneration, has been delivered to the Identified Staff.
Additionally, according to the Remuneration Policy applicable in 2017, during 2021 a total amount of 2,965,487 BBVA shares corresponding to the first payment of the Deferred Portion of 2017 Annual Variable Remuneration of executive directors and Senior Management and to the full Deferred Portion of the 2017 Annual Variable Remuneration of the rest of the Identified Staff, has been delivered.
Detailed information on the delivery of shares to executive directors and Senior Management of BBVA who held this position as of December 31, 2021, is included in Note 54.
Lastly, in line with specific regulation applicable in Portugal and Brazil, BBVA IFIC and BBVA Brazil Banco de Investimento have identified (on an individual basis, respectively) the staff in these countries whose annual variable remuneration should be subject to a specific settlement and payment scheme established in their corresponding remuneration policies, more specifically:
- A percentage of the annual variable remuneration is subject to a three years deferral that shall be paid yearly over the mentioned period.
- 50% of the annual variable remuneration, both the upfront portion and deferred portion, shall be established in BBVA shares.
- In BBVA IFIC, resulting cash portions of the deferred portion of annual variable remuneration and subject to multi-year performance indicators, finally delivered, shall be updated following the Consumer Price Index (CPI) measured as year-on- year price variation.
- In BBVA Brasil Banco de Investimento, both the cash amounts and share amounts of the deferred portion may be subject to update adjustments in cash.
According to this remuneration scheme, during financial year 2021 a total of 15,802 BBVA shares corresponding to the upfront portion of 2020 annual variable remuneration have been delivered to these staff in Portugal and Brazil.
Additionally, during 2021 there have been delivered to these staff in Portugal and Brazil a total of 4,422 BBVA shares corresponding to the first third of the deferred portion of 2019 annual variable remuneration, as well as 332 euros as adjustments for updates (for shares delivered in Brazil). A total of 5,083 BBVA shares corresponding to the second third of the deferred portion of 2018 annual variable remuneration and 1,097 euros as adjustments for updates (for shares delivered in Brazil); and a total of 9,558 BBVA shares corresponding to the last third of the deferred portion of 2017 annual variable remuneration and 1,118 euros as adjustments for updates (for shares delivered in Brazil).
44.2 Other administrative expense
The breakdown of the balance under this heading in the accompanying consolidated income statements is as follows:
Other administrative expense. Breakdown by main concepts (Millions of Euros)
| 2021 | 2020 | 2019 | |
|---|---|---|---|
| Technology and systems | 1,176 | 1,088 | 1,060 |
| Communications | 175 | 172 | 181 |
| Advertising | 207 | 186 | 250 |
| Property, fixtures and materials | 380 | 404 | 477 |
| Taxes other than income tax | 347 | 344 | 378 |
| Surveillance and cash courier services | 179 | 161 | 188 |
| Other expense | 786 | 749 | 885 |
| Total | 3,249 | 3,105 | 3,418 |
45. Depreciation and amortization
The breakdown of the balance under this heading in the accompanying consolidated income statements for the years ended December 31, 2021, 2020 and 2019 is as follows:
Depreciation and amortization (Millions of Euros)
46. Provisions or reversal of provisions
For the years ended December 31, 2021, 2020 and 2019, the net provisions recognized in this income statement line item were as follows:
Provisions or reversal of provisions (Millions of Euros)
| Notes | 2021 | 2020 | 2019 | |
|---|---|---|---|---|
| Pensions and other post employment defined benefit obligations | 25 | 61 | 210 | 213 |
| Commitments and guarantees given | 8 | 192 | 96 | |
| Pending legal issues and tax litigation | 135 | 208 | 171 | |
| Other provisions (*) | 814 | 136 | 133 | |
| Total | 1,018 | 746 | 614 |
- (*) In 2021, it includes a provision for the agreement with the union representatives on the collective layoff procedure proposed for Banco Bilbao Vizcaya Argentaria, S.A. in Spain (see Note 24).
47. Impairment or reversal of impairment on financial assets not measured at fair value through profit or loss or net gains by modification
The breakdown of impairment or reversal of impairment on financial assets not measured at fair value through profit or loss or net gains by modification by the nature of those assets in the accompanying consolidated income statements is as follows:
Impairment or reversal of impairment on financial assets not measured at fair value through profit or loss or net gains by modification (Millions of Euros)
| Notes | 2021 | 2020 | 2019 | |
|---|---|---|---|---|
| Financial assets at fair value through other comprehensive income - Debt securities | 17 | 19 | 82 | |
| Financial assets at amortized cost (*) | 3,017 | 5,160 | 3,470 | |
| Of which: Recovery of written-off assets | 7.2.5 | (423) | (339) | (919) |
| Total | 3,034 | 5,179 | 3,552 |
- (*) In 2020, the amount included the negative impact of the update of the macroeconomic scenario following the COVID-19 pandemic (see Notes 1.5, 7.1 and 7.2)
48. Impairment or reversal of impairment of investments in joint ventures and associates
The heading “Impairment or reversal of the impairment of investments in joint ventures or associates" did not include any impairment or reversal of impairment in the year ended 2021, and resulted in a loss of €190 million and €46 million for the years ended December 31, 2020 and 2019, respectively (see Note 16.3).
49. Impairment or reversal of impairment on non-financial assets
The impairment losses on non-financial assets broken down by the nature of those assets in the accompanying consolidated income statements are as follows:
Impairment or reversal of impairment on non-financial assets (Millions of Euros)
| Notes | 2021 | 2020 | 2019 | |
|---|---|---|---|---|
| Tangible assets (*) | 17 | 161 | 125 | 94 |
| Intangible assets | 19 | 19 | 12 | |
| Others | 41 | 9 | 23 | |
| Total | 221 | 153 | 128 |
- (*) In 2021, it includes the impairment due to the clos ing of rented offices after the agreement with the union representatives on the collective layoff procedure proposed for Banco Bilbao Vizcaya Argentaria, S.A. in Spain (see Notes 17 and 24).
50. Gains (losses) from non-current assets and disposal groups classified as held for sale not qualifying as discontinued operations
The main items included in the balance under this heading in the accompanying consolidated income statements are as follows:
Gains (losses) from non-current assets and disposal groups classified as held for sale not qualifying as discontinued operations (Millions of Euros)
| Notes | 2021 | 2020 | 2019 | |
|---|---|---|---|---|
| Gains on sale of real estate | 39 | 116 | 86 | |
| Impairment of non-current assets held for sale (*) | 21 | (97) | (103) | (72) |
| Gains (losses) on sale of investments classified as non-current assets held for sale (**) | 10 | 431 | 10 | |
| Gains on sale of equity instruments classified as non-current assets held for sale | 8 | — | — | |
| Total | (40) | 444 | 23 |
- (*) In 2021, it includes the impairment due to the clos ing of owned offices and the decommissioning of facilities after the agreement with the union representatives on the collective layoff procedure proposed for Banco Bilbao Vizcaya Argentaria, S.A. in Spain (see Notes 21 and 24).
- (**) The variation in year 2020 is mainly due to the transfer of half plus one share in BBVA Allianz Seguros y Reaseguros, S.A. (see Note 3).
51. Consolidated statements of cash flows
The variation between 2021, 2020 and 2019 of the financial liabilities from financing activities is the following:
Liabilities from financing activities. December 2021 (Millions of Euros)
| December 31, 2020 |
Cash flows | Non-cash changes | December 31, 2021 |
|||||
|---|---|---|---|---|---|---|---|---|
| Acquisition | Disposal | Disposals by companies held for sale | Foreign exchange movement | Fair value changes | ||||
| Liabilities at amortized cost: Debt certificates | 61,780 | (5,728) | — | — | — | (289) | — | 55,763 |
| Of which: Issuances of subordinated liabilities (*) | 17,248 | (1,941) | — | (772) | — | 259 | — | 14,794 |
- (*) Additionally, there is €14 million of subordinated deposits as of December 31, 2021 (see Note 22.4 and Appendix VI). The subordinated issuances of BBVA Paraguay and of the USA Sale perimeter as of December 31, 2020 were recorded in the heading "Liabilities included in disposal groups classified as held for sale" of the consolidated balance and amounted to €37 and €735 million, respectively. In addition, in 2021 there were coupon payments of subordinated liabilities for 359 million euros.
Liabilities from financing activities. December 2020 (Millions of Euros)
| December 31, 2019 | Cash flows | Non-cash changes | December 31, 2020 | |||||
|---|---|---|---|---|---|---|---|---|
| Acquisition | Disposal | Disposals by companies held | Foreign exchange movement | Fair value changes | ||||
| Liabilities at amortized cost: Debt certificates | 63,963 | 3,003 | - | - | (3,160) | (2,026) | - | 61,780 |
| Of which: Issuances of subordinated liabilities (*) | 17,675 | (8) | - | - | - | (419) | - | 17,248 |
- (*) Additionally, there were €12 million of subordinated deposits as of December 31, 2020 (see Note 22.4 and Appendix VI). The subordinated issuances of BBVA Paraguay and of the USA Sale perimeter as of December 31, 2020 were recorded in the heading "Liabilities included in disposal groups classified as held for sale" of the consolidated balance and amounted to €37 and €735 million, respectivel y. In addition, in 2020 there were coupon payments of subordinated liabilities for 387 million euro.
- (**) Includes mainly the balance of the USA Sale perimeter (see Notes 1.3, 3 and 21).
Liabilities from financing activities. December 2019 (Millions of Euros)
| December 31, 2018 | Cash flows | Non-cash changes | December 31, 2019 | ||||
|---|---|---|---|---|---|---|---|
| Acquisition | Disposal | Foreign exchange movement | Fair value changes | ||||
| Liabilities at amortized cost: Debt certificates | 61,112 | 2,643 | — | — | 209 | — | 63,963 |
| Of which: Issuances of subordinated liabilities (*) | 17,635 | (190) | - | - | 229 | - | 17,675 |
- (*)Additionally, there were subordinated deposits for €384 million as of December 31, 2019 (see Note 22.4 and Appendix VI).
- Subordinated issuances corresponding to BBVA Paraguay as of December 31, 2019 were recorded in the heading "Liabilities included in disposal groups classified as held for sale" and amounted to €40 million.
52. Accountant fees and services
The details of the fees for the services contracted by entities of the BBVA Group for the years ended December 31, 2021, 2020 and 2019 with their respective auditors and other audit entities are as follows:
Fees for Audits conducted and other related services (*) (Millions of euros) (**)
| 2021 | 2020 | 2019 | |
|---|---|---|---|
| Audits of the companies audited by firms belonging to the KPMG worldwide organization and other reports related with the audit (**) | 24.4 | 27.7 | 28.1 |
| Other reports required pursuant to applicable legislation and tax regulations issued by the national supervisory bodies of the countries in which the Group operates, reviewed by firms belonging to the KPMG worldwide organization | 1.5 | 1.3 | 1.5 |
| Fees for audits conducted by other firms | 0.2 | 0.2 | — |
- (*) Regardless of the billed year.
- (**) Including fees pertaining to annual legal audits (€21.0, €23.6 and €24.1 million as of December 31, 2021, 2020 and 2019, respectively).
In the years ended December 31, 2021, 2020 and 2019, certain entities in the BBVA Group contracted other services (other than audits) as follows:
Other Services rendered (Millions of Euros)
| 2021 | 2020 | 2019 | |
|---|---|---|---|
| Firms belonging to the KPMG worldwide organization | 0.2 | 0.4 | 0.3 |
This total of contracted services includes the detail of the services provided by KPMG Auditores, S.L. to BBVA, S.A. or its controlled companies at the date of preparation of these consolidated financial statements as follows:
Fees for Audits Conducted (*) (Millions of Euros)
| 2021 | 2020 | 2019 | |
|---|---|---|---|
| Legal audit of BBVA, S.A. or its companies under control | 7.2 | 6.5 | 6.5 |
| Other audit services of BBVA, S.A. or its companies under control | 5.2 | 5.4 | 5.5 |
| Limited Review of BBVA, S.A. or its companies under control | 0.9 | 0.9 | 0.9 |
| Reports related to issuances | 0.1 | 0.3 | 0.3 |
| Assurance services and other required by the regulator | 0.8 | 0.9 | 0.8 |
- (*) Services provided by KPMG Auditores, S.L. to companies located in Spain, to the branch of BBVA in New York and to the branch of BBVA in London.
The services provided by the auditors meet the independence requirements of the external auditor established under Audit of Accounts Law (Law 22/2015) and under the Sarbanes-Oxley Act of 2002 adopted by the Securities and Exchange Commission (SEC).
53. Related-party transactions
As financial institutions, BBVA and other entities in the Group engage in transactions with related parties in the normal course of their business. These transactions are not significant and are carried out under normal market conditions. As of December 31, 2021, 2020 and 2019, the following are the transactions with related parties:
53.1 Transactions with significant shareholders
As of December 31, 2021, 2020 and 2019, there were no shareholders considered significant (see Note 26).
53.2 Transactions with BBVA Group entities
The balances of the main captions in the accompanying consolidated balance sheets arising from the transactions carried out by the BBVA Group with associates and joint venture entities accounted for using the equity method are as follows:
Balances arising from transactions with entities of the Group (Millions of Euros)
| 2021 | 2020 | 2019 | |
|---|---|---|---|
| Assets | |||
| Loans and advances to credit institutions | 9 | 148 | 26 |
| Loans and advances to customers | 2,031 | 1,743 | 1,682 |
| Liabilities | |||
| Deposits from credit institutions | 1 | — | 3 |
| Customer deposits | 296 | 791 | 453 |
| Memorandum accounts | - | ||
| Financial guarantees given | 154 | 132 | 166 |
| Other contingent commitments given | 1,056 | 1,400 | 1,042 |
| Loan commitments given | 11 | 11 | 106 |
The balances of the main captions in the accompanying consolidated income statements resulting from transactions with associates and joint venture entities that are accounted for under the equity method are as follows:
Balances of consolidated income statement arising from transactions with entities of the Group (Millions of Euros)
| 2021 | 2020 | 2019 | |
|---|---|---|---|
| Income statement | |||
| Interest and other income | 16 | 20 | 19 |
| Interest expense | - | 1 | 1 |
| Fee and commission income | 8 | 5 | 4 |
| Fee and commission expense | 31 | 34 | 53 |
There were no other material effects in the consolidated financial statements arising from dealings with these entities, other than the effects from using the equity method (see Note 2.1) and from the insurance policies to cover pension or similar commitments (see Note 25) and the derivatives transactions arranged by BBVA Group with these entities, associates and joint ventures.
In addition, as part of its normal activity, the BBVA Group has entered into agreements and commitments of various types with shareholders of subsidiaries and associates, which have no material effects on the accompanying consolidated financial statements.
53.3 Transactions with members of the Board of Directors and Senior Management
Pursuant to the provisions of the Corporate Enterprises Act, the power to approve transactions that the Company or its subsidiaries conclude with members of the Board of Directors or Senior Management of the Bank or their related parties rests on the General Shareholders’ Meeting if the amount or value of the transaction is equal to or exceeds 10% of total asset items according to the last approved annual balance sheet and, on the Board of Directors, in relation to the rest of related party transactions entered into, which may not be delegated, except for transactions that comply with the requirements of the Corporate Enterprises Act.
The Regulations of the Board of Directors establish that the Board of Directors will be responsible for approving, where appropriate, transactions between the Company or companies within its Group and directors or their related parties. In addition, in accordance with specific sectoral regulations, with regard to transactions with related parties, are governed by Royal Decree 84/2015 of 13 February, implementing Act 10/2014 of 26 June, on the regulation, supervision and solvency of credit institutions, and Bank of Spain Circular 2/2016 of 2 February, on the supervision and solvency of credit institutions, the Bank has specific internal regulations in this regard, which specifically govern the process of granting and approving credit risk transactions for members of BBVA Board of Directors and Senior Management, the approval of which lies with the Bank Board of Directors, and for their related parties.
The transactions entered into between BBVA or its Group companies with members of the Board of Directors and Senior Management of the Bank or their related parties were within the scope of the ordinary course of business of the Bank and were immaterial, defined as transactions the disclosure of which is not necessary to present a true and fair view of the Bank's equity, financial position and results, and were concluded on normal markets terms or on terms applicable to the rest of employees.
The amount and nature of the main transactions carried out with members of the Board of Directors and Senior Management of the Bank, or their respective related parties, are shown below.
Balance at 31st December of each year (EUR thousand)
| 2021 | 2020 | 2019 | ||||||||||
|---|---|---|---|---|---|---|---|---|---|---|---|---|
| Directors | Related parties of Directors |
Senior Management (*) |
Related parties of Senior Management |
Directors | Related parties of Directors |
Senior Management (*) |
Related parties of Senior Management |
Directors | Related parties of Directors |
Senior Management (*) |
Related parties of Senior Management |
|
| Loans and credits | 765 | 207 | 5,419 | 573 | — | — | 5,349 | 580 | 607 | — | 4,414 | 57 |
| Bank guarantees | — | — | 10 | — | — | — | 10 | 25 | — | — | 10 | 25 |
| Business credit | — | — | — | — | — | — | — | — | — | — | — | — |
- *Excluding executive directors
- Information on remuneration paid and other benefits granted to members of the Board of Directors and Senior Management of BBVA is provided in Note 54.
Information on remuneration paid and other benefits granted to members of the Board of Directors and Senior Management of BBVA is provided in Note 54.
53.4 Transactions with other related parties
As of December 31, 2021, 2020 and 2019 the Group has not carried out operations with other related parties that do not belong to the line of business or ordinary traffic of its activity, that are not carried out under normal market conditions and that are not of low relevance; understanding by such those whose information is not necessary to give the true image of the assets, the financial situation and the results, consolidated, of the BBVA Group.
54. Remuneration and other benefits for the Board of Directors and members of the Bank's Senior Management
- Remuneration received by non-executive directors in 2021
The remuneration paid to non-executive members of the Board of Directors during the 2021 financial year is indicated below, individualized and itemized:
Remuneration for non-executive directors (Thousands of Euros)
| Board of Directors | Executive Committee | Audit Committee | Risk and Compliance Committee | Remunerations Committee | Appointments and Corporate Governance Committee | Technology and Cybersecurity Committee | Other positions (1) | Total | |
|---|---|---|---|---|---|---|---|---|---|
| José Miguel Andrés Torrecillas | 129 | 167 | 66 | 115 | 50 | 527 | |||
| Jaime Caruana Lacorte | 129 | 167 | 165 | 107 | 567 | ||||
| Raúl Galamba de Oliveira | 129 | 107 | 43 | 278 | |||||
| Belén Garijo López | 129 | 66 | 107 | 46 | 349 | ||||
| Sunir Kumar Kapoor | 129 | 43 | 172 | ||||||
| Lourdes Máiz Carro | 129 | 66 | 43 | 238 | |||||
| José Maldonado Ramos | 129 | 167 | 46 | 342 | |||||
| Ana Peralta Moreno | 129 | 66 | 43 | 238 | |||||
| Juan Pi Llorens | 129 | 214 | 46 | 43 | 80 | 512 | |||
| Ana Revenga Shanklin | 129 | 107 | 236 | ||||||
| Susana Rodríguez Vidarte | 129 | 167 | 107 | 46 | 449 | ||||
| Carlos Salazar Lomelín | 129 | 43 | 172 | ||||||
| Jan Verplancke | 129 | 43 | 43 | 214 | |||||
| Total (2) | 1,673 | 667 | 431 | 642 | 278 | 301 | 171 | 130 | 4,293 |
- (1) Amounts received during the 2021 financial year by José Miguel Andrés Torrecillas, in his capacity as Deputy Chair of the Board of Directors, and by Juan Pi Llorens, in his capacity as Lead Director.
- (2) Includes amounts corresponding to membership on the Board and its various committees during the 2021 financial year.
Also, during the 2021 financial year, €102 thousand was paid out in casualty and healthcare insurance premiums for non-executive directors.
Remuneration received by executive directors in 2021
During the 2021 financial year, the executive directors received the amount of Annual Fixed Remuneration corresponding to that financial year, established for each director in the BBVA Directors' Remuneration Policy, which was approved by the General Meeting held on 20 April 2021 .
In view of the exceptional circumstances arising from the COVID-19 crisis, the executive directors voluntarily waived the generation of all Annual Variable Remuneration (AVR) corresponding to the 2020 financial year, and as such, they did not accrue any remuneration in this respect.
2021 Annual Fixed Remuneration (thousands of Euros)
| Chairman | 2,924 |
| Chief Executive Officer | 2,179 |
| Total | 5,103 |
In addition, in accordance with the conditions established in the BBVA Directors' Remuneration Policy, during the 2021 financial year, the Chief Executive Officer received €654 thousand for the cash in lieu of pension item (equivalent to 30% of his Annual Fixed Remuneration)—given that he does not have a retirement pension (see the "Pension commitments" section of this Note), and €600 thousand for the mobility allowance item.
2020 Annual Variable Remuneration
| In cash (thousands of Euros) | In shares | |
|---|---|---|
| Chairman | 0 | 0 |
| Chief Executive Officer | 0 | 0 |
| Total | 0 | 0 |
In accordance with the remuneration policies applicable in 2017 and in application of the settlement and payment system for the Annual Variable Remuneration for said financial year, in 2021, the executive directors have received, the portion of the Deferred Annual Variable Remuneration for the 2017 financial year (60% of the total AVR) payable in 2021 (60% of the Deferred Portion in the case of the Chairman and the entire Deferred Portion in the case of the Chief Executive Officer), after it was determined that no downward adjustment had to be made, based on the result of the multi-year performance indicators approved for such remuneration. In the case of the Chairman, 40% of this remuneration was paid in cash and 60% in shares; and in the case of the Chief Executive Officer, this remuneration was paid in equal parts cash and shares, together, in both cases, with the corresponding update in cash, thus concluding the payment of the Chief Executive Officer's Annual Variable Remuneration for the 2017 financial year.
Deferred Annual Variable Remuneration for previous financial years (1)
| In cash (thousands of Euros) | In shares | |
|---|---|---|
| Chairman | 411 | 83,692 |
| Chief Executive Officer | 307 | 39,796 |
| Total | 717 | 123,488 |
- (1) Remuneration corresponding to the Deferred AVR for the 2017 financial year payable in 2021, together with its update in cash. The Deferred AVR of the Chairman and the Chief Executive Officer for the 2017 financial year is associated with their previous positions as Chief Executive Officer and President & CEO of BBVA USA, respectively.
In addition, the executive directors received remuneration in kind during the 2021 financial year, including insurance premiums and others, amounting to an aggregate total of €486 thousand, of which €328 thousand corresponds to the Chairman and €158 thousand to the Chief Executive Officer.
Remuneration received by Senior Management in 2021
During the 2021 financial year, the members of Senior Management, excluding executive directors, received the amount of the Annual Fixed Remuneration corresponding to that financial year.
As in the case of the executive directors, the members of Senior Management did not accrue any Annual Variable Remuneration for the 2020 financial year, given that, in view of the exceptional circumstances arising from the COVID-19 crisis, they all voluntarily waived its accrual.
The remuneration paid during the 2021 financial year to members of Senior Management as a whole, who held that position as at 31 December 2021 (16 members, excluding executive directors), is itemized by remuneration item below:
2021 Annual Fixed Remuneration
| Senior Management total | 16,435 |
|---|
2020 Annual Variable Remuneration
| In cash (thousands of Euros) |
In shares | |
|---|---|---|
| Senior Management total | 0 | 0 |
Even though the members of Senior Management have not accrued any amount corresponding to 2020 Annual Variable Remuneration as they waived it, two members of Senior Management have received in 2021 variable remunerations corresponding to retention bonuses derived from their former positions. Therefore, in accordance with the BBVA Group General Remuneration Policy, which is applicable to the members of Senior Management, retention bonuses are considered variable remuneration and comply with applicable rules regarding payment in shares, deferral, ex post adjustments and malus and clawback arrangements established in such Policy for the Annual Variable Remuneration. The variable remunerations received in this regard in 2021 by the members of Senior Management amount to a total aggregate amount of €862 thousand and 203,834 BBVA shares.
In accordance with the remuneration policy for this group applicable in 2017 and in application of the settlement and payment system for the Annual Variable Remuneration for said financial year, in 2021, the members of Senior Management who were beneficiaries of such remuneration received the portion of the Deferred Annual Variable Remuneration for the 2017 financial year payable in 2021, after it was determined that no downward adjustment had to be made, based on the result of the multi-year performance indicators approved for such remuneration. In accordance with the remuneration policy applicable in 2017, current members of Senior Management who held such a position in the 2017 financial year were paid 40% of this remuneration in cash and 60% in shares, while, in the case of members who did not hold such a position in the 2017 financial year, this remuneration was paid in equal parts cash and shares. In both cases, the corresponding update in cash was included. This payment concluded the payment of the Annual Variable Remuneration for the 2017 financial year to the members of Senior Management who, while being members of the Identified Staff, were not members of Senior Management in that financial year.
Annual Variable Remuneration corresponding to previous financial years (1)
| In cash (thousands of Euros) |
In shares | |
|---|---|---|
| Senior Management total | 667 | 119,313 |
- (1) Remuneration corresponding to the Deferred AVR for the 2017 financial year payable in 2021, in the case of members of Senior Management who were beneficiaries, together with its update in cash.
In addition, all members of Senior Management, excluding executive directors, received remuneration in kind during the 2021 financial year, including insurance premiums and others, amounting to a total of €1,409 thousand.
Remuneration of executive directors due in 2022 and subsequent financial years
- Annual Variable Remuneration for executive directors for the 2021 financial year
Following the end of the 2021 financial year, the amount corresponding to the Annual Variable Remuneration of executive directors for said financial year was determined, applying the calculation rules set out in the BBVA Directors' Remuneration Policy approved by the General Meeting held on 20 April 2021, in which it is also established that the remuneration will be subject to the following vesting and payment rules:
- The Upfront Portion (40% of the 2021 Annual Variable Remuneration) will be paid, provided that the applicable conditions are met, during the first quarter of the 2022 financial year, in equal parts cash and shares, amounting to: €849 thousand and 159,235 BBVA shares in the case of the Chairman, and €645 thousand and 120,977 BBVA shares in the case of the Chief Executive Officer.
- The remaining 60% of the 2021 Annual Variable Remuneration will be deferred (40% in cash and 60% in shares) for a period of five years (Deferred Portion) and paid, provided that the applicable conditions are met, proportionally at the end of each year for each of the five years of deferral, in an amount equal to 20% of the Deferred Portion each year: 20% in 2023, 20% in 2024, 20% in 2025, 20% in 2026 and 20% in 2027. The Deferred Portion may be reduced, but never increased, based on the result of the multi-year performance indicators determined by the Board of Directors, on the proposal of the Remuneration Committee and following analysis by the Risk and Compliance Committee, at the beginning of the 2021 financial year. Following the end of the financial year corresponding to the third year of deferral, the result of the multi-year performance indicators will determine the application of the ex post adjustments that, if appropriate, should be made to the outstanding amount of the Deferred Portion. All of this is subject to the vesting and payment rules provided for in the BBVA Directors' Remuneration Policy.
- Moreover, the rest of the rules set forth in the BBVA Directors’ Remuneration Policy regarding the Annual Variable Remuneration of executive directors will be applicable to 2021 Annual Variable Remuneration, including: (i) a withholding period of one year after delivery of the BBVA shares received; (ii) the prohibition of using personal hedging strategies or insurance that may undermine the effects of alignment with prudent risk management; (iii) update criteria for the Deferred Portion in cash; (iv) malus and clawback arrangements during the whole deferral and withholding period; and (v) the limitation of variable remuneration up to a maximum amount of 200% of the fixed component of the total remuneration, as resolved by the General Meeting held on 2021.
- Deferred Annual Variable Remuneration for executive directors for the 2018 financial year
Following the end of the 2021 financial year, the Deferred Annual Variable Remuneration for the 2018 financial year of executive directors, due to be delivered in 2022, provided that the applicable conditions are met, to executive directors, in the percentages applicable in each case in accordance with the payment schedule established in the remuneration policies in effect in the 2018 financial year and applicable to each of them, was determined.
Therefore, the final amount of the Deferred Annual Variable Remuneration for the 2018 financial year was determined, which has been adjusted downwards based on the result of the multi-year performance indicators set by the Board of Directors in 2018 for its calculation and in application of the corresponding scales of achievement and their corresponding targets and weightings. In addition, the amount of the 2018 Deferred Annual Variable Remuneration of executive directors payable in 2022 (60% of the Deferred Portion of the 2018 AVR in the case of the Chairman and the entire 2018 Deferred AVR in the case of the Chief Executive Officer) was determined in the amount of €364 thousand and 107,386 BBVA shares in the case of the Chairman, and €332 thousand and 61,282 BBVA shares in the case of the Chief Executive Officer. In both cases, this includes the corresponding updates in cash.
- Deferred Annual Variable Remuneration for executive directors for the 2017 financial year
Following the close of the 2020 financial year, the Deferred Annual Variable Remuneration for the 2017 financial year of executive directors, due to be delivered in 2021, provided that the applicable conditions were met, to executive directors, in the percentages applicable in each case in accordance with the payment schedule established in the remuneration policies in effect in the 2017 financial year and applicable to each of them, was determined.
Thus, based on the result of each of the multi-year performance indicators set by the Board of Directors in 2017 to calculate the Deferred Portion of this remuneration, and in application of the corresponding scales of achievement and their corresponding targets and weightings, the final amount of the Deferred Annual Variable Remuneration for the 2017 financial year for executive directors was determined and the amounts due to be paid in 2021 were paid (60% of his Deferred Annual Variable Remuneration for the 2017 financial year in the case of the Chairman, and the whole of it in the case of the Chief Executive Officer); all of which was reported in that financial year.
In 2022, the second payment (20%) of the 2017 Deferred AVR, which was determined to amount to €146 thousand and 27,898 BBVA shares, is due to the Chairman, including the corresponding update.
- Outstanding deferred Annual Variable Remuneration for executive directors
As of the end of the 2021 financial year, in accordance with the conditions established in the remuneration policies applicable in previous years, in addition to the third payment (20%) of the 2017 Deferred AVR (due to be paid in 2023) and 40% of the 2018 Deferred AVR of the Chairman (due to be paid in 2023 and 2024), 60% of the 2019 and 2021 Annual Variable Remuneration for both executive directors remains deferred and will be received in future years, provided that the applicable conditions are met.
Remunerations of Senior Management due in 2021 and subsequent financial years
- Annual Variable Remuneration for Senior Management for the 2021 financial year
Following the end of the 2021 financial year, the Annual Variable Remuneration of members of Senior Management corresponding to said financial year was determined (16 members as at 31 December 2021, excluding executive directors). For all members of Senior Management in aggregate, excluding executive directors, this Annual Variable Remuneration amounted to a total of €9,151 thousand, applying the rules established in the BBVA Group General Remuneration Policy, in which the following applicable vesting and payment rules are established:
- The Upfront Portion (40% of the 2021 Annual Variable Remuneration) will be paid, provided that the applicable conditions are met, during the first four months of the 2022 financial year, in equal parts cash and shares, which represents a total aggregate amount of €1,830 thousand and 346,106 BBVA shares.
- The remaining 60% of the 2021 Annual Variable Remuneration will be deferred (40% in cash and 60% in shares) for a period of five years (Deferred Portion) and paid, provided that the applicable conditions are met, proportionally at the end of each year for each of the 5 years of deferral, in an amount equal to 20% of the Deferred Portion each year: 20% in 2023, 20% in 2024, 20% in 2025, 20% in 2026 and 20% in 2027. The Deferred Portion may be reduced, but never increased, based on the result of the multi-year performance indicators determined by the Board of Directors, on the proposal of the Remuneration Committee and following analysis by the Risk and Compliance Committee, at the beginning of the 2021 financial year. Following the end of the financial year corresponding to the third year of deferral, the result of the multi-year performance indicators will determine the application of the ex post adjustments that, if appropriate, should be made to the outstanding amount of the Deferred Portion. All of this is subject to the vesting and payment rules provided for in the BBVA Group General Remuneration Policy.
- Moreover, the rest of the rules set forth in the BBVA Group General Remuneration Policy regarding the Annual Variable Remuneration of members of Senior Management will be applicable to 2021 Annual Variable Remuneration, including: (i) a withholding period of one year after delivery of the BBVA shares received; (ii) the prohibition of using personal hedging strategies or insurance that may undermine the effects of alignment with prudent risk management; (iii) update criteria for the Deferred Portion in cash; (iv) malus and clawback arrangements during the whole deferral and withholding period; and (v) the limitation of variable remuneration up to a maximum amount of 200% of the fixed component of the total remuneration, as agreed by the General Meeting held on 2021.
- Deferred Annual Variable Remuneration for Senior Management for the 2018 financial year
Following the end of the 2021 financial year, the Deferred Annual Variable Remuneration for members of Senior Management (16 members as at 31 December 2021, excluding executive directors) for the 2018 financial year due to be delivered in 2022, provided that the applicable conditions are met, to members of Senior Management who were beneficiaries of said remuneration, in the percentages applicable in each case in accordance with the payment schedule established in the remuneration policies in effect in the 2018 financial year and applicable to each of them, was determined.
Thus, the final amount of the Deferred Annual Variable Remuneration for the 2018 financial year, which has been adjusted downwards based on the result of the multi-year performance indicators set by the Board of Directors in 2018 for its calculation and in application of the corresponding scales of achievement and their corresponding objectives and weightings, was determined. Thus, the amount of the Deferred Portion of the Annual Variable Remuneration for the 2018 financial year due for delivery in 2022 to those members of Senior Management who were beneficiaries thereof, excluding executive directors, was determined to amount to an aggregate total amount of €691 thousand and 177,104 BBVA shares, including the corresponding updates.
- Deferred Annual Variable Remuneration for Senior Management for the 2017 financial year
Following the end of the 2020 financial year, the Deferred Annual Variable Remuneration for the 2017 financial year for members of Senior Management, excluding executive directors, payable in 2021 to the members of Senior Management who were beneficiaries thereof, provided that the applicable conditions were met, in the corresponding amounts in each case in accordance with the percentages applicable per the payment schedule established in the remuneration policies in effect in the 2017 financial year and applicable to each of them, was determined.
Thus, based on the result of each of the multi-year performance indicators set by the Board of Directors in 2017 to calculate the Deferred Portion of this remuneration, and in application of the corresponding scales of achievement and their corresponding targets and weightings, the final amount of the Deferred Annual Variable Remuneration for the 2017 financial year for members of Senior Management, excluding executive directors, was determined and the amounts payable in 2021 in each case were paid, all of which was reported in that financial year.
In 2022, provided that the applicable conditions are met, an aggregate total amount of €156 thousand euros and 29,267 BBVA shares, including the corresponding updates, is due to be paid to members of Senior Management (16 members as at 31 December 2021, excluding executive directors) as Deferred Annual Variable Remuneration for the 2017 financial year.
- Outstanding deferred Annual Variable Remuneration for Senior Management
As of the end of the 2021 financial year, in accordance with the conditions established in the remuneration policies applicable in previous years, in addition to the third payment (20%) of the 2017 Deferred AVR (due to be paid in 2023), 40% of the 2018 Deferred AVR (due to be paid in 2023 and 2024), and 60% of the 2019 Deferred AVR (due to be paid in 2023, 2024 and 2025) in the case of some members of Senior Management, 60% of the Annual Variable Remuneration for the 2021 financial year remains deferred and will be received in future years, if the applicable conditions are met.
Fixed remuneration system with deferred delivery of shares for non-executive director
BBVA has a fixed remuneration system with BBVA shares with deferred delivery for its non-executive directors, which was approved by the General Meeting held on 18 March 2006 and extended by resolutions of the General Meetings held on 11 March 2011 and 11 March 2016 for a further five-year period in each case, and by the General Meeting held on 20 April 2021 for a further three-year period.
This system is based on the annual allocation to non-executive directors of a number of "theoretical shares" of BBVA equivalent to 20% of the total annual fixed allowance in cash received by each director in the previous financial year, calculated according to the average closing price of the BBVA share during the 60 trading sessions prior to the dates of the Annual General Meetings approving the corresponding financial statements for each financial year.
These shares will be delivered to each beneficiary, where applicable, after they leave their positions as directors for any reason other than serious dereliction of their duties.
The "theoretical shares" allocated to non-executive directors who are beneficiaries of the fixed remuneration system with shares with deferred delivery in the 2021 financial year, corresponding to 20% of the total annual fixed allowance in cash received by each of them in the 2020 financial year, were as follows:
| Theoretical shares allocated in 2021 (1) | Theoretical shares accumulated as at 31 December 2021 | |
|---|---|---|
| José Miguel Andrés Torrecillas | 22,860 | 98,772 |
| Jaime Caruana Lacorte | 25,585 | 56,972 |
| Raúl Galamba de Oliveira | 9,500 | 9,500 |
| Belén Garijo López | 15,722 | 77,848 |
| Sunir Kumar Kapoor | 7,737 | 30,652 |
| Lourdes Máiz Carro | 10,731 | 55,660 |
| José Maldonado Ramos | 15,416 | 123,984 |
| Ana Peralta Moreno | 10,731 | 26,396 |
| Juan Pi Llorens | 23,079 | 115,896 |
| Ana Revenga Shanklin | 7,568 | 7,568 |
| Susana Rodríguez Vidarte | 20,237 | 161,375 |
| Carlos Salazar Lomelín | 5,642 | 5,642 |
| Jan Verplancke | 9,024 | 21,416 |
| Total | 183,832 | 791,681 |
- (1) The number of "theoretical shares" allocated to each non-executive director is equal to 20% of the total annual fixed allowance in cash received by each such director in 2020 based on the average closing price of the BBVA share during the 60 trading sessions prior to the General Meeting of 20 April 2021, which was €4.44 per share.
Pension commitments with executive directors and Senior Management
The Bank has not made pension commitments with non-executive directors.
With regard to the Chairman, the BBVA Directors' Remuneration Policy establishes a pension framework whereby he is eligible, provided that he does not leave his position as a result of serious dereliction of his duties, to receive a retirement pension, paid in either income or capital, when he reaches the legally established retirement age. The amount of this pension will be determined by the annual contributions made by the Bank, together with their corresponding accumulated yields at that date.
The annual contribution to cover the retirement contingency for the Chairman's defined-contribution system, as established in the BBVA Directors' Remuneration Policy approved by the General Meeting in 2021, amounts to €439 thousand. The Board of Directors may update this amount during the term of the Policy, in the same way and under the same terms as it may update the Annual Fixed Remuneration.
15% of the agreed annual contribution will be based on variable components and considered “discretionary pension benefits” and will, therefore, be subject to the conditions regarding delivery in shares, withholding and clawback established in the applicable regulations, as well as any other conditions concerning variable remuneration that may be applicable in accordance with the BBVA Directors' Remuneration Policy.
In the event that the Chairman's contract is terminated before he reaches retirement age for reasons other than serious dereliction of duties, the retirement pension due to the Chairman upon him reaching the legally established retirement age will be calculated based on the funds accumulated through the contributions made by the Bank, under the terms set out, up to that date, plus the corresponding accumulated yield, with no additional contributions to be made by the Bank from the time of termination.
With respect to the commitments in favour of the Chairman to cover the contingencies of death and disability, the Bank will pay the corresponding annual insurance premiums in order to top up this coverage.
In line with the above, during the 2021 financial year, the following amounts were recorded to meet the pension commitments for the Chairman: an amount of €340 thousand with regard to the retirement contingency, which corresponds to the annual contribution agreed to cover the retirement contingency reduced in an amount of €98 thousand corresponding to the downwards adjustment of the “discretionary pension benefits” of 2020 financial year, which were declared at the close of said financial year and had to be registered in the accumulated fund in 2021. Likewise, an amount of €574 thousand has been recorded for the payment of premiums for the death and disability contingencies.
As at 31 December 2021, the total accumulated amount of the fund to meet the retirement commitments for the e Chairman amounted to €24,546 thousand.
With regard to the agreed annual contribution for the retirement contingency corresponding to the 2021 financial year, 15% (€66 thousand) was recorded in said financial year as “discretionary pension benefits”. Following the end of the financial year, this amount was adjusted by applying the same criteria used to determine the Chairman's Annual Variable Remuneration for the 2021 financial year and was determined to amount to €78 thousand, which represents an upwards adjustment of €12 thousand. These “discretionary pension benefits” will be included in the accumulated fund in the 2022 financial year and will be subject to the conditions established for them in the BBVA Directors' Remuneration Policy.
With regard to the Chief Executive Officer, in accordance with the provisions of the BBVA Directors' Remuneration Policy approved by the General Meeting and those of his contract, the Bank is not required to make any contributions to a retirement pension, although he is entitled to an annual cash sum instead of a retirement pension (cash in lieu of pension) equal to 30% of his Annual Fixed Remuneration. However, the Bank does have pension commitments to cover the death and disability contingencies, for which purpose the corresponding annual insurance premiums are paid.
In accordance with the above, in the 2021 financial year, the Bank paid the Chief Executive Officer the fixed-remuneration amount set out for cash in lieu of pension in the "Remuneration received by executive directors in 2021" section of this Note and, likewise, €295 thousand was recorded for the payment of the annual insurance premiums to cover the death and disability contingencies.
Furthermore, in the 2021 financial year, to meet the pension commitments for members of Senior Management (16 members holding that position as at 31 December 2021, excluding executive directors), the following was recorded: an amount of €3,222 thousand for contribution to the retirement contingency and an amount of €1,333 thousand for premiums to cover the death and disability contingencies, as well as a downwards adjustment of €167 thousand for “discretionary pension benefits” corresponding to the 2020 financial year, which were declared at the end of that financial year and had to be registered in the accumulated fund in 2021.
As at 31 December 2021, the total accumulated amount of the fund to meet the retirement commitments for members of Senior Management amounts to €27,472 thousand.
As for the executive directors, 15% of the agreed annual contributions for members of Senior Management to cover the retirement contingency will be based on variable components and considered “discretionary pension benefits”, and are therefore subject to the conditions regarding delivery in shares, withholding and clawback established in the applicable regulations, as well as any other conditions concerning variable remuneration that may be applicable in accordance with the remuneration policy applicable to members of Senior Management.
As such, with regard to the annual contribution for the retirement contingency registered in the 2021 financial year, an amount of €482 thousand was registered in the 2021 financial year as “discretionary pension benefits” and, following the end of the financial year, as in the case of the Chairman, this amount was adjusted by applying the same criteria used to determine the 2021 Annual Variable Remuneration for members of Senior Management. Accordingly, the "discretionary pension benefits" for the financial year, corresponding to all members of Senior Management, were determined to amount to a total of €591 thousand, representing an upwards adjustment of €109 thousand. These “discretionary pension benefits” will be included in the accumulated fund for the 2022 financial year, and will be subject to the conditions established for them in the remuneration policy applicable to members of Senior Management, in accordance with the regulations applicable to the Bank on this matter.
Payments for the extinction of the contractual relationship
In accordance with the BBVA Directors' Remuneration Policy, the Bank has no commitments to pay severance indemnity to executive directors.
With regard to Senior Management, excluding executive directors, the Bank did not make any payments arising from the termination of contractual relationships in 2021.
55. Other information
55.1 Environmental impact
Given the activities BBVA Group entities engage in, the Group has no environmental liabilities, expenses, assets, provisions or contingencies that could have a significant effect on its consolidated equity, financial situation and profits. Consequently, as of December 31, 2021, there is no item included that requires disclosure in an environmental information report pursuant to Ministry JUS/794/2021, of July 22, by which the new model for the presentation in the Commercial Register of the consolidated annual accounts of the subjects obliged to its publication is approved.
The attached Consolidated Management Report presents in more detail the BBVA Group's management of environmental impacts and risks.
55.2 Reporting requirements of the Spanish National Securities Market Commission (CNMV)
Dividends paid
The table below presents the dividends per share paid in cash during 2021, 2020 and 2019 (cash basis dividend, regardless of the year in which they were accrued). For a complete analysis of all remuneration awarded to the shareholders in 2021, 2020 and 2019 (see Note 4).
Paid Dividends
| 2021 | 2020 | 2019 | |||||||
|---|---|---|---|---|---|---|---|---|---|
| % Over Nominal | Euros per share | Amount (Millions of Euros) | % Over Nominal | Euros per share | Amount (Millions of Euros) | % Over Nominal | Euros per share | Amount (Millions of Euros) | |
| Ordinary shares | 16.33% | 0.08 | 533 | 32.65% | 0.16 | 1,067 | 53.06% | 0.26 | 1,734 |
| Rest of shares | — | — | — | — | — | — | — | — | — |
| Total dividends paid in cash | 16.33% | 0.08 | 533 | 32.65% | 0.16 | 1,067 | 53.06% | 0.26 | 1,734 |
| Dividends with charge to income | 16.33% | 0.08 | 533 | 32.65% | 0.16 | 1,067 | 53.06% | 0.26 | 1,734 |
| Dividends with charge to reserve or share premium | — | — | — | — | — | — | — | — | — |
| Dividends in kind | — | — | — | — | — | — | — | — | — |
| Flexible payment | — | — | — | — | — | — | — | — | — |
Ordinary income and attributable profit by operating segment
The detail of the consolidated ordinary income and profit for each operating segment is as follows as of December 31, 2021, 2020 and 2019:
Ordinary income and attributable profit by operating segment (Millions of Euros)
| Income from ordinary activities (**) | Profit/ (loss) (***) | |||||
|---|---|---|---|---|---|---|
| 2021 | 2020 (*) | 2019 (*) | 2021 | 2020 (*) | 2019 (*) | |
| Spain | 8,266 | 8,579 | 9,300 | 1,581 | 652 | 1,436 |
| Mexico | 11,685 | 11,048 | 13,155 | 2,568 | 1,761 | 2,698 |
| Turkey | 7,388 | 6,594 | 8,868 | 740 | 563 | 506 |
| South America | 5,961 | 5,621 | 6,782 | 491 | 446 | 721 |
| Rest of Business | 884 | 1,128 | 1,134 | 254 | 222 | 184 |
| Subtotal operating segments | 34,184 | 32,970 | 39,238 | 5,633 | 3,644 | 5,544 |
| Corporate Center | 284 | (287) | (303) | (980) | (2,339) | (2,032) |
| Total | 34,468 | 32,683 | 38,935 | 4,653 | 1,305 | 3,512 |
- (*) The figures corresponding to 2020 and 2019 have been restated.
- (**) The line comprises interest income; dividend income; fee and commission income; gains (losses) on derecognition of financial assets and liabilities not measured at fair value through profit or loss, net; gains (losses) on financial assets and liabilities held for trading, net; gains (losses) on non-trading financial assets mandatorily at fair value through profit or loss, net; gains (losses) on financial assets and liabilities designated at fair value through profit or loss, net; gains (losses) from hedge accounting, net; other operating income; and income from insurance and reinsurance contracts.
- (***) See Note 6.
Interest income by geographical area
The breakdown of the balance of “Interest income and similar income” in the accompanying consolidated income statements by geographical area is as follows:
Interest income. Breakdown by geographical area (Millions of Euros)
| Notes | 2021 | 2020 | 2019 | |
|---|---|---|---|---|
| Domestic | 4,311 | 4,677 | 4,884 | |
| Foreign | 18,704 | 17,712 | 22,878 | |
| European Union | 315 | 400 | 470 | |
| Eurozone | 204 | 243 | 304 | |
| Not Eurozone | 112 | 157 | 166 | |
| Other countries | 18,388 | 17,312 | 22,408 | |
| Total | 37.1 | 23,015 | 22,389 | 27,762 |
Number of employees
The detail of the average number of employees is as follows as of December 31, 2021, 2020 and 2019:
Average number of employees
| 2021 | 2020 | 2019 | |
|---|---|---|---|
| Men | 54,116 | 57,814 | 58,365 |
| Women | 62,169 | 67,076 | 67,778 |
| Total | 116,285 | 124,891 | 126,143 |
The breakdown of the number of employees in the BBVA Group as of December 31, 2021, 2020 and 2019 by category and gender is as follows:
Average number of employees
| 2021 | 2020 | 2019 | |
|---|---|---|---|
| Spanish banks | |||
| Management Team | 984 | 1,013 | 1,049 |
| Other line personnel | 19,706 | 20,955 | 21,438 |
| Clerical staff | 1,862 | 2,192 | 2,626 |
| Branches abroad | 981 | 979 | 1,000 |
| Subtotal | 23,533 | 25,138 | 26,114 |
| Banks abroad | |||
| Mexico | 35,845 | 33,753 | 33,377 |
| The United States | 4,032 | 9,758 | 9,712 |
| Turkey | 21,791 | 21,946 | 22,026 |
| Venezuela | 1,875 | 2,227 | 2,806 |
| Argentina | 5,773 | 6,048 | 6,193 |
| Colombia | 5,130 | 5,326 | 5,301 |
| Peru | 6,077 | 6,149 | 5,976 |
| Other | 831 | 1,612 | 1,605 |
| Subtotal | 81,354 | 86,819 | 86,995 |
| Pension fund managers | 469 | 435 | 396 |
| Other non-banking companies | 10,929 | 12,499 | 12,638 |
| Total | 116,285 | 124,891 | 126,143 |
The breakdown of the number of employees in the BBVA Group as of December 31, 2021, 2020 and 2019 by category and gender is as follows:
Number of employees at the year end. Professional category and gender
| 2021 | 2020 | 2019 | ||||
|---|---|---|---|---|---|---|
| Male | Female | Male | Female | Male | Female | |
| Management team | 2,089 | 1,005 | 2,195 | 1,015 | 2,200 | 989 |
| Other line personnel | 31,875 | 31,658 | 34,518 | 34,240 | 37,337 | 39,108 |
| Clerical staff | 17,945 | 25,860 | 20,268 | 30,938 | 19,194 | 28,145 |
| Total | 51,909 | 58,523 | 56,981 | 66,193 | 58,731 | 68,242 |
In 2021, the agreement with the legal representation of the workers on the collective layoff procedure proposed for Banco Bilbao Vizcaya Argentaria, S.A. in Spain is considered in the figures (see Note 24). Employees of companies sold in the USA Sale in 2021 are included in the figures as of December 31, 2020 and 2019 (see Note 3).
55.3 Mortgage market policies and procedures
The information on “Mortgage market policies and procedures” (for the granting of mortgage loans and for debt issues secured by such mortgage loans) required by Bank of Spain Circular 5/2011, applying Royal Decree 716/2009, dated April 24, on the regulation of the mortgage market and other mortgage and financial market regulations and Royal Decree 24/2021, dated November 2, on transposition of European Union directives in matters of covered bonds and cross-border distribution of undertakings for collective investment, can be found in Appendix X.
56. Subsequent events
Between January 1 and February 3, 2022, J.P. Morgan AG, as manager of the first tranche, has acquired 65,272,189 BBVA shares as part of its share buyback program (see Note 4).
On February 3, 2022, BBVA announced that its Board of Directors agreed, within the Framework Program, to carry out a second buyback program (the “Second Tranche”) aimed at reducing BBVA’s share capital, for a maximum amount of €2,000 million and a maximum number of shares to be acquired equal to the result of subtracting from 637,770,016 own shares (9.6% of BBVA’s share capital at that date) the number of own shares finally acquired in execution of the First Tranche. The implementation of the Second Tranche, which will also be executed externally through a lead-manager, will begin after the end of the implementation of the First Tranche and shall end no later than October 15, 2022 (see Note 4).
On January 3, 2022, it was announced that a cash distribution in the amount of €0.23 gross per share as shareholder remuneration in relation to the Group's result in the 2021 financial year was expected to be submitted to the relevant governing bodies of BBVA for consideration (see Note 4).
From January 1, 2022 to the date of preparation of these Consolidated Financial Statements, no other subsequent events not mentioned above in these financial statements have taken place that could significantly affect the Group’s earnings or its equity position.
57. Explanation added for translation into English
These accompanying consolidated financial statements are presented on the basis of IFRS, as adopted by the European Union. Certain accounting practices applied by the Group that conform to EU-IFRS may not conform to other generally accepted accounting principles.
Translation of the Consolidated Financial Statements originally issued in Spanish and prepared in accordance with EU-IFRS, as adopted by the European Union (see Notes 1 to 56). In the event of a discrepancy, the Spanish-language version prevails.