
Group financial information
3.1 Group
3.1.1 Main data
BBVA GROUP MAIN DATA (CONSOLIDATED FIGURES)
| 31-12-21 | ∆% | 31-12-20 | 31-12-19 | |
|---|---|---|---|---|
| Balance sheet (millions of euros) | ||||
| Total assets | 662,885 | (9.7) | 733,797 | 695,471 |
| Loans and advances to customers (gross) (1) | 330,055 | 2.1 | 323,252 | 337,388 |
| Deposits from customers (1) | 349,761 | 2.1 | 342,661 | 320,589 |
| Total customer funds (1) | 465,529 | 4.5 | 445,608 | 428,392 |
| Total equity | 48,760 | (2.5) | 50,020 | 54,925 |
| Income statement (millions of euros) | ||||
| Net interest income | 14,686 | 0.6 | 14,592 | 15,789 |
| Gross income | 21,066 | 4.5 | 20,166 | 21,522 |
| Operating income | 11,536 | 4.1 | 11,079 | 11,368 |
| Net attributable profit (loss) | 4,653 | 256.6 | 1,305 | 3,512 |
| Net attributable profit (loss) excluding non-recurring impacts (2) | 5,069 | 85.7 | 2,719 | 4,270 |
| The BBVA share and share performance ratios | ||||
| Number of shares issued (million) | 6,668 | — | 6,668 | 6,668 |
| Share price (euros) | 5.25 | 30,1 | 4.04 | 4.98 |
| Adjusted earning (loss) per share (euros) (3) | 0.71 | 101.4 | 0.35 | 0.58 |
| Earning (loss) per share (euros) (3)(4) | 0.67 | n.s. | 0.14 | 0.47 |
| Book value per share (euros) (3)(4) | 6.86 | 2.5 | 6.70 | 7.32 |
| Tangible book value per share (euros) (3)(4) | 6.52 | 7.8 | 6.05 | 6.27 |
| Market capitalization (million euros) | 35,006 | 30.1 | 26,905 | 33,226 |
| Yield (dividend/price; %) (5) | 2.6 | 4.0 | 5.2 | |
| Significant ratios (%) | ||||
| Adjusted ROE (net attributable profit (loss)/average shareholders' funds +/- average accumulated other comprehensive income) (2) | 11.4 | 6.1 | 8.7 | |
| Adjusted ROTE (net attributable profit (loss)/average shareholders' funds excluding average intangible assets +/- average accumulated other comprehensive income) (2) | 12.0 | 6.5 | 9.3 | |
| Adjusted ROA (Profit (loss) for the year/average total assets) (2) | 0.94 | 0.54 | 0.84 | |
| Adjusted RORWA (Profit (loss) for the year/average risk-weighted assets - RWA) (2) | 2.01 | 1.16 | 1.69 | |
| Efficiency ratio | 45.2 | 45.1 | 47.2 | |
| Cost of risk (6) | 0.93 | 1.55 | 1.04 | |
| NPL ratio (6) | 4.1 | 4.2 | 4.2 | |
| NPL coverage ratio (6) | 75 | 82 | 75 | |
| Capital adequacy ratios (%) | ||||
| CET1 fully-loaded | 12.75 | 11.73 | 11.74 | |
| CET1 phased-in (7) | 18.98 | 12.15 | 11.98 | |
| Total ratio phased-in (7) | 17.24 | 16.46 | 15.92 | |
| Other information | ||||
| Number of clients (million) (8) | 81.7 | 4.2 | 78.4 | 75.6 |
| Number of shareholders | 826,835 | (6.0) | 879,226 | 874,148 |
| Number of employees | 110,432 | (10,3) | 123,174 | 126,973 |
| Number of branches | 6,083 | (18.2) | 7,432 | 7,744 |
| Number of ATMs | 29,148 | (6.0) | 31,000 | 32,658 |
- General note: the results generated by BBVA USA and the rest of the companies in the United States sold to PNC on June 1, 2021, are presented in a single line as "Profit (loss) after tax from discontinued operations".
- (1) Excluding the assets and liabilities figures from BBVA USA and the rest of the companies in the United States sold to PNC on June 1, 2021, classified as non-current assets and liabilities held for sale (NCA&L) as of 31-12-20. The figures related to "Loans and advances to customers (gross)", "Deposits from customers" and "Total customer funds", including BBVA USA, would stand at €394,763m, €384,219m and €492,022m, respectively, as of 31-12-19.
- (2) Non-recurring impacts include: (I) profit (loss) after tax from discontinued operations as of 31-12-21, 31-12-20 and 31-12-19; (II) the net costs related to the restructuring process as of 31-12-21; and (III) the net capital gain from the bancassurance operation with Allianz as of 31-12-20.
- (3) For the adjusted earning (loss) per share and earning (loss) per share calculation the additional Tier 1 instrument remuneration is adjusted. As of 31-12-21, 112 million shares acquired within the share buyback program in 2021 were considered.
- (4) The estimated number of shares pending from buyback as of December 31, 2021 of the first tranche approved by the BBVA Board of Directors in October 2021 (€1,500m), in process at the end of the year 2021, was included.
- (5) Calculated by dividing shareholder remuneration over the last twelve months by the closing price of the period.
- (6) Excluding BBVA USA and the rest of the companies in the United States sold to PNC on June 1, 2021.
- (7) Phased-in ratios include the temporary treatment on the impact of IFRS 9, calculated in accordance with Article 473 bis amendments of the Capital Requirements Regulation (CRR), introduced by the Regulation (EU) 2020/873.
- (8) Excluding BBVA USA and the rest of the companies in the United States sold to PNC on June 1, 2021 and BBVA Paraguay.
3.1.2 Macroeconomic and regulatory environment
Macroeconomic environment
In 2021 the global economy has grown significantly, recovering in part from the crisis caused by the pandemic, which caused a sharp fall in global GDP in 2020. The significant upturn in global growth has been due to progress in the vaccination against COVID-19 and important economic stimuli adopted by public authorities.
Activity indicators show, however, that the economic recovery process has lost momentum in recent months. The recent slowdown in economic growth is taking place in an environment marked by a sharp increase in infections caused by new variants of the COVID-19, although the increasing immunization of the world population has helped to generally prevent the adoption of mobility restrictions, which would have had a greater impact on the economy.
The effects of reduced production due to the pandemic and its persistence, coupled with fiscal stimuli and strong demand for goods, once restrictions have been lifted, contribute to maintaining the problems in global supply chains observed since the beginning of 2021 which, in addition to negatively affecting economic activity, generate significant upward pressure on prices.
Against this backdrop, annual inflation in December 2021 stood at 7.0% in the United States and 5.0% in the Eurozone. In both geographical areas, long-term inflation expectations from markets and surveys have been adjusted upwards, although in the case of the Eurozone they remain generally below the European Central Bank’s (hereinafter, ECB) 2% target.
High inflation rates and their increased persistence have put pressure on central banks to withdraw monetary stimuli earlier than they had originally anticipated. The United States Federal Reserve, in particular, has begun the rollback in its bond-buying program and has suggested that monetary policy interest rates will adjust upwards earlier and faster than expected by financial markets and financial analysts, and also that a downsizing of its balance sheet may soon begin. In the Eurozone, the ECB will complete the pandemic emergency purchase program (PEPP) in March 2022. Although the asset purchase program (APP) is maintained, asset purchases will be moderated over the course of 2022. However, unlike the Federal Reserve, the ECB has continued to maintain that it rules out an increase in benchmark interest rates in 2022.
According to BBVA Research, the global economic recovery process is expected to continue in the coming months, albeit at a slightly slower pace than expected in autumn of 2021, due to the persistence of the pandemic, but also due to a higher-than-estimated impact of supply chain problems and inflationary pressures. All this against a background of reduced fiscal and monetary stimulus. GDP growth would therefore moderate, from an estimated 5.6% in 2021 to about 4.2% in 2022 in the United States, from 5.1% in 2021 to 3.7% in 2022 in the Eurozone and from 8.0% in 2021 to 5.2% in 2022 in China. The likely rise in monetary policy interest rates in the United States, which could reach 1.25% by the end of 2022, as well as a progressive control of the pandemic and a moderation of supply chain problems, would allow inflation to be moderated throughout the year; although inflation is expected to remain high, particularly in the United States. Risks arising from this economic scenario expected by BBVA Research are significant and are biased downwards in the case of activity, and include more persistent inflation, financial turbulence caused by a more aggressive withdrawal of monetary stimuli, the emergence of new variants of the coronavirus that bypass current vaccines, a more intense slowdown in the Chinese economy, as well as social and geopolitical tensions.
REAL GDP GROWTH AND INFLATION IN 2020 (REAL PERCENTAGE GROWTH)
| 2021 | 2022 | |||
|---|---|---|---|---|
| GDP | INFLATION | GDP | INFLATION | |
| Global | 6,1 | 4,7 | 4,4 | 3,4 |
| Eurozone | 5.1 | 5.0 | 3.7 | 1.1 |
| Spain | 5.1 | 6.5 | 5.5 | 1.1 |
| The United States | 5.6 | 7.0 | 4.2 | 3.2 |
| Mexico | 5.3 | 7.4 | 2.2 | 4.1 |
| South America (1) | 7.2 | 12.0 | 2.0 | 10.3 |
| Turkey | 10.8 | 36.1 | 3.5 | 35.0 |
| China | 8.0 | 3.0 | 5.2 | 2.0 |
- Source: BBVA Research estimates. Inflation end of period.
- (1) It includes Argentina, Brazil, Chile, Colombia, Paraguay, Peru and Uruguay.
Exchange rate evolution
The U.S. dollar accumulated a 8.3% appreciation against the euro in 2021, thus reversing a large part of the depreciation which occurred in 2020 after the outbreak of the pandemic. Among the emerging currencies, it is worth highlighting the strong depreciation of the Turkish lira in 2021 (-40.2%), severely penalized in recent months by rate reductions. The positive aspect came from the good performance of the Mexican peso, which registered an appreciation of 5.5% against the euro since the end of 2020. With regard to South American currencies, Peruvian sol finally closed the year with a very moderate depreciation against the euro (-1.3%), while Chilean peso (-8.8%) and Colombian peso (-6.6%) depreciated slightly more. For its part, Argentine peso registered a moderate depreciation (-11.3%) compared to previous years.
For information on the BBVA Group's exchange rate risk management policies, see the "Risk Management" chapter of this report.
EXCHANGE RATES (EXPRESSED IN CURRENCY/EURO)
| Year-end exchange rates | Average exchange rates | ||||
|---|---|---|---|---|---|
| 31-12-21 | ∆ % on 31-12-20 | ∆ % on 30-09-20 | 2021 | ∆ % on 2020 | |
| U.S. dollar | 1.1326 | 8.3 | 2.2 | 1.1827 | (3.5) |
| Mexican peso | 23.1438 | 5.5 | 2.6 | 23.9842 | 2.3 |
| Turkish lira | 15.2335 | (40.2) | (32.4) | 10.5067 | (23.4) |
| Peruvian sol | 4.5045 | (1.3) | 6.2 | 4.5867 | (13.0) |
| Argentine peso (1) | 116.37 | (11.3) | (1.8) | — | — |
| Chilean peso | 956.70 | (8.8) | (2.7) | 897.78 | 0.6 |
| Colombian peso | 4,509.06 | (6.6) | (1.5) | 4,427.36 | (4.8) |
(1) According to IAS 29 "Financial information in hyperinflationary economies", the year-end exchange rate is used for the conversion of the Argentina income statement.
Regulatory environment
Return to normal in the post-COVID-19 regulatory work plans
The regulatory environment of the financial industry in 2021 has been marked by measures designed to boost post-COVID-19 recovery, with a great weight being given to criteria of sustainability and digitalization. Banks have made a great effort to implement the measures proposed by the authorities and to make possible a recovery which is sustainable over time.
1. Post-COVID-19 recovery
The G-20 summit held in Rome in October 2021 determined that the global economic recovery is firm, underpinned by the confidence of having overcome the pandemic and by support measures. The Financial Stability Board presented its final report on the lessons learned from the pandemic, considering COVID-19 to be the first test of the financial system since the global crisis of 2008. It reviews the resilience of markets and institutions, operational resilience and preparation for the crisis.
At European level, the recovery is reflected in the European Central Bank's (ECB) decision not to prolong beyond 2021 the recommendation to limit dividend distribution, which was issued for the first time to credit institutions in March 2020.
With respect to the measures dealing with non-performing loans (NPLs), the European Commission has continued to develop the action plan on NPLs published in December 2020. In the summer of 2021 the Committee renewed a group of experts formed by members of the industry (including BBVA) to address potential initiatives in the matter of NPLs. In December 2021 the Directive on credit servicers and credit purchasers was published in the Official Journal of the European Union (OJEU). It was focused on promoting secondary NPL markets, giving Member States a deadline of 24 months for transposing it at national level.
In 2021, attention was also focused on the recapitalization of viable institutions. To give one example, Spain approved the Code of Good Practice for the renegotiation framework for customers with secured finance, under Royal Decree-Law 5/2021 on extraordinary measures to support business solvency. BBVA's voluntary acceptance of this code demonstrates its firm commitment to small companies and self-employed workers.
2. Prudential scope
The most significant measure taken in Europe in the area of prudential regulation has been the publication by the European Commission of the proposal to implement the completion of Basel III, which represents the final step in the regulatory reform that began in the wake of the financial crisis. The European Commission has proposed to the European Parliament and to the Council a number of modifications to banking regulations known as the "2021 banking package," to make banks in the European Union more resilient to possible future economic shocks, while contributing to recovery from the pandemic and the transition to climate neutrality. The main goal of the reform is to achieve a simpler, more comparable and risk-sensitive framework. To do so, it proposes amendments to the Capital Requirements Regulation (CRR) and the Capital Requirements Directive (CRD).
It also proposes new tools for the supervisors and a separate modification of the CRR referring to the area of resolution (known as the "Daisy Chain" proposal). With respect to sustainability, it introduces definitions of the different types of environmental, social and governance (ESG) risks, in line with the proposals of the European Banking Authority (EBA), advances the deadline from 2025 to 2023 for the EBA to deliver its report on the prudential treatment of these risks and provides measures to ensure that entities include them in their internal capital assessment strategies. The European Commission proposes that the new rules should begin to be applied starting on 1 January 2025. A debate has begun on this matter in the European Parliament and the Council. Moreover, June 2021 marked the completion of the implementation of the last major regulatory package, CRR II.
As regards the resolution framework in Europe, the reform of the Treaty on the European Stability Mechanism was signed, allowing it to act as a security mechanism for the Single Resolution Fund from the start of 2022. The European Banking Authority has developed various level 2 and 3 regulatory texts on recovery and resolution (the Bank Recovery and Resolution Directive, BRRD), while the Single Resolution Board (SRB) has published a number of guidance documents to improve the resolution of financial institutions.
In Spain, the Decree-Law 7/2021 was approved in April 2021, to transpose the capital (CRD V) and resolution (BRRD2) directives to Spanish law. Of note with respect to resolution is the inclusion of adjustments in the hierarchy of creditors in cases of liquidation and the calibration and subordination of the MREL requirement. In the prudential part changes have been included in the definition and requirements of Pillar II, in the macroprudential buffers and the system of remunerations.
With respect to the regulations related to the macroprudential regulation, in 2021 the Basel Committee on Banking Supervision has published its final report on the methodology for identifying Global Systemically Important Banks (G-SIBs), with the proposal that this methodology should be reviewed continuously instead of doing so every three years. In addition, the European Commission has published a public consultation on the macroprudential framework and also requested an opinion from the European Banking Authority, the European Systemic Risk Board and the European Central Bank on a future review of the framework.
3. Financial markets and conduct
The transitional period with respect to the exit of the United Kingdom from the European Union ended on December 31, 2020 This meant that the financial regulation of the European Union no longer applied to the United Kingdom starting on January 1. The United Kingdom began to apply its own framework, which so far is very similar to the European Union's financial regulation, but including temporary measures which delay the entry into force of certain new requirements until March 2022. Throughout 2021 it was clear that the United Kingdom wished to modify its financial regulation and separate it from its European equivalent. For example, proposals have already been published to modify its MiFID (Markets in Financial Instruments Directive) regulations, which will represent a significant deviation from the European Union. With respect to the European Union, the European Commission is maintaining its equivalence decision for the United Kingdom's central counterparties; although it ends in June 2022, it has already announced its intention of extending its validity.
The European regulators continue to support initiatives that boost the development of an integrated capital market in Europe. In this respect, the European Commission published a package of measures which complies with some of the commitments included in its Capital Markets Union (CMU) 2020 action plan, to improve access to company information and negotiation, thus helping companies to connect with their investors. The package includes four proposals: (I) a platform (unique access point), which provides investors with access to companies' financial and sustainability-related information; (II) a revision of the Regulation on European long-term investment funds; (III) a revision of the alternative investment fund managers directive (AIFMD); and (IV) the revision of the MiFIR to support a consolidated source of data on negotiation in all trading venues of the European Union to foster competition.
The Capital Markets Recovery Package was also approved in 2021, including the revision of MiFID II, the regulation of prospectuses and securitization rules.
With respect to the Packaged Retail and Insurance Based Investment Products (PRIIPs), the European Commission issued the draft regulation amending the document of basic data for unifying the requirements for investment products based on insurance with those required by the Directive on Undertakings for Collective Investment in Transferable Securities Directive (UCITS).
In the area of insurance regulations, the European Commission revised Solvency II. The changes proposed aimed to make it easier for insurance companies to increase their long-term investments, make progress in the Capital Markets Union and to channel funds to the European Green Pact, increasing the sector's resilience.
Finally, given the importance of mortgage-covered bonds in the Spanish market, an Omnibus Royal Decree-Law has been approved which includes the transposition of the European Covered Bonds Directive and Cross-Border Fund Distribution Directive. It is expected to enter into force in July 2022.
3.1. Reform of reference indices: work on an orderly transition
The Euribor modernization process was consolidated in the eurozone in 2021 and progress has been made in the transition to a risk- free reference (the euro short-term rate (€STR). The transition from the Libor (London Interbank Offered Rate) has meant a great challenge for markets and a coordinated effort for all the participants.
The official end of the publication of the EUR LIBOR and CHF LIBOR was confirmed on December 31, 2021, together with some USD LIBOR, GDP LIBOR and JPY LIBOR maturities. The most commonly used maturities in dollars will continue to be published until June 30, 2023 in order to facilitate the transition from current contracts, as will happen with the most commonly used GBP and JPY LIBOR maturities; the administrator of the index will continue to publish them under a new methodology indexed to the corresponding risk- free reference index. Moreover, the discontinuation of Eonia (the Euro Overnight Index Average) in 2022, has meant that the whole European market has been working in 2021 on the transition to the €STR.
This scenario means that the market must evolve toward alternative rates which, according to the recommendations of the Financial Stability Board (FSB) and other authorities, should be based on the risk-free rates identified: the SONIA (Sterling Overnight Index Average) as a replacement for the sterling Libor references, the SOFR (Secured Overnight Financing Rate) for the US Dollar Libor, the SARON (Swiss Average Rate Overnight) for the Swiss franc benchmark, the TONAR (Tokyo Overnight Average Rate) for the Yen Libor and the €STR for the EUR LIBOR.
In this context, the modification of the Benchmarks Regulation (BMR), which allows the European Commission to designate a legal replacement rate if an index with an impact on the financial stability of the EU is affected by certain trigger events: (I) its cessation; (II) lack of representativity; or (III) breach of certain authorization requirements of the BMR. In this respect, statutory fallbacks have been identified for EONIA and CHF LIBOR.
Unlike in the case of the Libor, the Euribor is not expected to disappear. However, the regulations require contracts to be strengthened by the inclusion of appropriate alternative rates. For this purpose, on May 11, 2021, the working group on euro risk-free rates published its final recommendation on Euribor fallback trigger events and €STR-based Euribor alternatives. The administrator of the Euribor, the European Money Markets Institute (EMMI) has publicly announced the Euribor V3 project for calculating the Euribor, which proposes centralizing the calculation of level 3 contributions.
In January 2022, the European Securities and Markets Authority (ESMA) replaced the Financial Services and Markets Authority (FSMA) in Belgium as the supervisor of the Euribor administrator.
3.2. Anti-money laundering and financing of terrorism
Anti-money laundering and combating the financing of terrorism (AML-CFT) is a subject which is acquiring increasing importance at the regulatory level, particularly in 2021 Europe. In July, the European Commission presented an ambitious legislative package with the aim of strengthening the current AML regulatory framework in the European Union. A new European AML authority will be created, which will supervise certain financial institutions directly, with indirect supervision of the rest. This authority will be created in 2023 and is expected to begin its activity in 2026. Another new point is that most AML questions will be governed by a Regulation directly applicable in the Member States, including a large part of the content of the current AML Directive. Finally, the legislative package incorporates the obligation to apply the reporting requirements of principal and beneficiary to transfers with crypto- currencies. These requirements until now were only applied to transfers of funds.
Of particular note in Spain is the publication of Royal Decree-Law 7/2021, which has transposed the fifth AML Directive in Spain.
For more information on how BBVA manages this issue, see the section "Prevention of Money-Laundering and Financing of Terrorism" in the "Compliance" chapter of this report.
4. Sustainable finance: consolidation of the regulation and in prudential supervision
The year 2021 was key for starting to integrate ESG criteria into decision-making and risk management in financial institutions and for the acceleration of the development of regulatory frameworks designed to promote sustainability.
At global level it is notable that the International Financial Reporting Standards (IFRS) Foundation has announced the creation of the International Sustainability Standards Board (ISSB) to create international standards for reporting sustainability information. In addition, the Basel Committee on Banking Supervision is developing management and supervisory principles for these risks, which have been drafted in the form of a consultation.
For its part, Europe has managed to position itself as a pioneering region in this area, giving rise to the adoption of important legislative measures such as the European Taxonomy of Sustainable Activities, the Sustainable Finance Disclosure Regulation (SFDR), and more recently, the proposal for the Corporate Sustainability Reporting Directive (CSRD). Moreover, the European Commission presented in July 2021 a new strategy for sustainable finance, establishing new initiatives to address climate change and other environmental challenges. These initiatives have been included in the proposal to implement Basel III presented by the European Commission in October 2021. In addition, preliminary reports have been published by the European Sustainable Finance Platform on: (I) the extension of the taxonomy to include the sustainability of intermediate economic activities, with the aim of supporting activities which allow the transition to a sustainable economy; and (II) a social taxonomy which, will complete the European taxonomy of green activities.
In September the ECB published the results of the first stress tests in which the climate risks in different activities have been measured. It is planning the first supervisory stress tests for banks based on climate risks for 2022. This proliferation of initiatives at international level makes it necessary to strengthen cooperation between authorities.
At national level, Law 7/2021, of 20 May, on climate change and energy transition, provides the regulatory and institutional framework designed to facilitate and guide the decarbonization of the Spanish economy by 2050, as established by the European Union and the commitment acquired through the signing of the Paris Agreement. This regulation establishes obligations both for the financial and business sector and for supervisors.
5. Regulation in the field of the digital transformation of the financial sector
In 2021, digitalization continued to be a priority for the authorities, which have made progress in the implementation of the strategies and action plans defined in 2020.
In 2020, the European commission published a strategy to shape the European Union's digital future. It is based on two fundamental pillars: strengthening the use of data, and developing and regulating artificial intelligence. With respect to the first pillar, in 2021 the European Commission launched a prior public consultation on the new regulatory initiative (Data Act), whose publication is planned in 2022. It will promote greater sharing and reuse of data between different agencies (companies and the public administration). With respect to the second pillar, in April the European Commission presented a new Artificial Intelligence (AI) package which aims to make Europe a leader in trustworthy AI at global level. The package includes the proposal for the first legislation on Artificial Intelligence in the world. It will introduce new requirements related to data governance, transparency and supervision for AI systems considered high risk, such as those used by banks to assess customer solvency or for some uses in the area of personnel management. In parallel, the European Banking Authority has published a report which aims to clarify the expectations of supervisors with respect to the use of machine learning in internal models for the calculation of regulatory capital.
Another relevant step taken in 2021 for the digitalization of the European economy was the announcement of the future creation of digital identity wallets. For this, the European Commission proposes modifying the European electronic identification and trust services (elDAS) Regulation to establish that the Member States must issue digital identity wallets.
The entry of major digital platforms (the BigTechs) in the financial sector has been the subject of debate for financial authorities around the world in 2021. At global level, the Bank of International Settlements (BIS) has led a reflection on the need to introduce a holistic regulation for these new suppliers and reinforce coordination between authorities in different sectors and countries.
At European level, in February 2021 the Commission asked for technical advice from the European Supervisory Authorities on how to undertake the revision of the regulatory and supervisory framework of the financial sector to ensure it complies with the "same activity, same risk, same regulation" principle, among other things of the new financial services suppliers, the FinTechs and BigTechs. Once the European Supervisory Authorities complete their work, the Commission must decide in 2022 whether to undertake any legal action. At the same time, the European Commission has published a proposal to revise the Consumer Credit Directive in order to extend its scope of application to a broader set of loans and to ensure that credit providers are subject to additional obligations with respect to aspects such as the pre-contractual information provided to customers and the analysis of customer solvency.
In relation to the open banking regulation, the Financial Regulation Unit has proposed new rules to allow the development of a broad framework for sharing financial data in Colombia. In Turkey, the authorities have developed detailed rules for implementing the new open banking framework, as well as a proposed regulation for a new type of digital banks and a new "service banking" model.
The year 2021 has also been very significant for the payments sector. The objectives of the retail payments strategy published by the European Commission in 2020 include the promotion of instant payments as the "new normal." To this end, in 2021 the Commission published a number of consultations assessing the need for specific measures covering adherence to them, their functionalities, and fees payable. The ECB also published in April the retail payments strategy of the Eurosystem, which proposes pan-European payment solutions and the expansion of instant payments as key elements. At the end of this year, the Commission has begun the process of revising the PSD2.
Another area that attracted great attention from international bodies and national regulators in 2021 was that of crypto-assets. At global level, in June the Basel Committee on Banking Supervision published a preliminary proposal for the prudential treatment of bank exposure to crypto-assets, although it has already announced that more work is needed before a final standard is available, so it will continue to work on this new framework in 2022. At national level, the National Securities Market Commission (CNMV) issued a Circular to regulate the advertising of crypto-assets, which will enter into force at the start of next year. Also in 2021, the Central Bank of Turkey issued a new regulation in April prohibiting financial institutions from developing business models which involve the use of crypto-assets for payments.
As progress is made on the regulation of private virtual assets, central banks have intensified their analysis of central bank digital currencies (CBDCs). In July the ECB decided to launch an investigation phase of two years on the digital euro, a CBDC for retail payments which will supplement cash. In Turkey, the Central Bank announced in September an agreement with a number of technological suppliers to carry out the research, development and testing needed for a possible digital lira.
Finally, an important milestone this year in Spain has been the implementation of the regulatory sandbox24 for the financial sector and the call for three editions of it.
24 Complete test bench.
3.1.3 Results
The BBVA Group generated a net attributable profit, excluding non-recurring impacts, of €5,069m in 2021, representing a year-on- year increase of +85.7%. Including these impacts —namely €+280m from the results of discontinued operations and €-696m from the net cost related to the restructuring process25 — the Group's net attributable profit amounted to €4,653m, which compares very positively with the €1,305m in the same period of the previous year, which included, in addition to the aforementioned results of discontinued operations, the capital gains of €304m from the implementation of the bancassurance agreement reached with Allianz.
In a complex environment, the Group's results in 2021 were influenced by the good performance in net interest income and net fees and commissions, i.e. recurring income from the banking business, which, together with the positive evolution of net trading income (NTI), offset the lower performance of the other operating income and expenses line. Thus, in constant terms, the gross income closed the year with a growth close to the double digit and higher than the growth in operating expenses, allowing an improvement in the efficiency ratio. Finally, in the lower part of the income statement, it is worth highlighting lower provisions for impairment on financial assets, which were particularly high in 2020 due to the outbreak of the pandemic.
(25) With regard to the recording of costs related to the restructuring process, it should be noted that, solely for management purposes and for the purpose of the comments provided in this report, these are included in the income statement line “Net cost related to the restructuring process”. The financial information is presented to the Group's Senior Management using this approach. This report includes a reconciliation between the management approach and the BBVA Group's Consolidated Financial Statements.
CONSOLIDATED INCOME STATEMENT: QUARTERLY EVOLUTION (MILLIONS OF EUROS)
| 2021 | 2020 | |||||||
|---|---|---|---|---|---|---|---|---|
| 4Q | 3Q | 2Q | 1Q | 4Q | 3Q | 2Q | 1Q | |
| Net interest income | 3,978 | 3,753 | 3,504 | 3,451 | 3,477 | 3,553 | 3,537 | 4,024 |
| Net fees and commissions | 1,247 | 1,203 | 1,182 | 1,133 | 1,042 | 1,023 | 934 | 1,124 |
| Net trading income | 438 | 387 | 503 | 581 | 175 | 357 | 470 | 544 |
| Other operating income and expenses | (187) | (13) | (85) | (11) | (147) | 46 | (80) | 86 |
| Gross income | 5,477 | 5,330 | 5,104 | 5,155 | 4,547 | 4,980 | 4,862 | 5,778 |
| Operating expenses | (2,554) | (2,378) | (2,294) | (2,304) | (2,264) | (2,163) | (2,182) | (2,477) |
| Personnel expenses | (1,399) | (1,276) | (1,187) | (1,184) | (1,186) | (1,124) | (1,113) | (1,272) |
| Other administrative expenses | (850) | (788) | (800) | (812) | (766) | (725) | (754) | (860) |
| Depreciation | (305) | (314) | (307) | (309) | (312) | (315) | (316) | (345) |
| Operating income | 2,923 | 2,953 | 2,810 | 2,850 | 2,282 | 2,817 | 2,679 | 3,300 |
| Impairment on financial assets not measured at fair value through profit or loss | (832) | (622) | (656) | (923) | (901) | (706) | (1,408) | (2,164) |
| Provisions or reversal of provisions | (40) | (50) | (23) | (151) | (139) | (88) | (219) | (300) |
| Other gains (losses) | 7 | 19 | (7) | (17) | (82) | (127) | (103) | (29) |
| Profit (loss) before tax | 2,058 | 2,299 | 2,124 | 1,759 | 1,160 | 1,895 | 950 | 807 |
| Income tax | (487) | (640) | (591) | (489) | (337) | (515) | (273) | (204) |
| Profit (loss) for the year | 1,571 | 1,659 | 1,533 | 1,270 | 823 | 1,380 | 678 | 603 |
| Non-controlling interests | (230) | (259) | (239) | (237) | (110) | (312) | (162) | (172) |
| Net attributable profit (loss) excluding non-recurring impacts | 1,341 | 1,400 | 1,294 | 1,033 | 713 | 1,068 | 516 | 431 |
| Profit (loss) after tax from discontinued operations (1) | — | — | 103 | 177 | 302 | 73 | 120 | (2,224) | Corporate operations (2) | — | — | — | — | 304 | — | — | — |
| Net cost related to the restructuring process | — | — | (696) | — | — | — | — | — |
| Net attributable profit (loss) | 1,341 | 1,400 | 701 | 1,210 | 1,320 | 1,141 | 636 | (1,792) |
| Adjusted earning (loss) per share (euros) (3) | 0.19 | 0.20 | 0.18 | 0.14 | 0.09 | 0.15 | 0.06 | 0.05 |
| Earning (loss) per share (euros) (3)(4) | 0.20 | 0.20 | 0.09 | 0.17 | 0.18 | 0.16 | 0.08 | (0.29) |
- General note: the results generated by BBVA USA and the rest of the companies in the United States sold to PNC on June 1, 2021, are presented in a single line as "Profit (loss) after tax from discontinued operations".
- (1) Profit (loss) after tax from discontinued operations includes the goodwill impairment in the United States registered in the first quarter of 2020 for an amount of €2,084m.
- (2) Net capital gains from the sale to Allianz of the half plus one share of the company created to jointly develop the non-life insurance business in Spain, excluding the health insurance line.
- (3)Adjusted by additional Tier 1 instrument remuneration. In the fourth quarter of 2021, 112 million shares acquired within the share buyback program in 2021 were considered.
- (4) In the fourth quarter of 2021, the estimated number of shares pending from buyback as of December 31, 2021 of the first tranche approved by the BBVA Board of Directors in October 2021 (€1,500m), in process at the end of the year 2021, was included.
CONSOLIDATED INCOME STATEMENT (MILLIONS OF EUROS)
| 2021 | ∆% | ∆% at constant exchange rates |
2020 | |
|---|---|---|---|---|
| Net interest income | 14,686 | 0.6 | 6.1 | 14,592 |
| Net fees and commissions | 4,765 | 15.6 | 19.8 | 4,123 |
| Net trading income | 1,910 | 23.5 | 30.5 | 1,546 |
| Other operating income and expenses | (295) | 210.6 | 222.4 | (95) |
| Gross income | 21,066 | 4.5 | 9.7 | 20,166 |
| Operating expenses | (9,530) | 4.9 | 8.5 | (9,088) |
| Personnel expenses | (5,046) | 7.5 | 11.5 | (4,695) |
| Other administrative expenses | (3,249) | 4.7 | 8.0 | (3,105) |
| Depreciation | (1,234) | (4.2) | (1.2) | (1,288) |
| Operating income | 11,536 | 4.1 | 10.8 | 11,079 |
| Impairment on financial assets not measured at fair value through profit or loss | (3,034) | (41.4) | (38.7) | (5,179) |
| Provisions or reversal of provisions | (264) | (64.6) | (62.8) | (746) |
| Other gains (losses) | 2 | n.s. | n.s. | (341) |
| Profit (loss) before tax | 8,240 | 71.2 | 86.8 | 4,813 |
| Income tax | (2,207) | 66.2 | 80.0 | (1,328) |
| Profit (loss) for the year | 6,034 | 73.1 | 89.3 | 3,485 |
| Non-controlling interests | (965) | 27.7 | 62.6 | (756) |
| Net attributable profit (loss) excluding non-recurring impacts | 5,069 | 85.7 | 95.5 | 2,729 |
| Profit (loss) after tax from discontinued operations (1) | 280 | n.s. | n.s. | (1,729) |
| Corporate operations (2) | — | — | — | 304 |
| Net cost related to the restructuring process | (696) | — | — | — |
| Net attributable profit (loss) | 4,653 | 256.6 | n.s. | 1,305 |
| Adjusted earning (loss) per share (euros)(3) | 0.71 | 0.35 | ||
| Earning (loss) per share (euros) (3)(4) | 0.67 | 0.14 |
- General note: the results generated by BBVA USA and the rest of the companies in the United States sold to PNC on June 1, 2021, are presented in a single line as "Profit (loss) after tax from discontinued operations".
- (1) Profit (loss) after tax from discontinued operations includes the goodwill impairment in the United States registered in the first quarter of 2020 for an amount of €2,084m.
- (2) Net capital gains from the sale to Allianz of the half plus one share of the company created to jointly develop the non-life insurance business in Spain, excluding the health insurance line.
- (3) Adjusted by additional Tier 1 instrument remuneration. In 2021, 112 million shares acquired within the share buyback program in 2021 were considered.
- (4) In 2021, the estimated number of shares pending from buyback as of December 31, 2021 of the first tranche approved by the BBVA Board of Directors in October 2021 (€1,500m), in process at the end of the year 2021, was included.
Unless expressly indicated otherwise, to better understand the changes under the main headings of the Group's income statement, the year-on-year rates of change provided below refer to constant exchange rates. In doing so, with regard to income statement amounts, average exchange rates for the year 2021 are used for each currency in the geographical areas where the Group operates for all periods.
Net interest income as of December 31, 2021 was higher than in the same period of the previous year (+6.1%), due to the good performance in South America, Mexico and Turkey, which offset the poor evolution in Spain and Rest of Business.
All areas, with the exception of Rest of Business, showed a positive performance in the net fees and commissions line compared to the accumulated amount reported in this line in 2020 (+19.8% in the Group), which is partly explained by the increase in activity and higher fees from payment systems, deposits and asset management in 2021, compared to 2020, which was affected by the removal of certain fees as a measure to support customers during the worst moments of the pandemic.
NET INTEREST INCOME/ATAS (1) (PERCENTAGE)
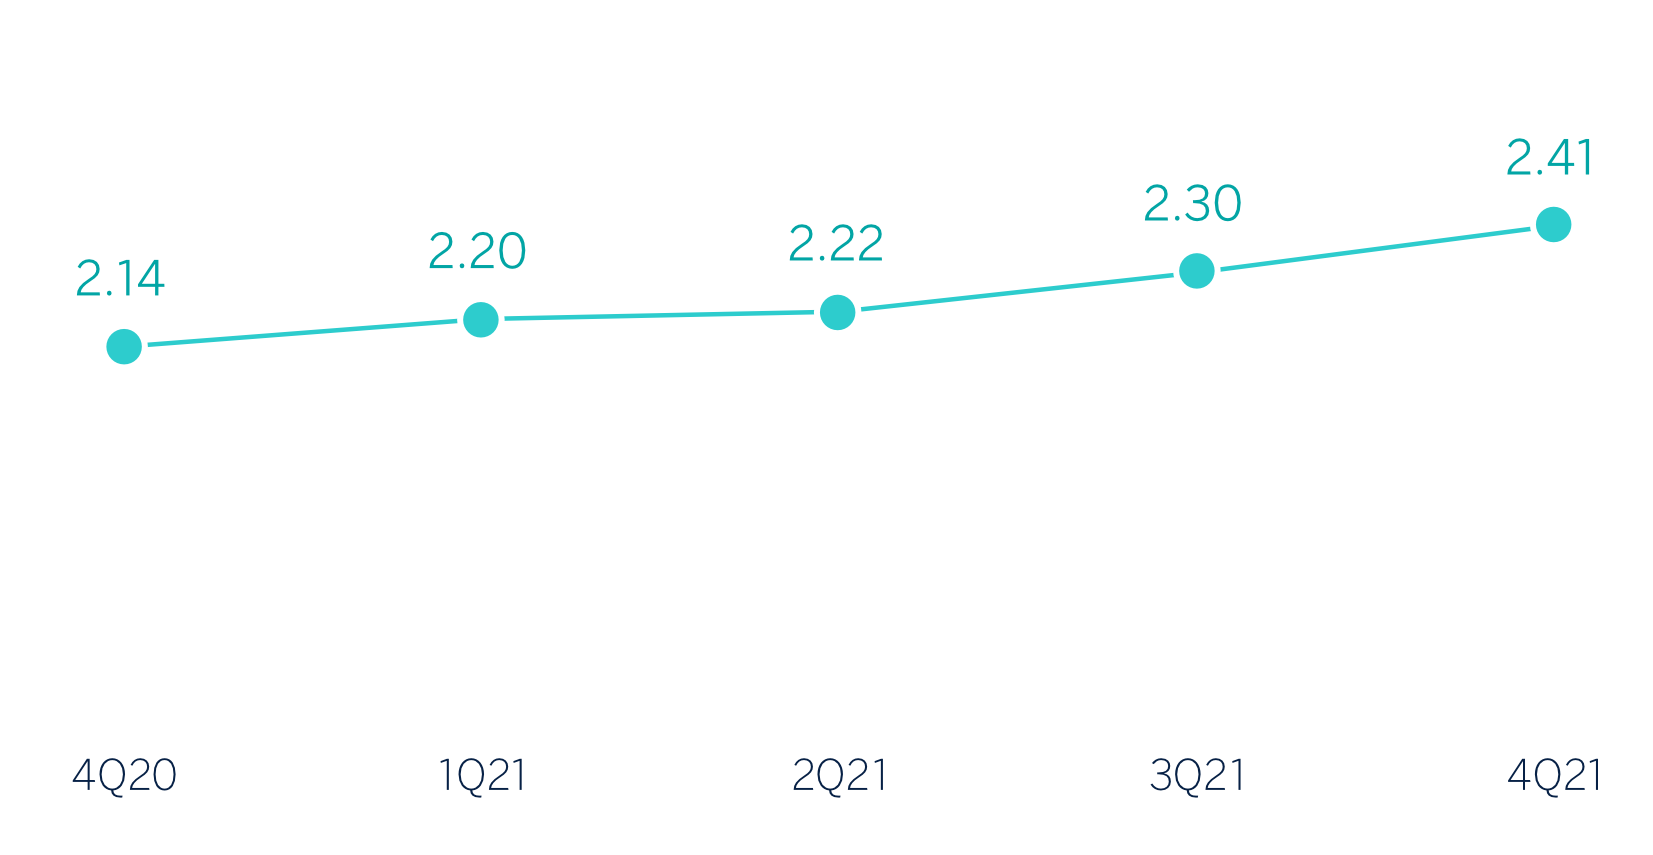
(1) Excluding BBVA USA and the rest of the companies in the United States sold to PNC on June 1, 2021.
NET INTEREST INCOME PLUS NET FEES AND COMMISSIONS (MILLIONS OF EUROS AT CONSTANT EXCHANGE RATES)
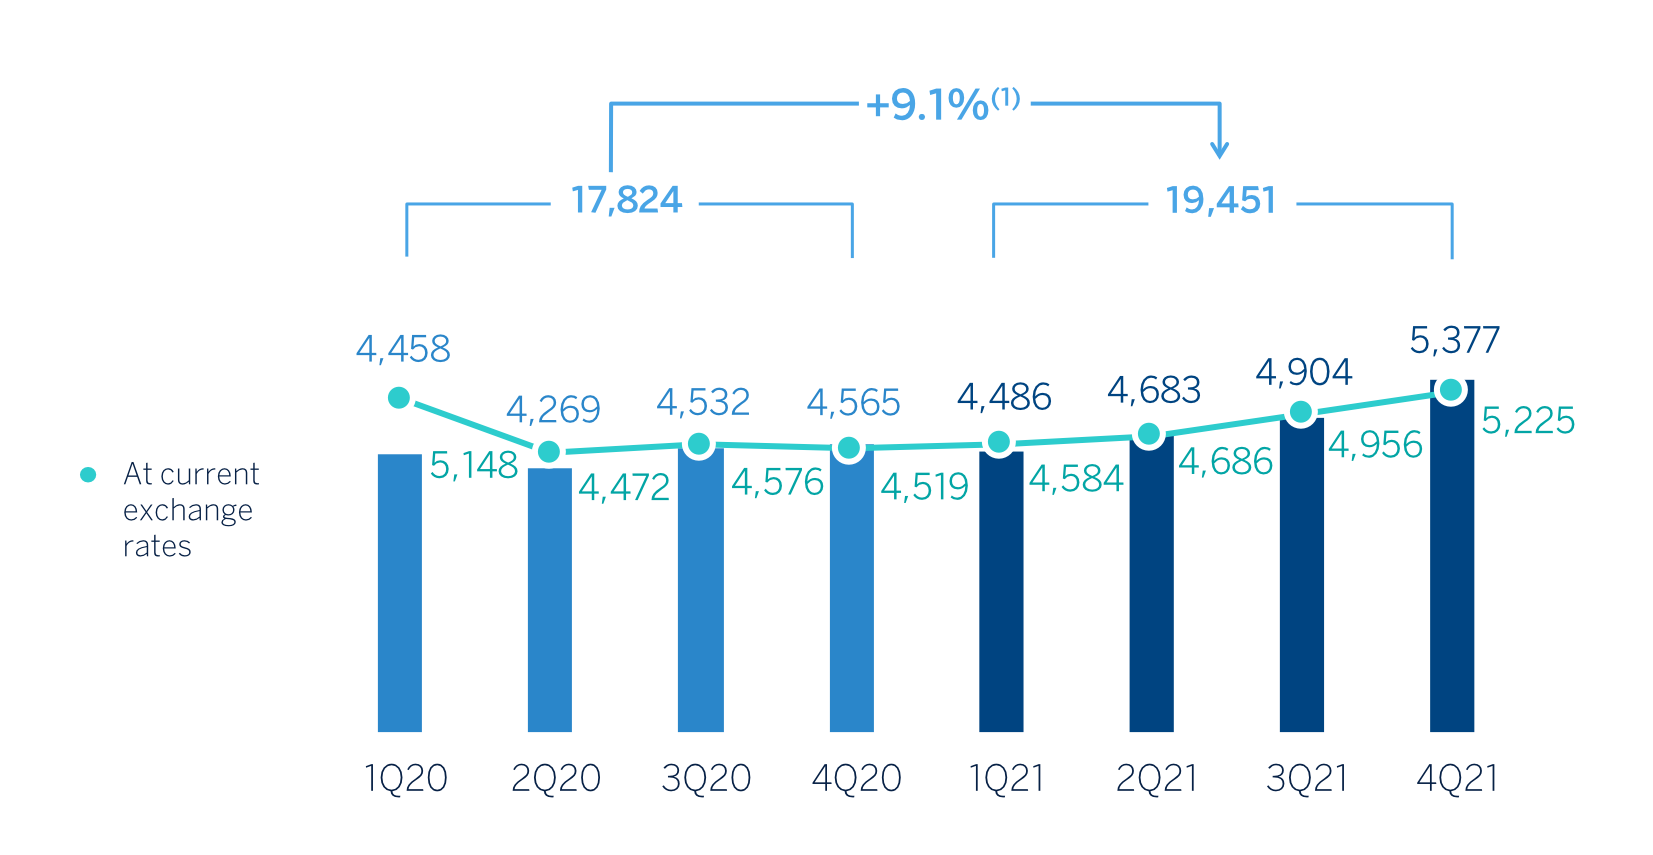
(1) At current exchange rates: +3.9%.
NTI showed a year-on-year increase of +30.5% as of December 31, 2021, mainly due to the good performance of the Global Markets unit in Turkey and Spain and the revaluations of the Group stakes in Funds & Investment Vehicles in tech companies and the industrial and financial portfolio.
The other operating income and expenses line accumulated a result of €-295m as of December 31, 2021, compared to €-95m in the same period last year, due to the higher negative adjustment for inflation in Argentina, the greater annual contribution of BBVA to the public deposit guarantee schemes, and the lower contribution of the insurance business in Spain due to the bancassurance operation with Allianz. This was partially offset by higher dividend income, better performance of the Group’s investments in subsidiaries, joint ventures and associates and the greater contribution of the leasing business in Turkey.
GROSS INCOME (MILLIONS OF EUROS AT CONSTANT EXCHANGE RATES)
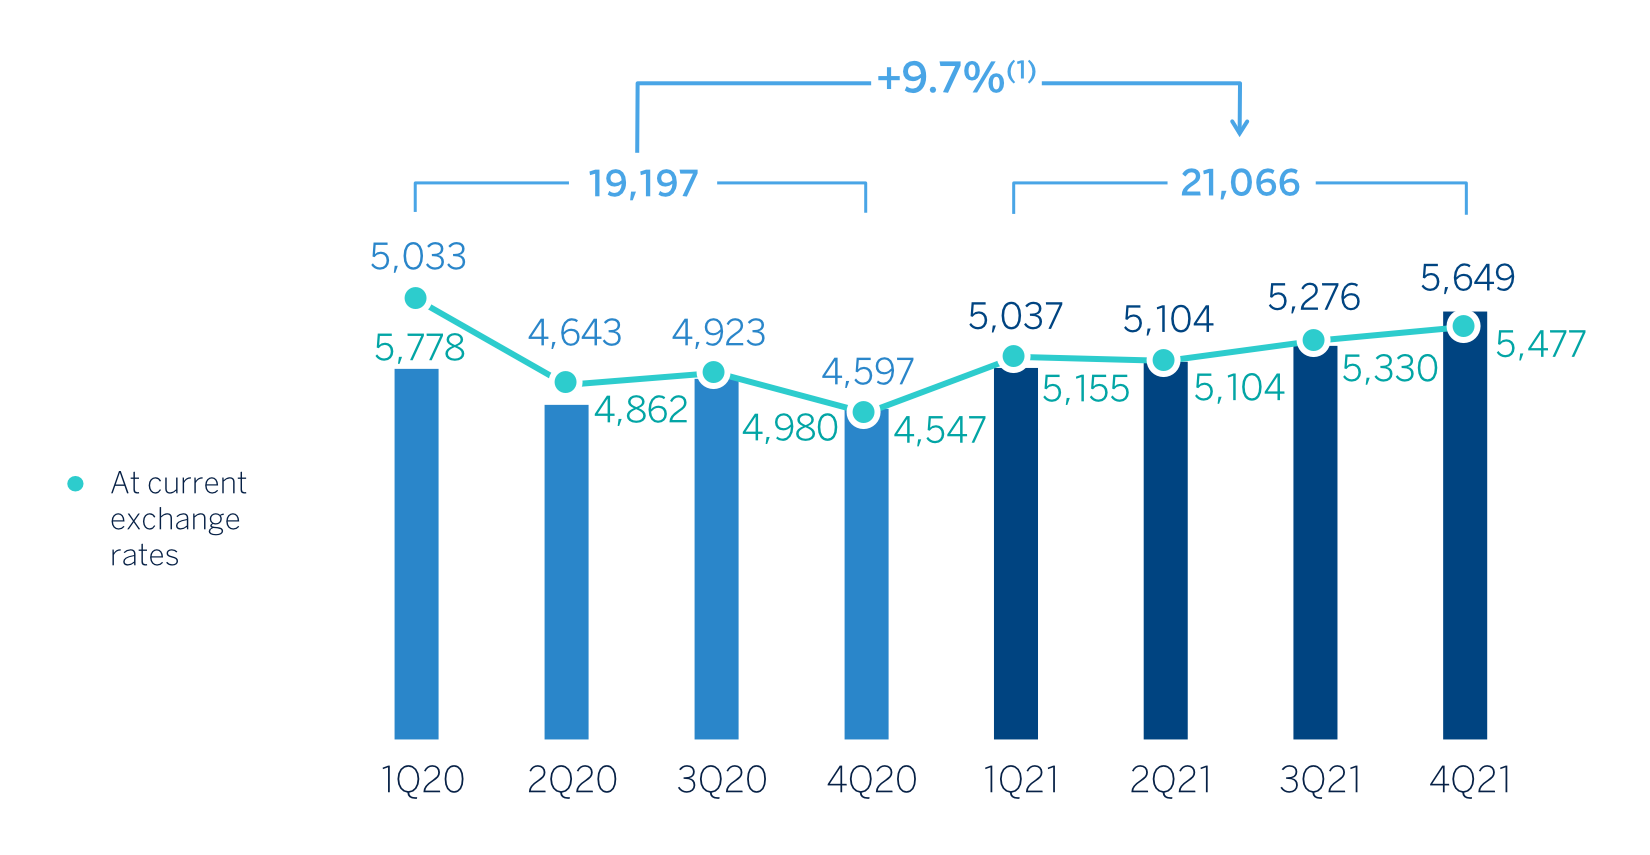
(1) At current exchange rates: +4.5%.
Operating expenses increased (+8.5% in year-on-year terms) in all areas except Spain, where they remained contained and Rest of Business, where they decreased. This growth is framed within an environment of activity recovery and high inflation.
The efficiency ratio stood at 45.2% as of December 31, 2021, with an improvement of 53 basis points over the ratio at the end of December 2020.
OPERATING EXPENSES (MILLIONS OF EUROS AT CONSTANT EXCHANGE RATES)
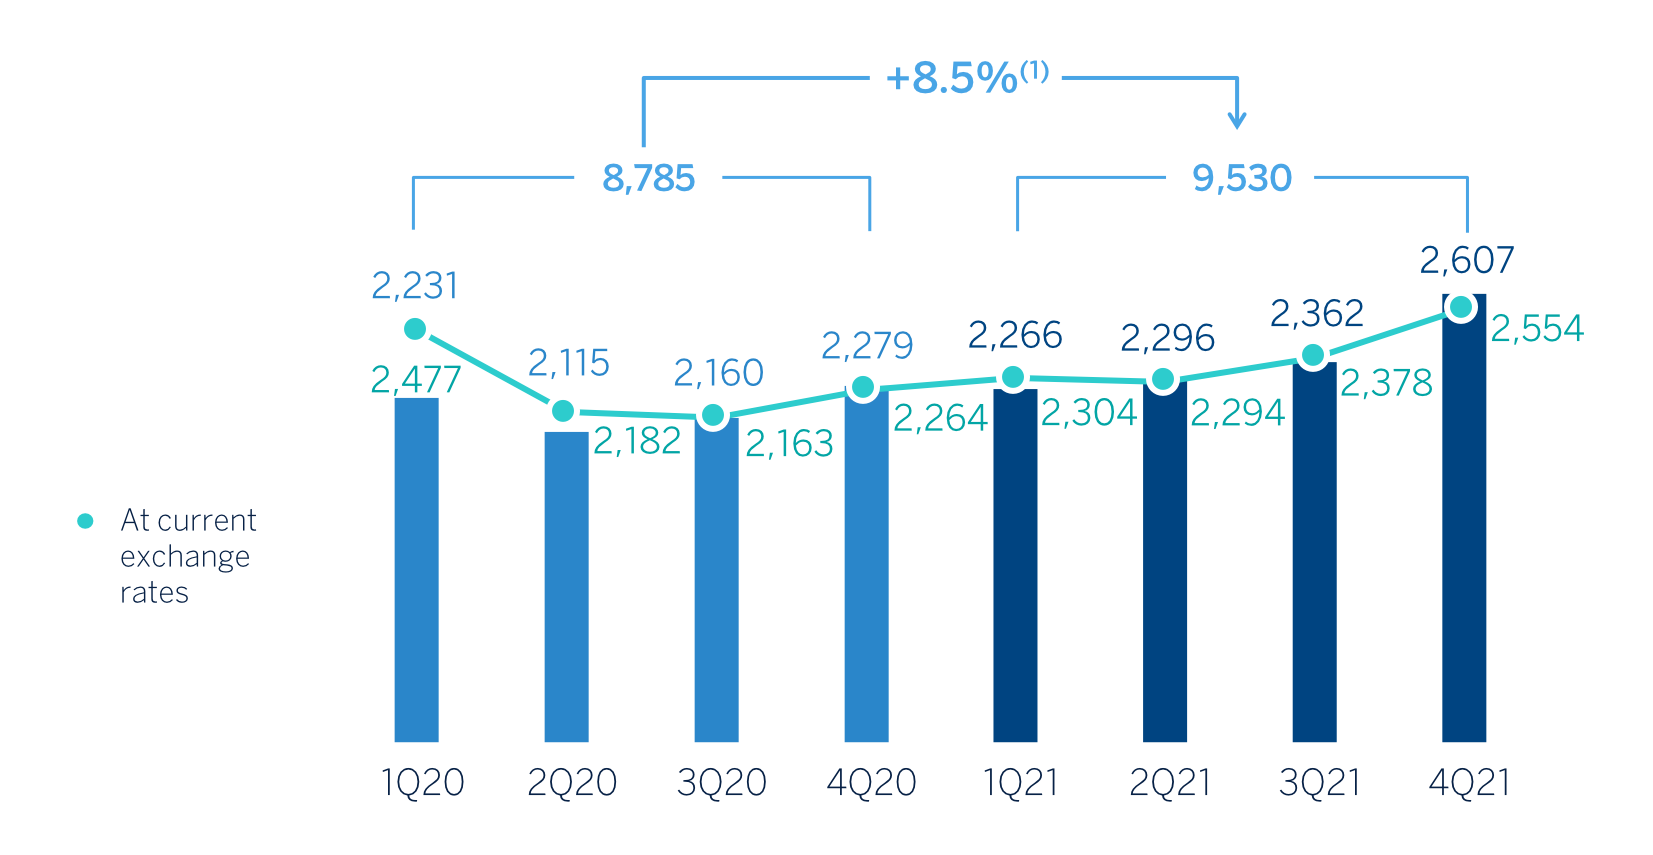
(1) At current exchange rates: +4.9%.
EFFICIENCY RATIO (PERCENTAGE)

Impairment on financial assets not measured at fair value through profit or loss (impairment on financial assets) closed December, 2021 with a negative balance of €3,034m, significantly lower than the previous year (-38.7%) and with a decrease in all geographical areas mainly due to the negative impact of provisions for COVID-19 in 2020.
OPERATING INCOME (MILLIONS OF EUROS AT CONSTANT EXCHANGE RATES)
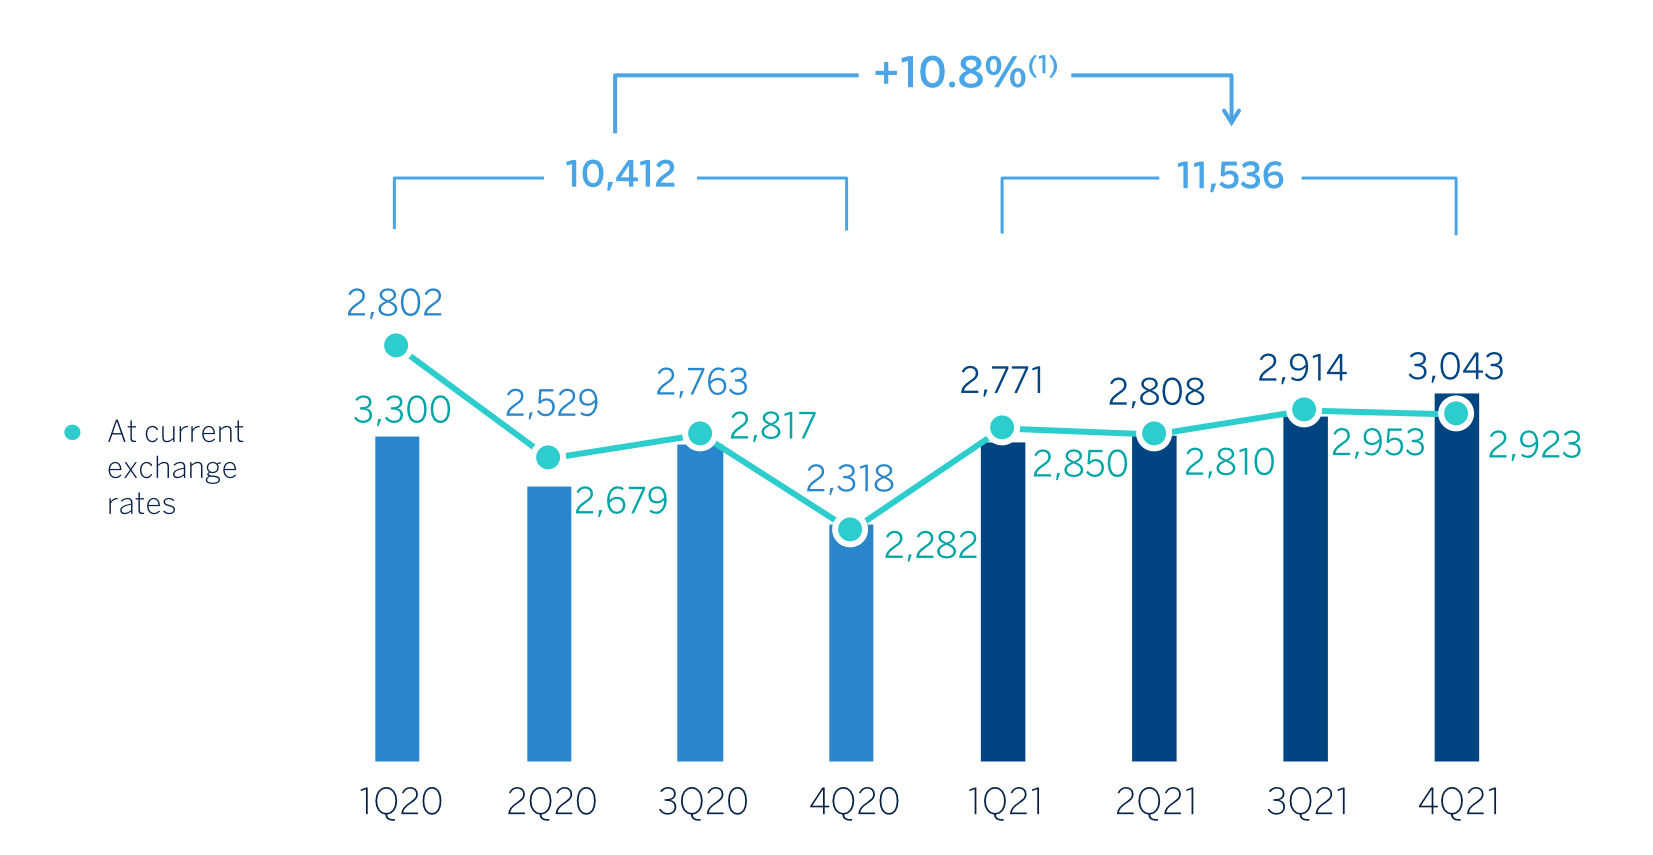
(1) At current exchange rates: +4.1%.
IMPAIRMENT ON FINANCIAL ASSETS (MILLIONS OF EUROS AT CONSTANT EXCHANGE RATES)

(1) At current exchange rates: -41.4%.
The provisions or reversal of provisions line (hereinafter "provisions") closed with a negative balance of €-264m as of December 31, 2021, -62.8% below the figure accumulated in the same period of the last year, mainly due to provisions to meet potential claims in Spain and to increased provisions for special funds and contingent risk and commitments in Turkey, in both cases registered in 2020.
With regard to other gains (losses) line, it closed December 2021 with a positive balance of €2m, an improvement on the figure reached the previous year (€-341m), mainly due to the impairment of investments in subsidiaries, joint ventures and associates in 2020 registered at the Corporate Center.
As a result of the above, the BBVA Group generated a net attributable profit, excluding non-recurring impacts, of €5,069m in 2021, representing a year-on-year increase of +95.5%. These non-recurring impacts include:
- - The results generated by BBVA USA and the rest of the companies included in the sale agreement to PNC and classified as discontinued operations, which generated €280m in 2021 until the closing of the operation on 1 June, 2021, contrasting very positively with the negative result of €-1,729m accumulated between January and December 2020, which included the impact of the goodwill impairment in the United States. These results are recorded in the "Profit (loss) after tax from discontinued operations" line of the Corporate Center's income statement.
- - The net cost related to the restructuring process of BBVA S.A. in Spain which amounted to €-696m, of which, before tax, €-754m correspond to the collective layoff and €-240m to branches closures. These costs are also recorded in the income statement of the Corporate Center.
Taking into account both impacts, the Group's net attributable profit between January and December 2021 amounted to €4,653m, which compares very positively with the €1,305m in the same period of the previous year, which included, in addition to the aforementioned results of discontinued operations, the capital gains of €304m from the implementation of the bancassurance agreement reached with Allianz.
The cumulative net attributable profits, in millions of euros, at the close of December 2021 for the various business areas that comprise the Group were as follows: €1,581m in Spain, €2,568m in Mexico, €740m in Turkey, €491m in South America and €254m in Rest of Business.
NET ATTRIBUTABLE PROFIT (LOSS) (MILLIONS OF EUROS AT CONSTANT EXCHANGE RATES)

Note: year-on-year variation at current exchange rates of +256.6%.
NET ATTRIBUTABLE PROFIT (LOSS) EXCLUDING NONRECURRING IMPACTS (MILLIONS OF EUROS AT CONSTANT EXCHANGE RATES)

General note: non-recurring impacts include: (I) BBVA USA and the rest of the companies in the United States sold to PNC on June 1, 2021 in all periods; (II) the net cost related to the restructuring process as of 2Q21; and (III) the net capital gain from the bancassurance operation with Allianz as of 4Q20.
(1) At current exchange rates: +85.7%.
TANGIBLE BOOK VALUE PER SHARE (1)(2) AND DIVIDENDS (EUROS)

General note: replenishing dividends paid in the period.
ADJUSTED EARNING (LOSS) PER SHARE (1) AND EARNING (LOSS) PER SHARE (1)(2) (EUROS)
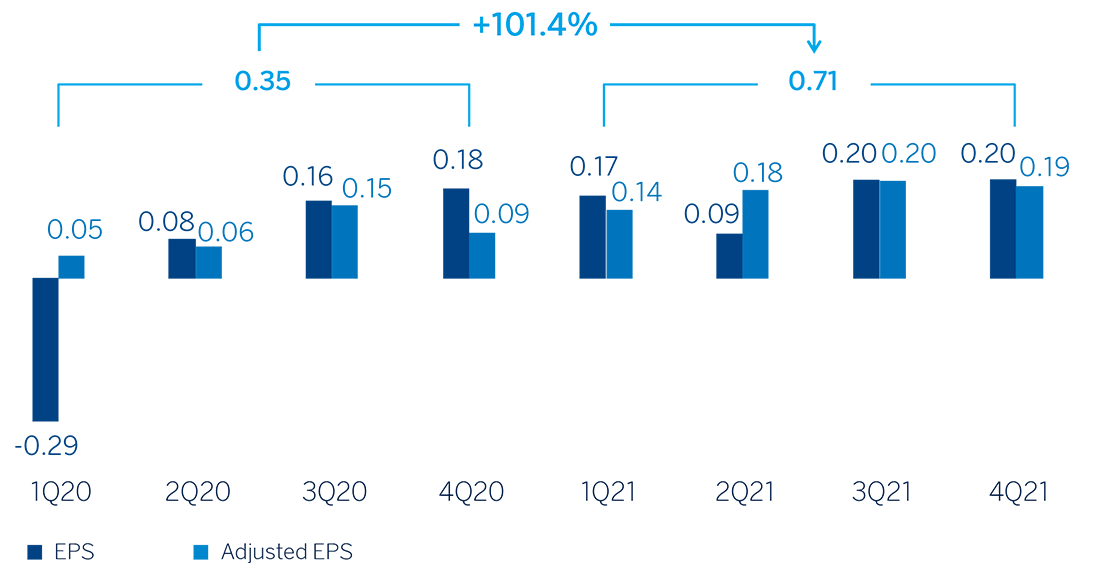
General note: adjusted earning per share excludes: (I) BBVA USA and the rest of the companies in the United States sold to PNC on June 1, 2021, in all periods; (II) the net cost related to the restructuring process as of 2Q21; and (III) the net capital gain from the bancassurance operation with Allianz as of 4Q20.
The Group’s profitability indicators improved compared to the end of December 2020, supported by the favorable performance of results.
ROE AND ROTE (1) (PORCENTAGE)
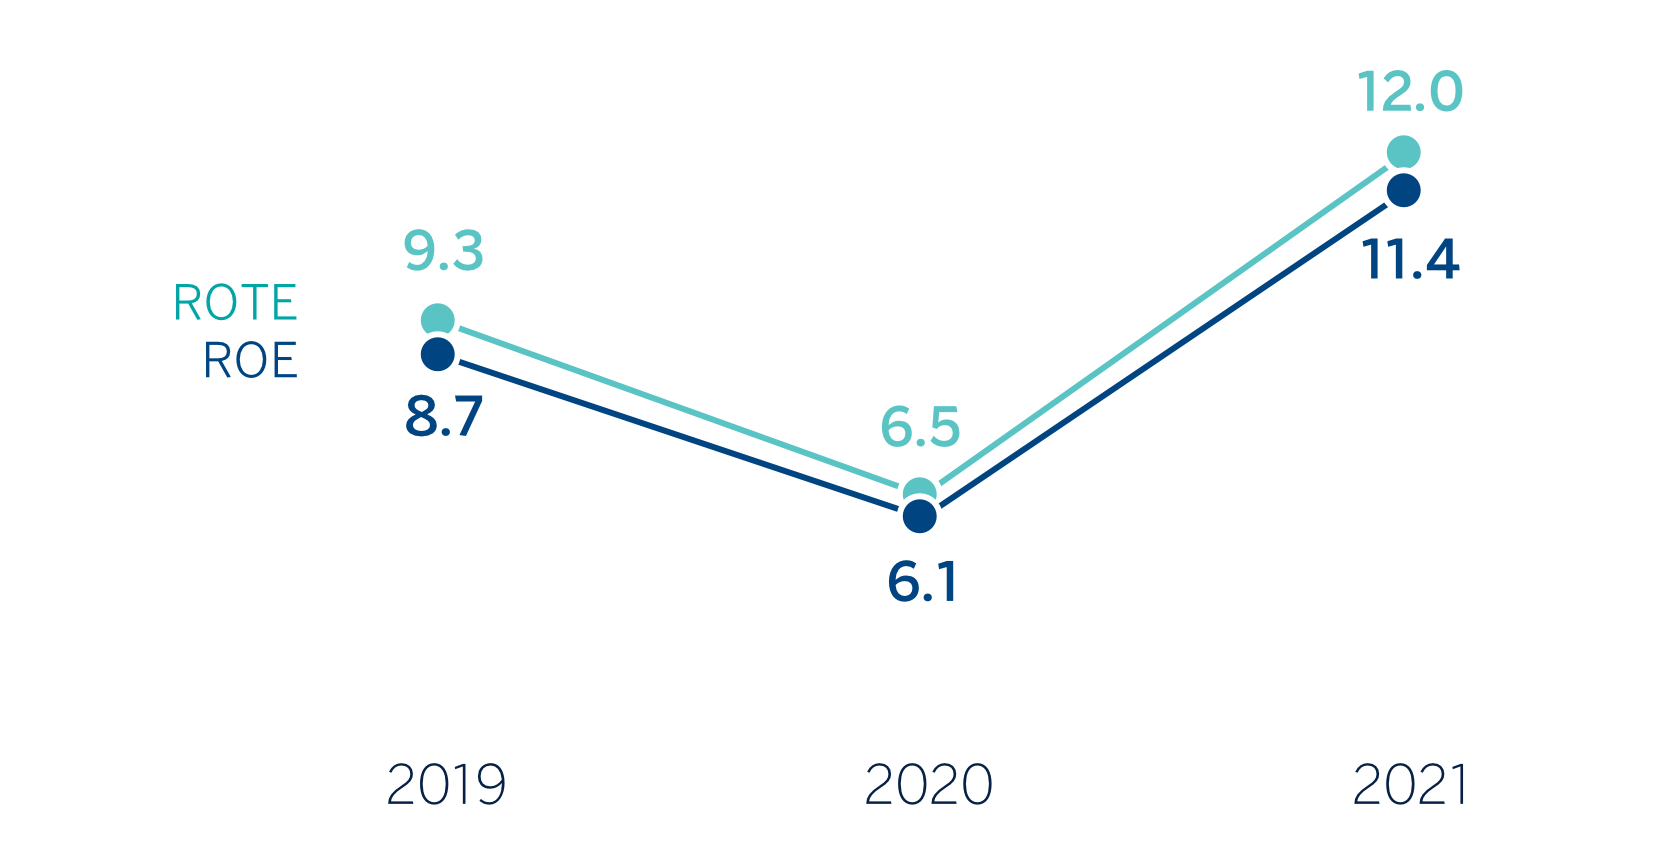
(1) Excludes: (I) BBVA USA and the rest of the companies in the United States sold to PNC on June 1, 2021 in all periods; (II) the net cost related to the restructuring process in 2021; and (III) the net capital gain from the bancassurance operation with Allianz as of 2020.
ROA AND RORWA (1) (PORCENTAGE)
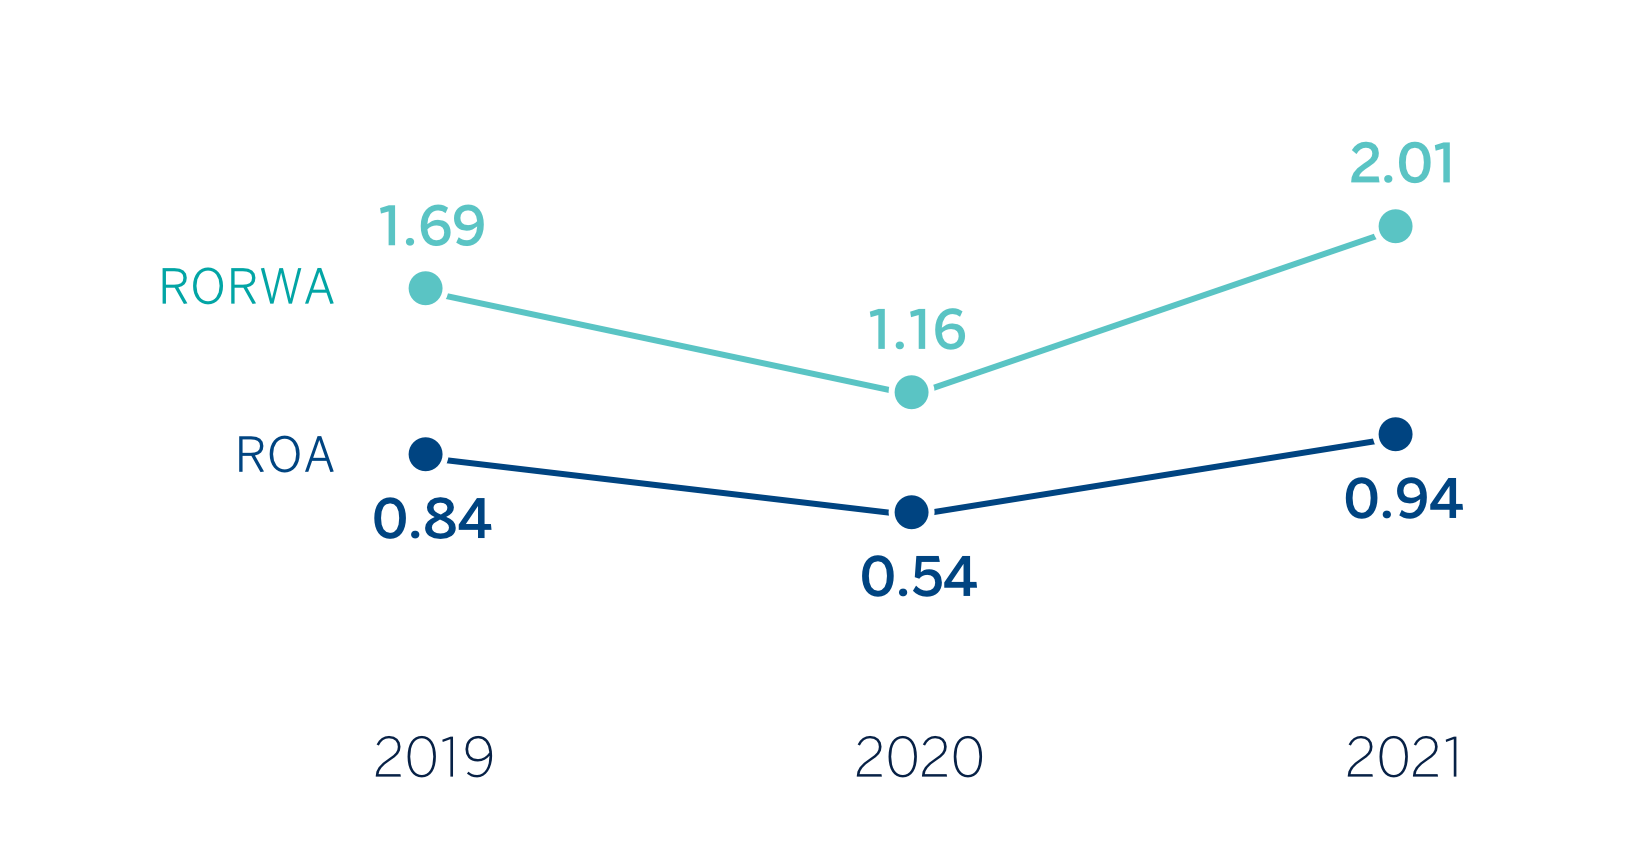
(1) Excludes: (I) BBVA USA and the rest of the companies in the United States sold to PNC on June 1, 2021 in all periods; (II) the net cost related to the restructuring process in 2021; and (III) the net capital gain from the bancassurance operation with Allianz as of 2020.
3.1.4 Balance sheet and business activity
The most relevant aspects related to the evolution of the Group's balance sheet and business activity as of December 31, 2021 are summarized below:
- - Loans and advances to customers recorded a growth of 2.5% compared to the end of December 2020, mainly due to the performance of business loans (+3.0%) and, to a lesser extent, loans to individuals (+1.5% in the year), which were strongly supported by consumer loans and credit cards (+5.7 overall).
- - Customer funds showed an increase of 4.5% compared to the end of December 2020, thanks to the good performance of both deposits from customers (+2.1%) and off-balance sheet funds (+12.5%). The interest rate situation has led to customers' preference for demand deposits and mutual funds (which grew by 15.3% compared to the end of the previous year) over time deposits (which decreased by 27.2% compared to December 2020), mainly in Spain, Turkey and Rest of Business. This evolution was offset by growth in demand deposits (+10.1%) in the main geographical areas, with the exception of Turkey, and growth in mutual funds (+15.3%), with Spain, Mexico and, to a lesser extent, Turkey standing out.
- - The year-on-year decrease in the BBVA Group’s total assets (-9.7%) and liabilities (-10.2%) is explained by the sale of BBVA USA and the rest of the companies in the United States included in the agreement with PNC, which materialized on June 1, 2021.
CONSOLIDATED BALANCE SHEET (MILLIONS OF EUROS)
| 31-12-21 | ∆% | 31-12-20 | |
|---|---|---|---|
| Cash, cash balances at central banks and other demand deposits | 67,799 | 3.5 | 65,520 |
| Financial assets held for trading | 123,493 | 16.6 | 105,878 |
| Non-trading financial assets mandatorily at fair value through profit or loss | 6,086 | 17.1 | 5,198 |
| Financial assets designated at fair value through profit or loss | 1,092 | (2.2) | 1,117 |
| Financial assets at fair value through accumulated other comprehensive income | 60,421 | (13.0) | 69,440 |
| Financial assets at amortized cost | 372,676 | 1.4 | 367,668 |
| Loans and advances to central banks and credit institutions | 18,957 | (8.8) | 20,784 |
| Loans and advances to customers | 318,939 | 2.5 | 311,147 |
| Debt securities | 34,781 | (2.7) | 35,737 |
| Investments in subsidiaries, joint ventures and associates | 900 | (37.3) | 1,437 |
| Tangible assets | 7,298 | (6.7) | 7,823 |
| Intangible assets | 2,197 | (6.3) | 2,345 |
| Other assets | 20,923 | (80.5) | 107,373 |
| Total assets | 662,885 | (9.7) | 733,797 |
| Financial liabilities held for trading | 91,135 | 8.4 | 84,109 |
| Other financial liabilities designated at fair value through profit or loss | 9,683 | (3.6) | 10,050 |
| Financial liabilities at amortized cost | 487,893 | (0.6) | 490,606 |
| Deposits from central banks and credit institutions | 67,185 | (7.7) | 72,806 |
| Deposits from customers | 349,761 | 2.1 | 342,661 |
| Debt certificates | 55,763 | (9.7) | 61,780 |
| Other financial liabilities | 15,183 | 13.7 | 13,358 |
| Liabilities under insurance and reinsurance contracts | 10,865 | 9.2 | 9,951 |
| Other liabilities | 14,549 | (83.7) | 89,061 |
| Total liabilities | 614,125 | (10.2) | 683,777 |
| Non-controlling interests | 4,853 | (11.3) | 5,471 |
| Accumulated other comprehensive income | (16,476) | 14.8 | (14,356) |
| Shareholders’ funds | 60,383 | 2.5 | 58,904 |
| Total equity | 48,760 | (2.5) | 50,020 |
| Total liabilities and equity | 662,885 | (9.7) | 733,797 |
| Memorandum item: | |||
| Guarantees given | 45,956 | 6.1 | 43,294 |
- General note: in 2020, the "Other assets" and "Other liabilities" figures mainly include the non-current assets and liabilities held for sale related to BBVA USA and the rest of the companies sold to PNC on June 1, 2021.
LOANS AND ADVANCES TO CUSTOMERS (MILLIONS OF EUROS)
| 31-12-20 | ∆% | 31-12-19 | |
|---|---|---|---|
| Public sector | 19,656 | 1.5 | 19,363 |
| Individuals | 146,433 | 1.5 | 144,304 |
| Mortgages | 91,324 | (0.1) | 91,428 |
| Consumer | 31,026 | 4.9 | 29,571 |
| Credit cards | 12,936 | 7.7 | 12,016 |
| Other loans | 11,146 | (1.3) | 11,289 |
| Business | 149,309 | 3.0 | 144,912 |
| Non-performing loans | 14,657 | (0.1) | 14,672 |
| Loans and advances to customers (gross) | 330,055 | 2.1 | 323,252 |
| Allowances (1) | (11,116) | (8.2) | (12,105) |
| Loans and advances to customers | 318,939 | 2.5 | 311,147 |
- (1) Allowances include the valuation adjustments for credit risk during the expected residual life of those financial instruments which have been acquired (mainly originated from the acquisition of Catalunya Banc, S.A.). As of December 31, 2021 and December 31, 2020 the remaining amount was €266m and €363m, respectively.
The evolution of loans and advances to customers and the customer funds of the BBVA Group for the years 2019, 2020 and 2021 is shown below. For a more homogeneous comparison, the balances of the entire series exclude BBVA USA and the rest of the companies in the United States sold to PNC on June 1, 2021.
LOANS AND ADVANCES TO CUSTOMERS (BILLIONS OF EUROS)
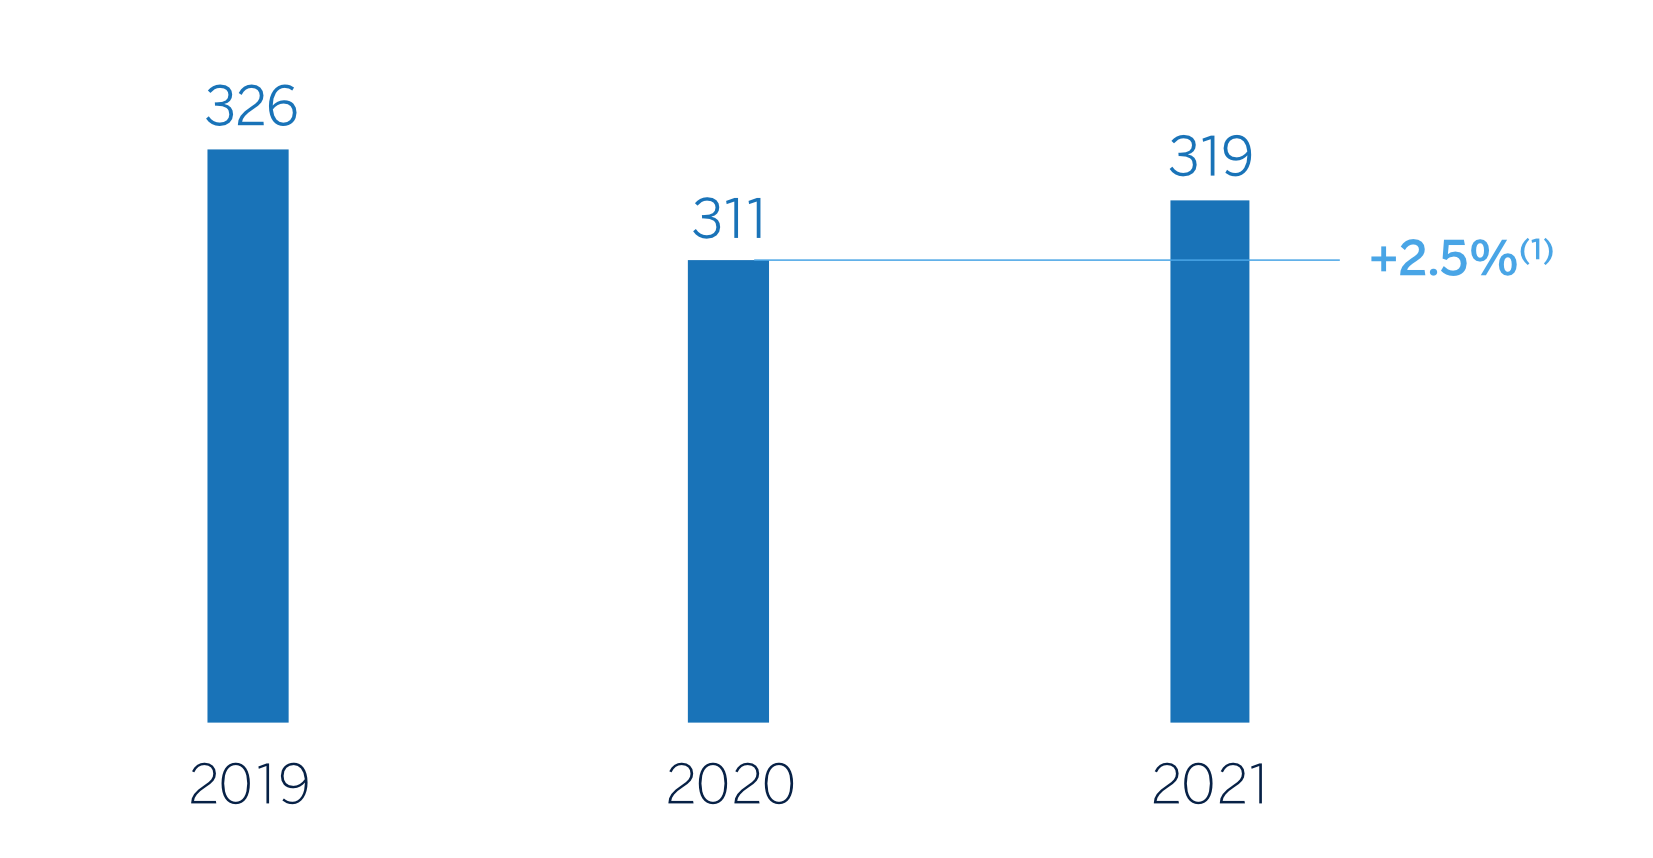
(1) A tipos de cambio constantes: +7,0%
CUSTOMER FUNDS (BILLIONS OF EUROS)
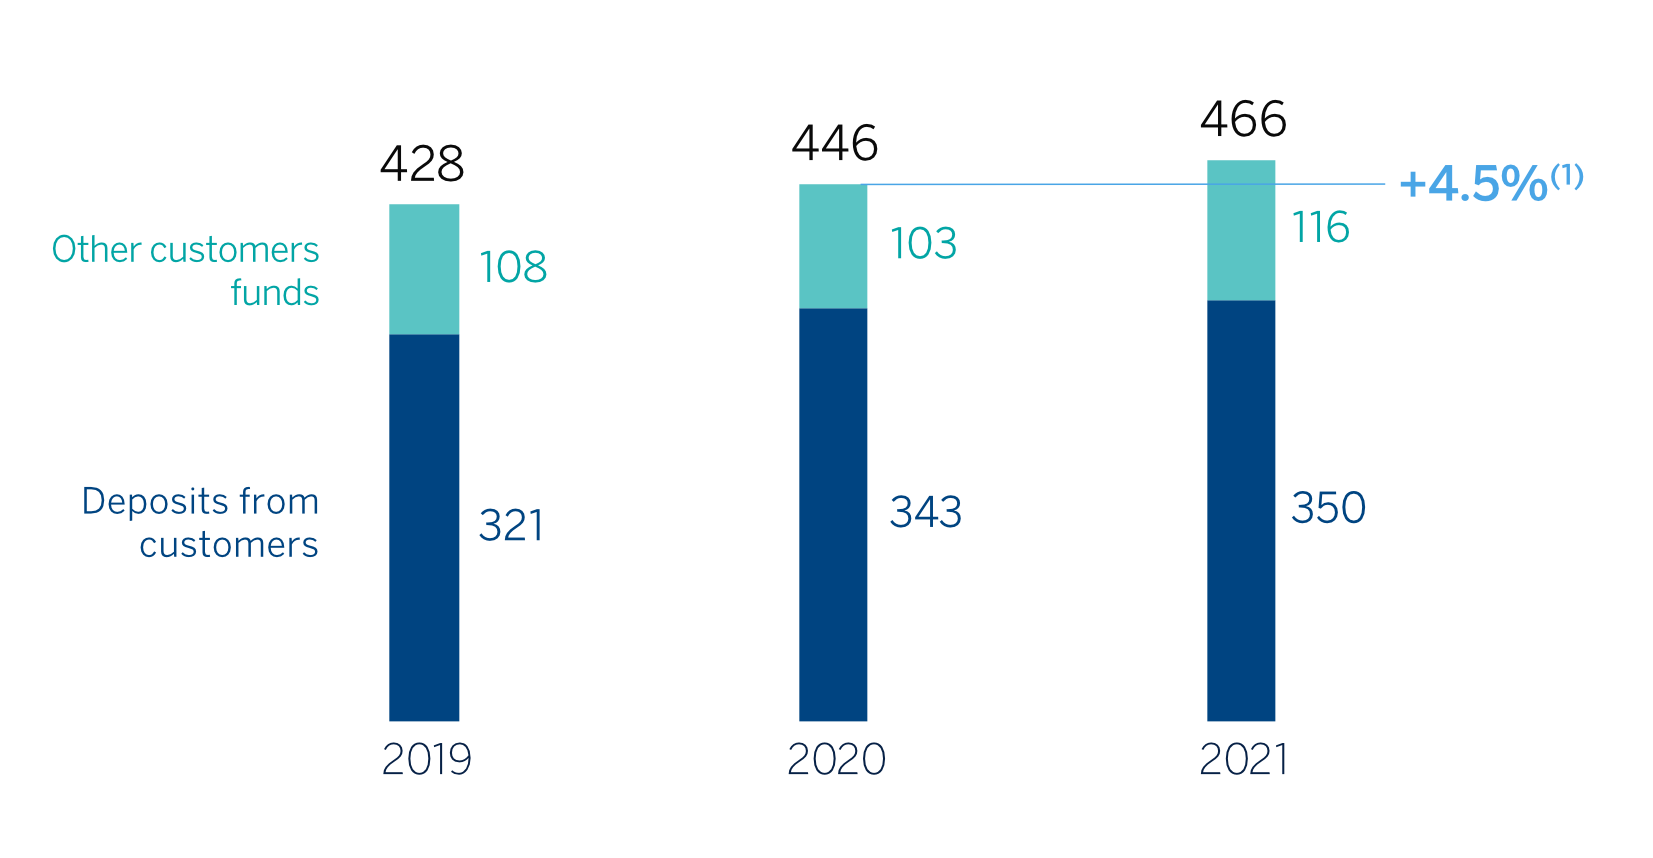
(1) A tipos de cambio constantes: +7,7%
CUSTOMER FUNDS (MILLIONS OF EUROS)
| 31-12-21 | ∆% | 31-12-20 | |
|---|---|---|---|
| Deposits from customers | 349,761 | 2.1 | 342,661 |
| Current accounts | 293,015 | 10.1 | 266,250 |
| Time deposits | 55,059 | (27.2) | 75,610 |
| Other deposits | 1,687 | 110.6 | 801 |
| Other customer funds | 115,767 | 12.5 | 102,947 |
| Mutual funds and investment companies | 74,810 | 15.3 | 64,869 |
| Pension funds | 38,763 | 7.0 | 36,215 |
| Other off-balance sheet funds | 2,195 | 17.8 | 1,863 |
| Total customer funds | 465,529 | 4.5 | 445,608 |
3.1.5 Solvency
Capital base
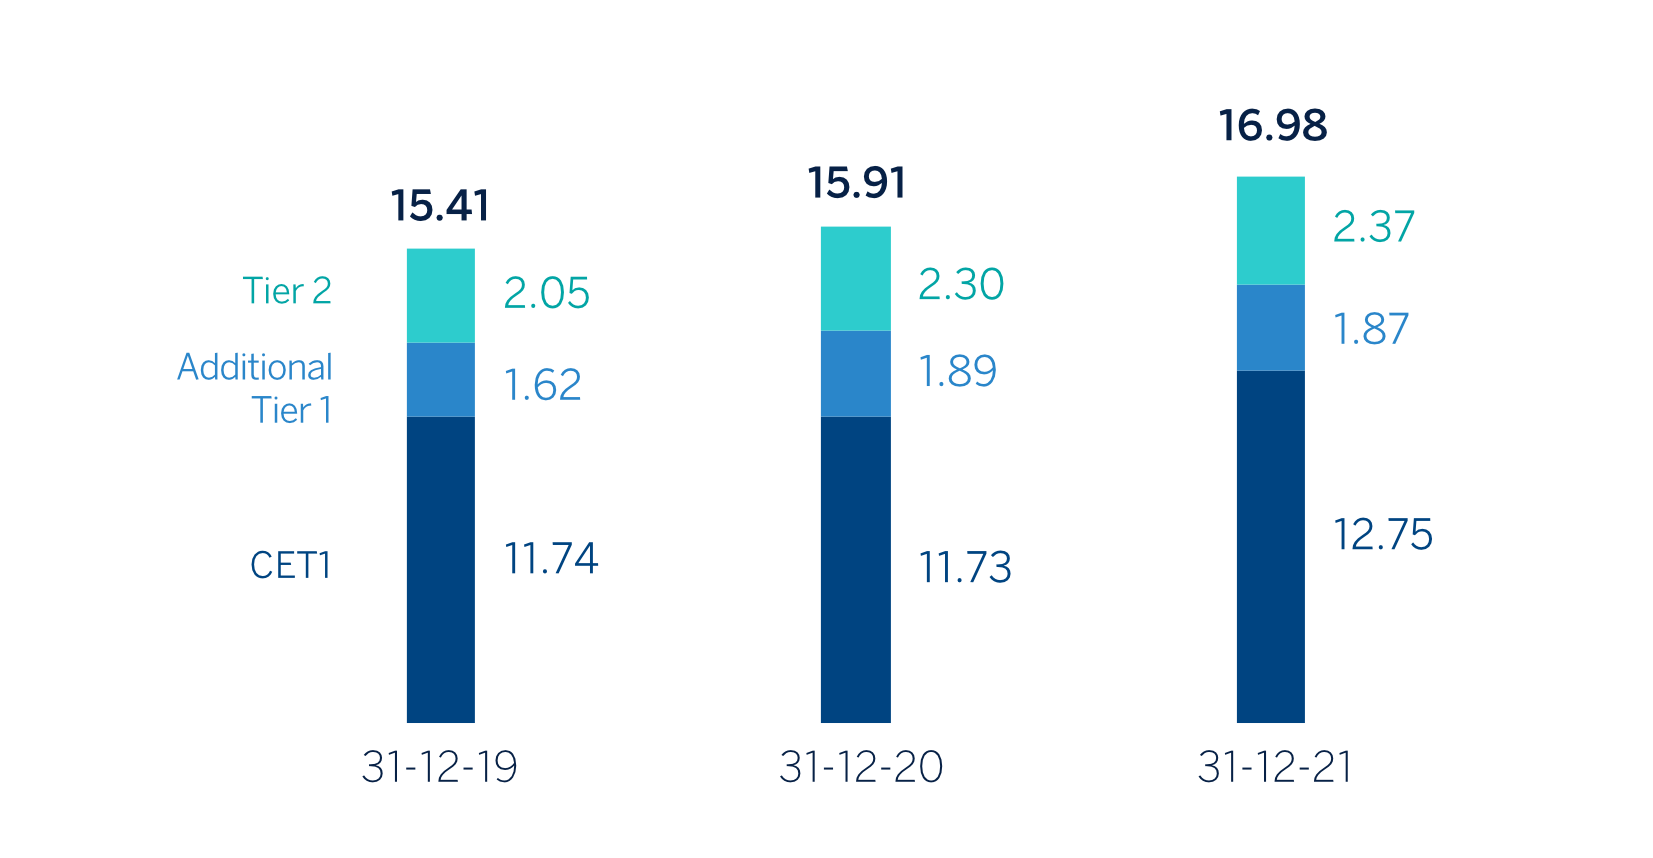
The Group's CET1 Fully-loaded ratio stood at 12.75% as of December 31, 2021, which represents a decrease in in the quarter (-173 basis points), although it maintains a large management buffer on the Group's capital requirements and is above the management target, which is to be within the range of 11.5-12% CET1. This CET1 level includes the deduction of the total amount of the share buyback program authorized by the supervisor, amounting to maximum €3.500m and representing an impact of approximately -130 basis points. For more information on the Group' share buyback program, please see "Other highlights" at the end of the "Highlights" section.
In addition to the above-mentioned effect, during the fourth quarter of 2021, the recurrent income generation net of dividends and remunerations of AT1 instruments contributed 18 basis points. On the other hand, the growth of risk-weighted assets (RWAs) had an impact of -49 basis points, which is mostly explained by the growth of activity in the quarter and additionally, to a lesser extent, by the update of the RWAs for operational risk (which is carried out annually, and which is explained by the increase in the level of revenues compared to previous periods) and by the growth of the RWAs that are specific to market activity and are exposed to higher volatility. Finally, the other items affecting the CET1, most notably the effect of exchange rate evolution and portfolio valuation, resulted in a reduction of 12 basis points.
The consolidated fully-loaded additional Tier 1 capital (AT1) stood at 1.87% as of December 31, 2021, which results in a decrease of -4 basis points compared to the previous quarter.
The consolidated fully-loaded Tier 2 ratio as of December 31, 2021 stood at 2.37%, a decrease of -11 basis points in the quarter. The total fully-loaded capital adequacy ratio stands at 16.98%.
Following the latest SREP (Supervisory Review and Evaluation Process) decision, received on February, 2022 and applicable as from March 1, 2022, the ECB has informed the Group that the Pillar 2 requirement would remain at 1.5% (of which 0.84% must be CET1 at least). Therefore, BBVA must maintain a CET1 capital ratio of 8.60% and a total capital ratio of 12.76% at the consolidated level.
The phased-in CET1 ratio, on consolidated terms, stood at 12.98% as of December 31, 2021, considering the transitory effect of the IFRS 9 standard. AT1 reached 1.86% and Tier 2 reached 2.40%, resulting in a total capital adequacy ratio of 17.24%.
FULLY-LOADED CAPITAL RATIOS (PORCENTAGE)
(1) At current exchange rates: +4.5%
CAPITAL BASE (MILLIONS OF EUROS)
| CRD IV phased-in | CRD IV fully-loaded | |||||
|---|---|---|---|---|---|---|
| 31-12-21 (1) (2) | 31-12-20 | 31-12-19 | 31-12-21 (1) (2) | 31-12-20 | 31-12-19 | |
| Common Equity Tier 1 (CET 1) | 39,937 | 42,931 | 43,653 | 39,172 | 41,345 | 42,856 |
| Tier 1 | 45,674 | 49,597 | 49,701 | 44,910 | 48,012 | 48,775 |
| Tier 2 | 7,383 | 8,547 | 8,304 | 7,283 | 8,101 | 7,464 |
| Total Capital (Tier 1 + Tier 2) | 53,057 | 58,145 | 58,005 | 52,193 | 56,112 | 56,240 |
| Risk-weighted assets | 307,791 | 353,273 | 364,448 | 307,331 | 352,622 | 364,942 |
| CET1 (%) | 12.98 | 12.15 | 11.98 | 12.75 | 11.73 | 11.74 |
| Tier 1 (%) | 14.84 | 14.04 | 13.64 | 14.61 | 13.62 | 13.37 |
| Tier 2 (%) | 2.40 | 2.42 | 2.28 | 2.37 | 2.30 | 2.05 |
| Total capital ratio (%) | 17.24 | 16.46 | 15.92 | 16.98 | 15.91 | 15.41 |
- (1) As of December 31, 2021, the difference between the phased-in and fully-loaded ratios arises from the temporary treatment of certain capital items, mainly of the impact of IFRS 9, to which the BBVA Group has adhered voluntarily (in accordance with article 473bis of the CRR and the subsequent amendments introduced by the Regulation (EU) 2020/873).
- (2) Preliminary data.
With regard to MREL (Minimum Requirement for own funds and Eligible Liabilities) requirements, BBVA must reach, by January 1, 2022, an amount of own funds and eligible liabilities equal to 24.78%26 of the total RWAs of its resolution group, at a sub- consolidated27 level (hereinafter, the "MREL in RWAs"). This is currently the most restrictive requirement for BBVA. Given the structure of own funds and admissible liabilities of the resolution group, as of December 31, 2021, the MREL ratio in RWAs stands at 28.34%28 29, complying with the aforementioned MREL requirement.
With the aim of reinforcing compliance with these requirements, in March 2021, BBVA carried out an issue of a senior preferred debt for an amount of €1 billion, with a maturity of 6 years and an option for early redemption after five years. In September 2021, BBVA issued a €1 billion a floating rate senior preferred social bond, maturing in 2 years. These issuances have mitigated the loss of eligibility of three issuances, two senior preferred issues and one senior non-preferred issue issued during 2017 and reaching their maturity in 2021. In this regard, in January 2022, a senior non-preferred bond for €1 billion has been issued, with a maturity of 7 years and an option for early redemption in the sixth year, with a coupon of 0.875%, although it is not taken into account for the December 2021 ratios.
In November 2015 (with effect from 1 January 2017) BBVA ceased to be part of the list of Global Systemically Important Banks (G- SIBs). This list is drawn up annually by the Financial Stability Board (FSB) on the basis of a set of quantitative indicators which are available, together with the assessment methodology, at www.bis.org/bcbs/gsib/. In November 2020, BBVA, at consolidated level, was again identified as an Other Systemically Important Institution (hereinafter referred to as O-SII) and after the update of the list of institutions in November 2021, BBVA remains identified as O-SII. Following the designation in November 2020, the Bank of Spain imposed on BBVA the obligation to maintain Common Equity Tier 1 items as a buffer for O-SII during the financial year 2021 for an amount equal to 0,75% of the total amount of its risk exposure on a consolidated basis. Similarly, following the mandatory annual review in July 2021 of the designations of the so-called O-SIIs, the Bank of Spain continues to require BBVA to maintain a capital buffer of 0.75% in 2022.
Lastly, the Group's leverage ratio stood at 6.7% fully-loaded (6.8% phased-in)30 as of December 31, 2021. These figures include the effect of the temporary exclusion of certain positions with the central banks of the different geographical areas where the Group operates, foreseen in the “CRR-Quick fix”.
(26)Pursuant to the new applicable regulation, the MREL in RWAs and the subordination requirement in RWAs do not include the combined requirement of applicable capital buffers.
(27)In accordance with the resolution strategy MPE (“Multiple Point of Entry”) of the BBVA Group, established by the SRB, the resolution group is made up of Banco Bilbao Vizcaya Argentaria, S.A. and subsidiaries that belong to the same European resolution group. As of December 31, 2019, the total RWAs of the resolution group amounted to €204,218m and the total exposure considered for the purpose of calculating the leverage ratio amounted to €422,376m.
(28)Own resources and eligible liabilities to meet, both, MREL and the combined capital buffer requirement applicable.
(29)As of December 31, 2021, the MREL ratio in Leverage Ratio stands at 11.35% and the subordination ratios in terms of RWAs and in terms of exposure of the leverage ratio, stand at 24.65% and 9.87%, respectively, being preliminary data.
(30)The Group’s leverage ratio is provisional at the date of release of this report.
Ratings
During 2021, BBVA’s rating has continued to show its strength and all agencies have maintained their rating in the A category. Last December, S&P upgraded BBVA’s rating one notch to A from A-, considering that a sizable enough cushion of bail-inable instruments has been issued, and following a methodological update that recognizes the strength of the Multiple Point of Entry (MPE) resolution strategy. The outlook changed to negative from stable, now conditioned by the rating given by S&P to the Spanish sovereign (also A, with negative outlook). The following table shows the credit ratings and outlook given by the agencies:
RATINGS
| Rating agency | Long term (1) | Short term | Outlook |
|---|---|---|---|
| DBRS | A (high) | R-1 (middle) | Stable |
| Fitch | A— | F-2 | Stable |
| Moody’s | A3 | P-2 | Stable |
| Standard & Poor’s | A | A-1 | Negative |
- (1) Ratings assigned to long term senior preferred debt. Additionally, Moody’s and Fitch assign A2 and A- rating respectively, to BBVA’s long term deposits.
3.1.6 The BBVA share
The main stock market indexes showed a positive performance in 2021. In Europe, the Stoxx Europe 600 index increased by 22.2% compared to the end of December of the previous year, and in Spain the Ibex 35 increased by 7.9% in the same period, showing a worse relative performance. In the United States, the S&P 500 index also increased by 26.9%.
With regard to the banking sector indexes, their performance in 2021 was better than the general indexes in Europe. The Stoxx Europe 600 Banks index, which includes the banks in the United Kingdom, and the Euro Stoxx Banks, an index of Eurozone banks, increased by 34.0% and 36.2% respectively, meanwhile in The United States, the S&P Regional Banks sectoral index increased by 36.6% in the period.
For its part, the BBVA share price increased by 30.1% in the year, slightly below its sector index, closing December 2021 at €5.25.
BBVA SHARE EVOLUTION Compared with European indexes (Base index 100=31-12-20)
BBVA
EUROSTOCXX-50
EUROSTOCXX BANKS
The BBVA share and share performance ratios
THE BBVA SHARE AND SHARE PERFORMANCE RATIOS
| 31-12-21 | 31-12-20 | |
|---|---|---|
| Number of shareholders | 826,835 | 879,226 |
| Number of shares issued | 6,667,886,580 | 6,667,886,580 |
| Daily average number of shares traded | 22,901,565 | 34,180,978 |
| Daily average trading (millions of euros) | 118 | 108 |
| Maximum price (euros) | 6.29 | 5.34 |
| Minimum price (euros) | 3.74 | 2.13 |
| Closing price (euros) | 5.25 | 4.04 |
| Book value per share (euros) (1) | 6.86 | 6.70 |
| Tangible book value per share (euros) (1) | 6.52 | 6.05 |
| Market capitalization (millions of euros) | 35,006 | 26,905 |
| Yield (dividend/price; %) (2) | 2.6 | 4.0 |
- (1) Considering 112 million shares acquired within the share buyback program between November 22 and December 31 of 2021 and the estimated shares pending from buyback program as of December 31, 2021 of the first tranche approved by the Board of Directors in October 2021 (€1,500m), in process at the end of the year 2021.
- (2) Calculated by dividing shareholder remuneration over the last twelve months by the closing price of the period.
Regarding shareholder remuneration, after the lifting of the recommendations by the European Central Bank, on September 30, 2021, BBVA informed that the BBVA’s Board of Directors approved the payment in cash of €0.08 gross per share, as gross interim dividend against 2021 results, which was paid on October 12, 2021. This dividend is already considered within the capital ratios of the Group. In addition, on February 3, 2022 it was announced that a cash distribution in the amount of €0.23 gross per share was expected to be submitted to the relevant governing bodies for consideration. If approved, the total cash distributions would amount to €0.31 gross per share. Therefore, the total shareholder remuneration will be the result of the cash payments discussed and the share buyback programs.
On October 26, 2021, BBVA announced that it had received the required authorization from the European Central Bank for the buyback of up to 10% of its share capital for a maximum amount of 3,500 million euros, in one or several tranches and over a maximum period of 12 months (hereinafter, the Authorization).
Once the Authorization has been obtained, and in exercise of the authority delegated to it by the Annual Shareholders’ Meeting of BBVA held on March 16, 2018, the Board of Directors of BBVA, in its meeting held on October 28, 2021, has agreed to carry out a program scheme for the buyback of own shares in accordance with the provisions of Regulation (EU) No. 596/2014 of the European Parliament and of the Council of April 16, 2014 on market abuse and Commission Delegated Regulation (EU) 2016/1052, of March 8, 2016, which will be executed in several tranches, for a maximum amount of up to 3,500 million euros, aimed at reducing BBVA’s share capital (the Program Scheme), notwithstanding the possibility to suspend or early terminate the Program Scheme upon the occurrence of circumstances that make it advisable.
Likewise, the Board of Directors has agreed, within the scope of the Program Scheme, to carry out a first tranche of the share buyback program and the terms and conditions thereof. With regard to this first tranche, BBVA announced on November 19, 2021, that it would be implemented externally through a lead manager (J. P. Morgan AG) and would have a maximum amount of €1.500m, with a maximum number of shares to be acquired equal to 637,770,016 own shares, representing approximately 9.6% of BBVA’s current share capital, and that the opening of the first tranche would take place on November 22, 2021 and shall end not earlier than February 16, 2022, and not later than April 5, 2022, and, in any event, when the maximum monetary amount is reached or the maximum number of shares is acquired within that period31. With regard to the operations carried out in the context of the implementation of the first tranche, between November 22 and December 31, J. P. Morgan AG, as lead manager, acquired 112,254,236 BBVA shares. Between January 1 and February 3, 2022, it acquired 65.272.189 BBVA shares.
In addition, BBVA announced on February 3, 2022 that BBVA Board of Directors has agreed, within the framework program, to carry out a second program for the buyback of shares aimed at reducing BBVA’s share capital, for a maximum amount of 2,000 million Euros and a maximum number of shares to be acquired equal to the result of subtracting from 637,770,016 own shares (9.6% of BBVA’s share capital at this date) the number of own shares finally acquired in execution of the first tranche. The implementation of the second tranche, which will also be executed externally, through a lead-manager, will begin after the end of the implementation of the first tranche and shall end no later than October 15, 2022. BBVA will carry out a separate communication prior to the commencement of the execution of the Second Tranche with its specific terms and conditions.
Regarding the Group’s shareholder remuneration policy, on November 18, 2021, the Group announced that the Board of Directors of BBVA has agreed to modify the Group’s shareholder distribution policy in force at that time, establishing a new policy consisting in an annual distribution of between 40% and 50% of the consolidated ordinary profit of each year (excluding amounts and items of an extraordinary nature included in the consolidated profit and loss account), compared to the previous policy of distributing between 35% and 40%.
This policy will be implemented through the distribution of an interim dividend for the year (expected to be paid in October of each year) and a final dividend (to be paid once the year has ended and the allocation of the year-end profit has been approved, expected to take place in April of each year), with the possibility of combining cash distributions with share buybacks (the execution of the shares buyback program is considered to be an extraordinary shareholder distribution and is therefore not included in the scope of the policy), all subject to the relevant authorizations and approvals applicable at any given time.
As of December 31, 2021, the number of BBVA shares was 6,667.89 million, and the number of shareholders reached 826,835.00. By type of investor, 62.59% of the capital is held by institutional investors and the remaining 37.41% by retail shareholders.
SHAREHOLDER STRUCTURE (31-12-2021)
| Shareholders | Shares | |||
|---|---|---|---|---|
| Numbers of shares | Number | % | Number | % |
| Up to 500 | 341.510 | 41.3 | 63.972.992 | 1.0 |
| 501 to 5,000 | 381,597 | 46.2 | 671,795,023 | 10.1 |
| 5,001 to 10,000 | 55,785 | 6.7 | 392,338,799 | 5.9 |
| 10,001 to 50,000 | 43,159 | 5.2 | 824,841,257 | 12.4 |
| 50,001 to 100,000 | 3,092 | 0.4 | 210,665,277 | 3.2 |
| 100,001 to 500,000 | 1,410 | 0.2 | 256,532,572 | 3.8 |
| More than 500,001 | 282 | 0.0 | 4,247,740,660 | 63.7 |
| Total | 826,835 | 100.0 | 6,667,886.580 | 100.0 |
BBVA’s shares are included in the main stock market indexes, among them the Euro Stoxx 50, to which BBVA returned on September 20, only one year after its exit, due to the good performance of the share. This milestone -exit and re-enter the following year- has not been achieved by any company at least in the last decade. In addition to these indexes, BBVA is part of the main sustainability indexes, such as the Dow Jones Sustainability Index (DJSI), the FTSE4Good and the MSCI ESG indexes. For more information on this subject, please refer to the “Sustainability indexes” section of this report.
At the closing of December 2021, the weighting of BBVA shares in the Ibex 35, Euro Stoxx 50 and the Stoxx Europe 600 index, were 7.33%, 1.08% and 0.32%, respectively. They are also included in several sector indexes, including Stoxx Europe 600 Banks, which includes the United Kingdom, with a weighting of 4.45% and the Euro Stoxx Banks index for the eurozone with a weighting of 7.48%.
(31)However, BBVA reserves the right to temporarily suspend the First Tranche or to early terminate it in the event of any circumstance that so advises or requires.
3.2 Business areas
This section presents and analyzes the most relevant aspects of the Group's different business areas. Specifically, for each one of them, it shows a summary of the income statement and balance sheet, the business activity figures and the most significant ratios.
The structure of the business areas reported by the BBVA Group as of December 31, 2021, differs from the one presented at the end of 2020, mainly as a consequence of the removal of the United States as a business area, derived from the sale agreement reached with PNC and closed on June 1, 2021, once the pertinent mandatory authorizations were obtained. BBVA continues to have a presence in the United States, mainly through the wholesale business which the Group develops in the New York branch and its broker dealer BBVA Securities Inc.
The composition of BBVA Group business areas is summarized below:
- - Spain mainly includes the banking and insurance businesses that the Group carries out in this country, including the proportional share of the results of the new company created from the bancassurance agreement reached with Allianz at the end of 2020.
- - Mexico includes banking and insurance businesses in this country, as well as the activity that BBVA Mexico carries out through its branch in Houston.
- - Turkey reports the activity of the group Garanti BBVA that is mainly carried out in this country and, to a lesser extent, in Romania and the Netherlands.
With regard to this business area, on November 18, 2021, BBVA Group submitted to the Capital Markets Board of Turkey the application for authorization of the voluntary takeover bid (hereinafter referred to as the Voluntary Takeover Bid) for the entire share capital of Garanti BBVA not already owned, once all relevant regulatory approvals have been obtained. Given the deadlines and the need to receive approval from all relevant regulatory bodies, BBVA estimates that the closing of the Voluntary Takeover Bid will take place in the first quarter of 2022.
- - South America mainly includes banking and insurance activity conducted in the region. The information for this business area includes BBVA Paraguay data for the results, activity, balances and relevant business indicators for 2020 and is not included in 2021 as the sale agreement was reached in January 2021.
- - Rest of Business mainly incorporates the wholesale activity carried out in Europe (excluding Spain) and in the United States, as well as the banking business developed through BBVA’s 5 branches in Asia.
The Corporate Center contains the centralized functions of the Group, including: the costs of the head offices with a corporate function; structural exchange rate positions management; portfolios whose management is not linked to customer relations, such as financial and industrial holdings; stakes in Funds & Investment Vehicles in tech companies including the venture capital fund Propel Venture Partners; certain tax assets and liabilities; funds due to commitments to employees; goodwill and other intangible assets as well as such portfolios and assets' funding. Additionally, the results obtained by BBVA USA and the rest of the companies included in the sale agreement to PNC until the closing of the transaction on June 1, 2021, are presented in a single line of the income statements called “Profit (loss) after taxes from discontinued operations”. Finally, the costs related to the BBVA S.A. restructuring process in Spain, being considered such process a strategic decision, are included in this aggregate and are recorded in the line "Net cost related to the restructuring process".
In addition to these geographical breakdowns, supplementary information is provided for the wholesale business carried out by BBVA, Corporate & Investment Banking (CIB), in the countries where it operates. This business is relevant to have a broader understanding of the Group's activity and results due to the important features of the type of customers served, products offered and risks assumed.
The information by business areas is based on units at the lowest level and/or companies that make up the Group, which are assigned to the different areas according to the main region or company group in which they carry out their activity. The figures corresponding to 2020 have been elaborated following the same criteria and the same structure of the areas previously explained, so that the year-on-year comparisons are homogeneous.
Regarding the shareholders' funds allocation, in the business areas, a capital allocation system based on the consumed regulatory capital is used.
Finally it should be noted that, as usual, in the case of the different business areas in America, Turkey, Rest of Business and CIB, apart from including the year-on-year variations applying current exchange rates, the ones at constant exchange rates are also given.
MAIN INCOME STATEMENT LINE ITEMS BY BUSINESS AREA (MILLIONS OF EUROS)
| Business areas | |||||||||
|---|---|---|---|---|---|---|---|---|---|
| BBVA Group | Spain | Mexico | Turkey | South America | Rest of businesses | ∑ Business areas | Corporate Center | ||
| 2021 | |||||||||
| Net interest income | 14,686 | 3,502 | 5,836 | 2,370 | 2,859 | 281 | 14,849 | (163) | |
| Gross income | 21,066 | 5,925 | 7,603 | 3,422 | 3,162 | 741 | 20,854 | 212 | |
| Operating income | 11,536 | 2,895 | 4,944 | 2,414 | 1,661 | 291 | 12,204 | (668) | |
| Profit (loss) before tax | 8,240 | 2,122 | 3,528 | 1,953 | 961 | 314 | 8,878 | (638) | |
| Net attributable profit (loss) excluding non-recurring impacts (1) | 5,069 | 1,581 | 2,568 | 740 | 491 | 254 | 5,633 | (564) | |
| 2020 | |||||||||
| Net interest income | 14,592 | 3,566 | 5,415 | 2,783 | 2,701 | 291 | 14,756 | (164) | |
| Gross income | 20,166 | 5,567 | 7,025 | 3,573 | 3,225 | 839 | 20,229 | (63) | |
| Operating income | 11,079 | 2,528 | 4,680 | 2,544 | 1,853 | 372 | 11,977 | (898) | |
| Profit (loss) before tax | 4,813 | 823 | 2,475 | 1,522 | 896 | 280 | 5,996 | (1,183) | |
| Net attributable profit (loss) excluding non-recurring impacts (1) | 2,729 | 652 | 1,761 | 563 | 446 | 222 | 3,644 | (915) | |
- (1) Non-recurring impacts include: (I) profit (loss) after tax from discontinued operations in 2021 and 2020 ; (II) the net costs related to the restructuring process in 2021; and (III) the net capital gain from the bancassurance operation with Allianz in 2020.
GROSS INCOME (1), OPERATING INCOME (1) AND NET ATTRIBUTABLE PROFIT (1) BREAKDOWN (PERCENTAGE. 2021)
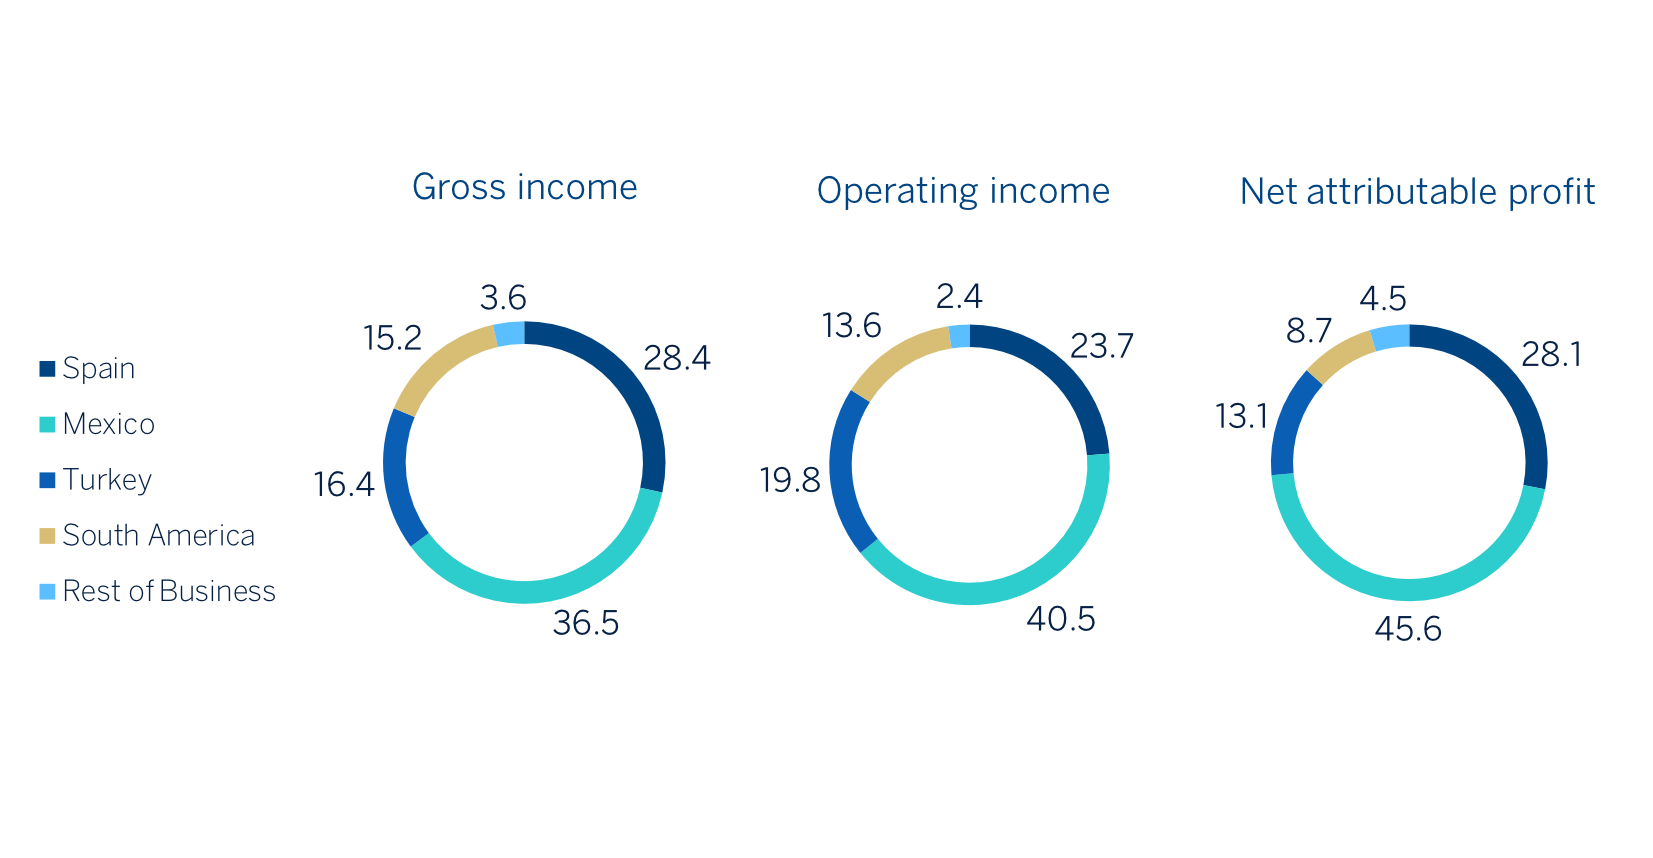
(1) Excludes the Corporate Center.
MAIN BALANCE-SHEET ITEMS AND RISK-WEIGHTED ASSETS BY BUSINESS AREA (MILLIONS OF EUROS)
| Business areas | ||||||||||
|---|---|---|---|---|---|---|---|---|---|---|
| BBVA Group | Spain | Mexico | Turkey | South America | Rest of businesses | ∑ Business areas | Corporate Center | Deletions | NCA&L (1) | |
| 31-12-21 | ||||||||||
| Loans and advances to customers | 318,939 | 171,097 | 55,809 | 31,414 | 34,608 | 26,949 | 319,877 | 1,006 | (1,945) | — |
| Deposits from customers | 349,761 | 206,663 | 64,003 | 38,341 | 36,340 | 6,266 | 351,613 | 175 | (2,027) | — |
| Off-balance sheet funds | 115,767 | 70,072 | 26,445 | 3,895 | 14,756 | 597 | 115,765 | 2 | — | — |
| Total assets/liabilities and equity | 662,885 | 413,477 | 118,106 | 56,245 | 56,124 | 40,314 | 684,266 | 30,835 | (52,216) | — |
| RWAs | 307,791 | 113,825 | 64,573 | 49,718 | 43,334 | 29,252 | 300,703 | 7,088 | — | — |
| 31-12-20 | ||||||||||
| Loans and advances to customers | 311,147 | 167,998 | 50,002 | 37,295 | 33,615 | 24,015 | 312,926 | 505 | (1,299) | (985) |
| Deposits from customers | 342,661 | 206,428 | 54,052 | 39,353 | 36,874 | 9,333 | 346,040 | 363 | (2,449) | (1,293) |
| Off-balance sheet funds | 102,947 | 62,707 | 22,524 | 3,425 | 13,722 | 569 | 102,947 | — | — | — |
| Total assets/liabilities and equity | 733,797 | 408,030 | 110,236 | 59,585 | 55,436 | 35,172 | 668,460 | 105,416 | (40,080) | — |
| RWAs | 353,273 | 104,388 | 60,825 | 53,021 | 39,804 | 24,331 | 282,370 | 70,903 | — | — |
- (1) Non-current assets and liabilities held for sale (NCA&L) from BBVA Paraguay as of 31-12-20.
BBVA Group, as of December 31, 2021, had 110,432 employees, 6,083 branches and 29,148 ATMs, a decrease of 10.3%, 18.2% and 6.0%, respectively, compared to the end of December 2020. The decrease was mainly due to the removal of BBVA USA and the rest of the companies in the United States following its sale on June 1, 2021, as well as the beginning of the employee departures and branch closures as a result of the restructuring plan of BBVA S.A. in Spain.
With regard to the number of employees in Mexico, there has been an increase, explained by the internalization of employees whose tasks are directly linked to the Bank's activity. This internalization, carried out in July 2021, is part of the labor reform in the country.
NUMBER OF EMPLOYEES
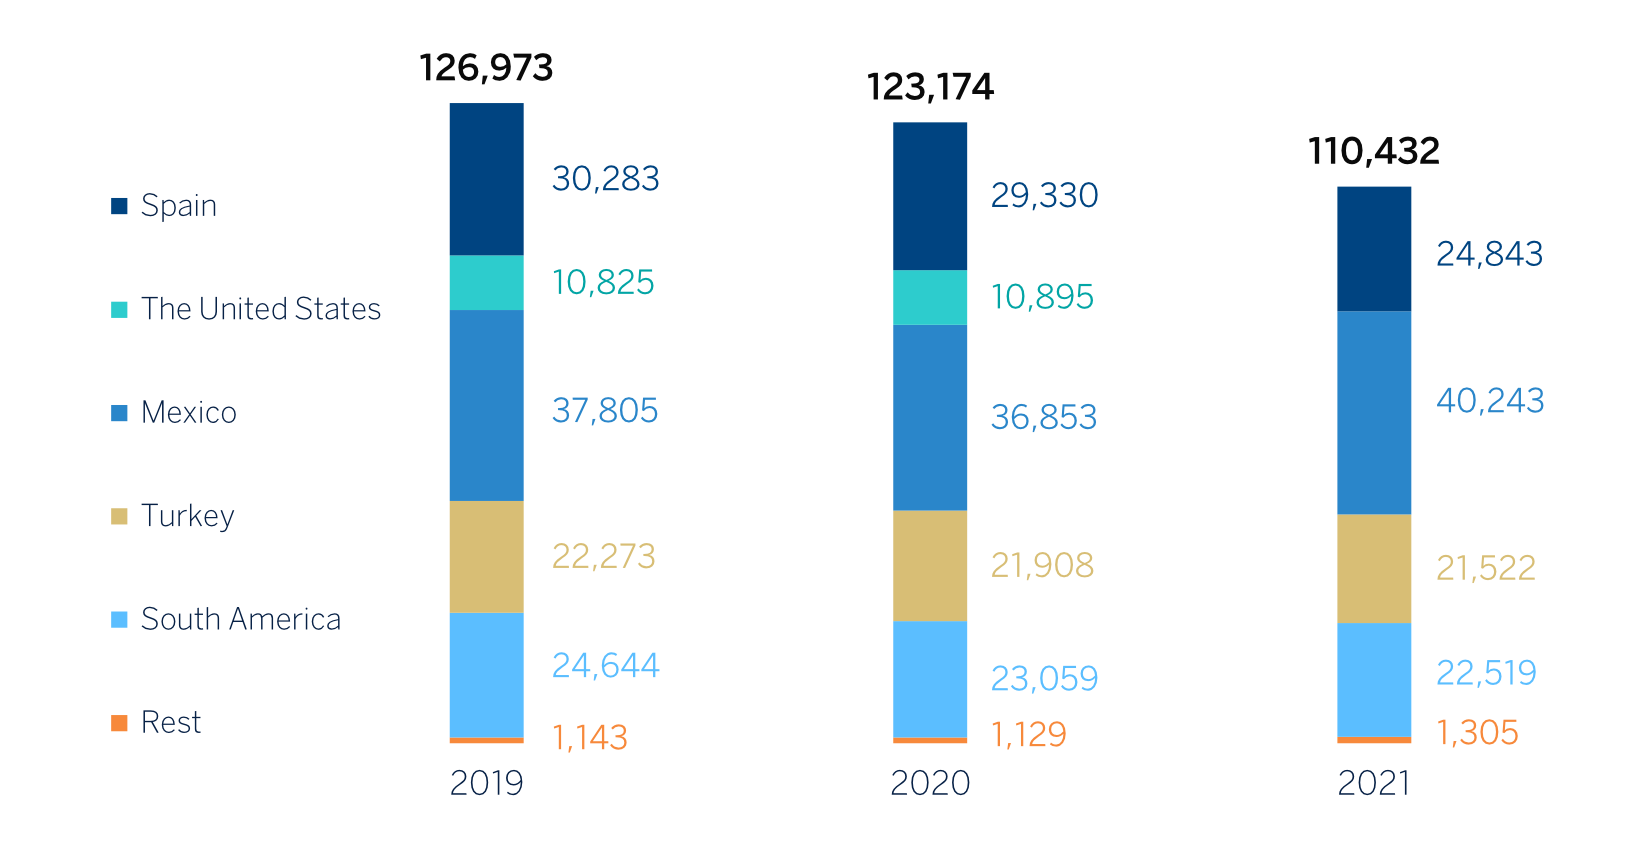
NUMBER OF BRANCHES

NUMBER OF ATMS
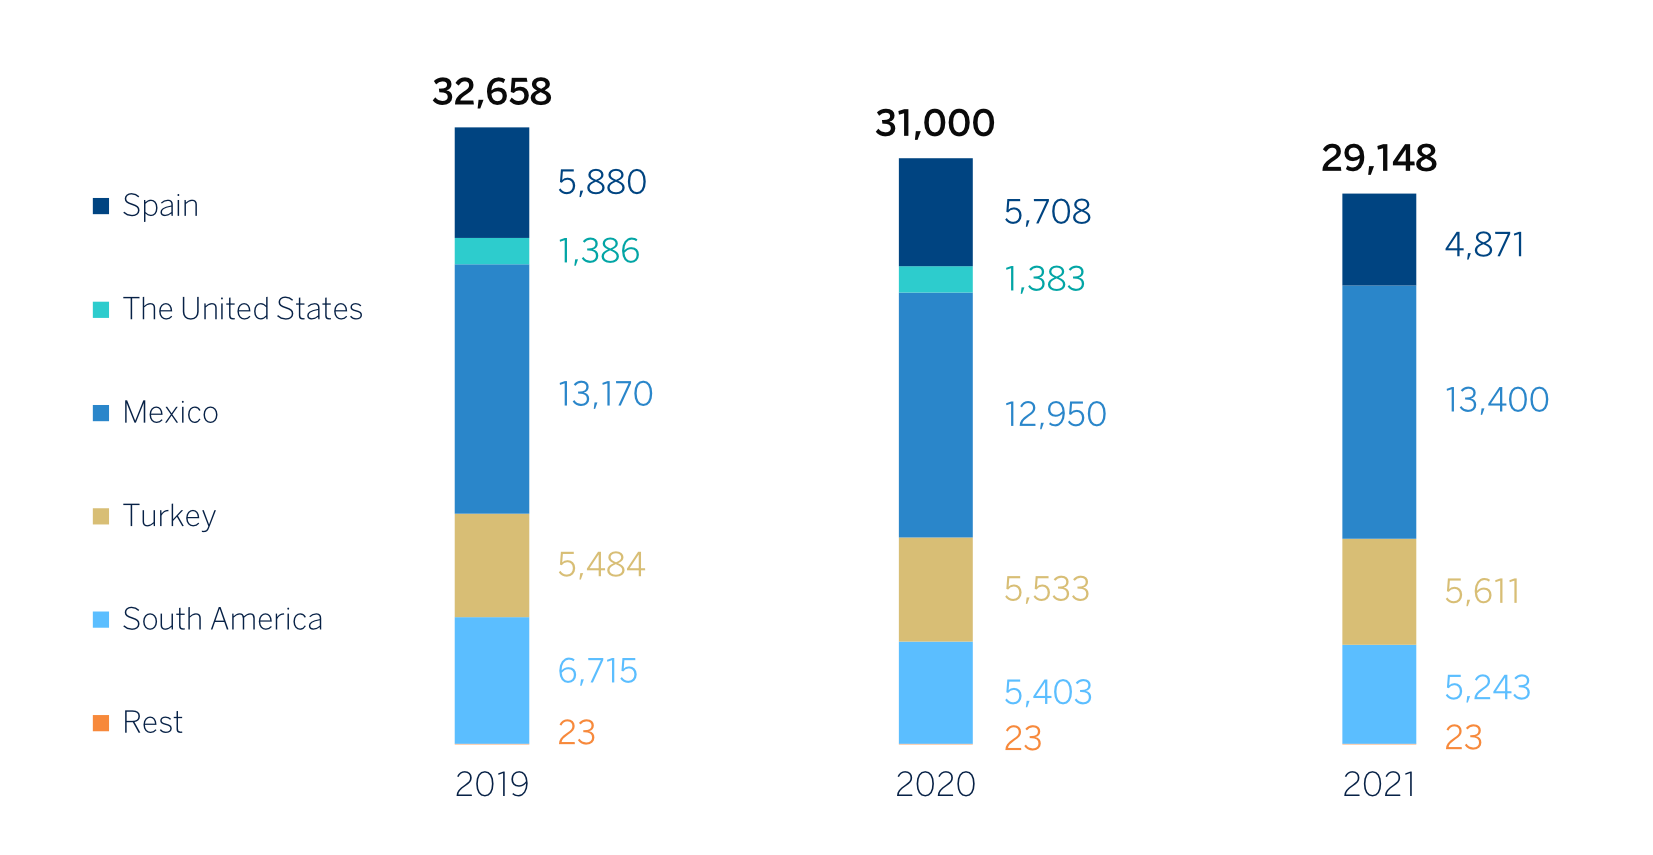
3.2.1 Spain
Highlights
- Growth in lending activity throughout the year
- Favorable performance of recurring income, driven by commissions
- Improvement in the efficiency ratio and outstanding gross income growth
- Decrease in impairment on financial assets, compared to a 2020 that was strongly affected by the pandemic, resulting in a lower cost of risk
BUSINESS ACTIVITY (1) (VARIATION COMPARED TO 31-12-20)
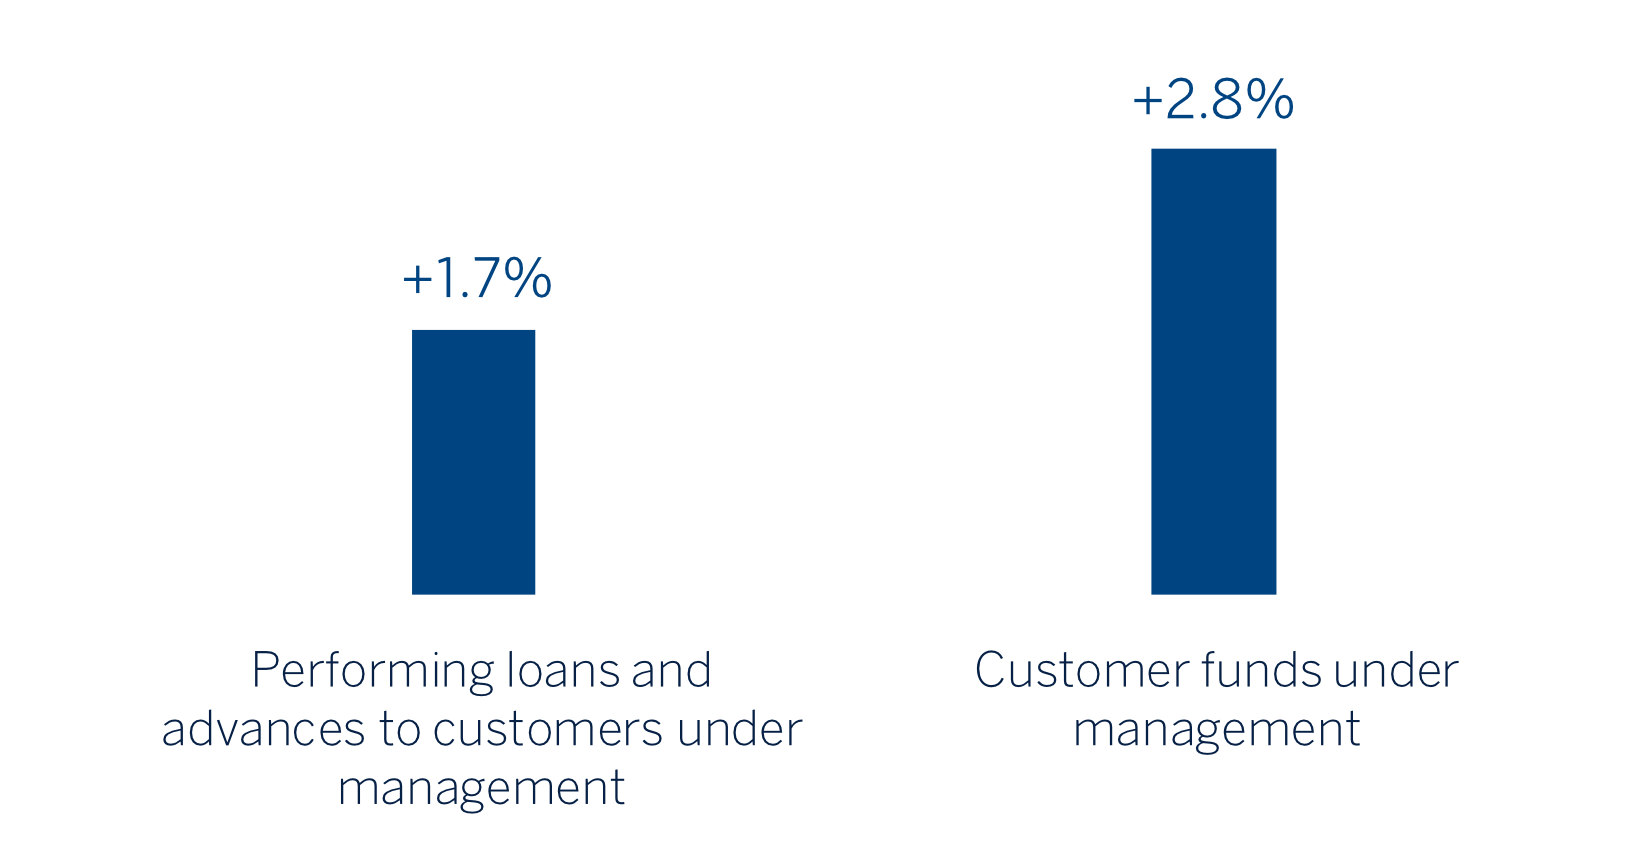
(1) Excluding repos.
NET INTEREST INCOME/ATAS (PERCENTAGE)

OPERATING INCOME (MILLIONS OF EUROS)
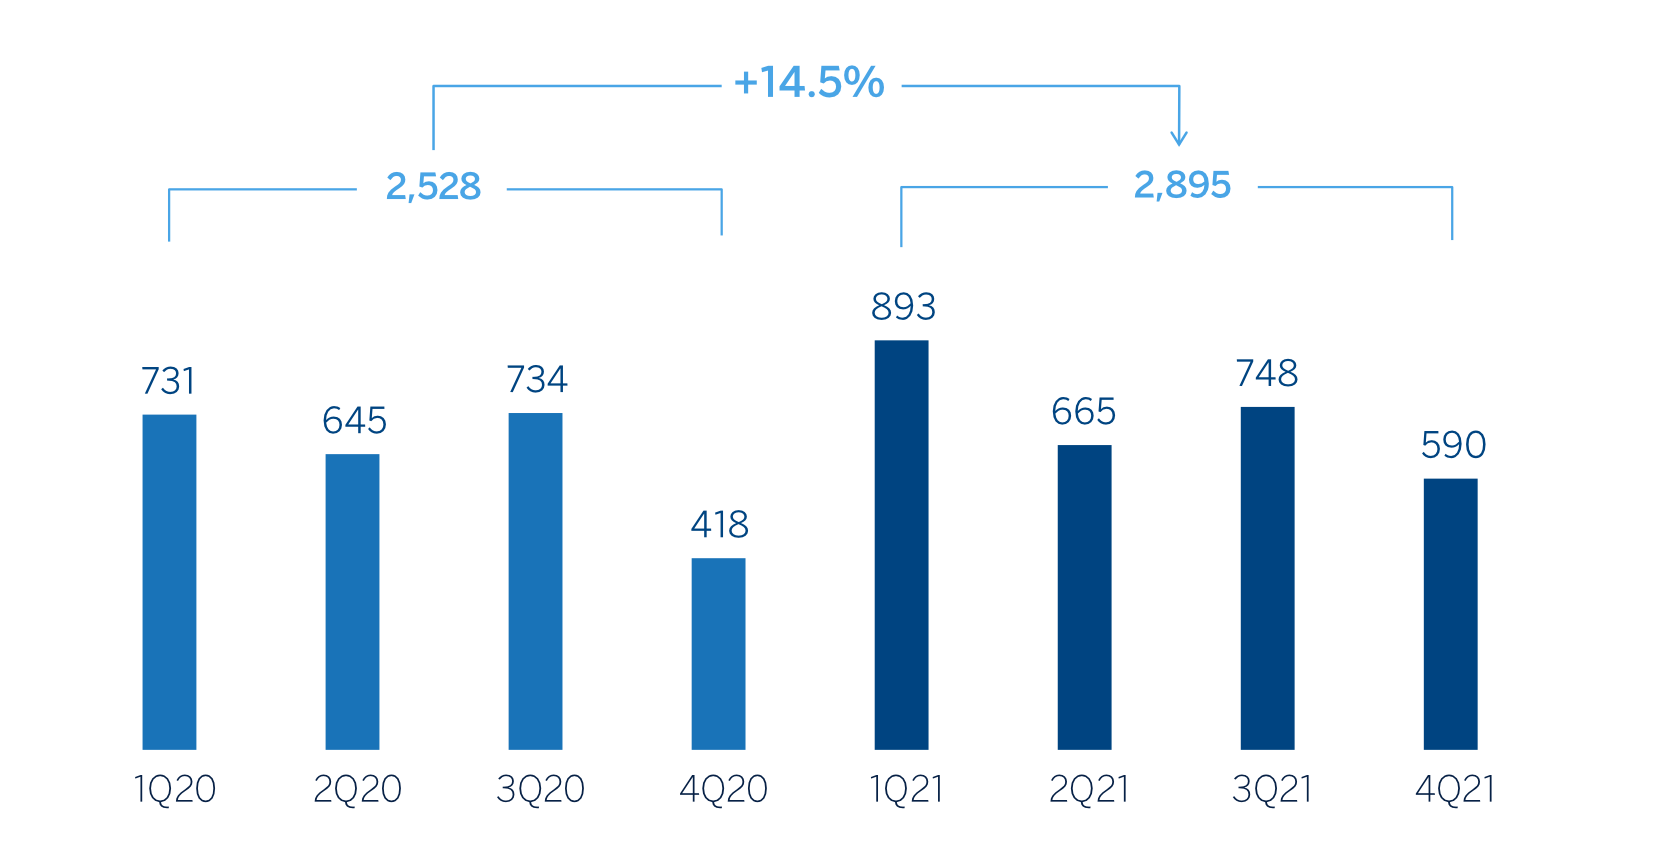
NET ATTRIBUTABLE PROFIT (LOSS) (MILLIONS OF EUROS)

FINANCIAL STATEMENTS AND RELEVANT BUSINESS INDICATORS (MILLIONS OF EUROS AND PERCENTAGE)
| Income statement | 2021 | ∆% | 2020 |
|---|---|---|---|
| Net interest income | 3,502 | (1.8) | 3,566 |
| Net fees and commissions | 2,189 | 21.5 | 1,802 |
| Net trading income | 343 | 97.4 | 174 |
| Other operating income and expenses | (109) | n.s. | 25 |
| Of which: Insurance activities(1) | 357 | (23.2) | 465 |
| Gross income | 5,925 | 6.4 | 5,567 |
| Operating expenses | (3,030) | (0.3) | (3,039) |
| Personnel expenses | (1,738) | — | (1,738) |
| Other administrative expenses | (861) | 2.3 | (841) |
| Depreciation | (431) | (6.3) | (460) |
| Operating income | 2,895 | 14.5 | 2,528 |
| Impairment on financial assets not measured at fair value through profit or loss | (503) | (56.9) | (1,167) |
| Provisions or reversal of provisions and other results | (270) | (49.8) | (538) |
| Profit (loss) before tax | 2,122 | 157.9 | 823 |
| Income tax | (538) | 221.7 | (167) |
| Profit (loss) for the year | 1,584 | 141.6 | 655 |
| Non-controlling interests | (2) | (32.5) | (3) |
| Net attributable profit (loss) | 1,581 | 142.6 | 652 |
- (1) Includes premiums received net of estimated technical insurance reserves.
| Balance sheets | 31-12-21 | ∆% | 31-12-20 |
|---|---|---|---|
| Cash, cash balances at central banks and other demand deposits | 26,386 | (31.2) | 38,356 |
| Financial assets designated at fair value | 145,544 | 7.3 | 135,590 |
| Of which: Loans and advances | 50,631 | 78.9 | 28,301 |
| Financial assets at amortized cost | 199,663 | 0.8 | 198,173 |
| Of which: Loans and advances to customers | 171,097 | 1.8 | 167,998 |
| Inter-area positions | 34,005 | 28.4 | 26,475 |
| Tangible assets | 2,534 | (12.7) | 2,902 |
| Other assets | 5,346 | (18.2) | 6,535 |
| Total assets/liabilities and equity | 413,477 | 1.3 | 408,030 |
| Financial liabilities held for trading and designated at fair value through profit or loss | 81,376 | 13.7 | 71,542 |
| Deposits from central banks and credit institutions | 54,759 | (6.8) | 58,783 |
| Deposits from customers | 206,663 | 0.1 | 206,428 |
| Debt certificates | 38,224 | (6.8) | 41,016 |
| Inter-area positions | — | — | — |
| Other liabilities | 18,453 | 8.8 | 16,955 |
| Regulatory capital allocated | 14,002 | 5.2 | 13,306 |
| Relevant business indicators | 31-12-21 | ∆% | 31-12-20 |
|---|---|---|---|
| Performing loans and advances to customers under management (1) | 168,251 | 1.7 | 165,511 |
| Non-performing loans | 8,450 | 1.3 | 8,340 |
| Customer deposits under management(1) | 205,908 | 0.0 | 205,809 |
| Off-balance sheet funds (2) | 70,072 | 11.7 | 62,707 |
| Risk-weighted assets | 113,825 | 9.0 | 104,388 |
| Efficiency ratio (%) | 51.1 | 54.6 | |
| NPL ratio (%) | 4.2 | 4.3 | |
| NPL coverage ratio (%) | 62 | 67 | |
| Cost of risk (%) | 0.30 | 0.67 |
- (1) Excluding repos.
- (2) Includes mutual funds and pension funds.
Macro and industry trends
The economic recovery continued in the fourth quarter of 2021, despite the negative impact on activity of the increased infections caused by new variants of the COVID-19. Activity indicators for the fourth quarter suggest a dynamism that could offset, at least partially, the impact on GDP in 2021 of the lower growth in the third quarter (2.6% quarterly) compared to the initial forecast by BBVA Research. According to estimates by BBVA Research, GDP would grow by around 5.1% in 2021, after a fall of 10.8% in 2020, and could increase by 5.5% in 2022 if European funds are used in a timely manner. Inflation continued to accelerate (in December 2021 it stood at 6.5%), driven mainly by energy prices, but will moderate in 2022, according to estimates by BBVA Research.
With regard to the banking system, with data as of the end of October 2021, the volume of lending to the private sector recorded a decline of 0.8% since December 2020, following growth of 2.6% in 2020. The NPL ratio continued to improve, reaching 4.36%, also at the end of October 2021 (4.51% at 2020 year-end). In addition, it should be noted that the system maintained comfortable levels of solvency and liquidity.
Activity
The most relevant aspects related to the area's activity during 2021 were:
- Lending activity (performing loans under management) was higher than at the end of 2020 (+1.7%) mainly due to growth in loans to SMEs (+10.2%), consumer loans (+9.1% including credit cards) and the increased activity of CIB in the fourth quarter of 2021 (+1.1 % year-on-year),
- With regard to asset quality, the non-performing loan ratio increased by 13 basis points in the quarter to stand at 4.2%, mainly due to the increase in non-performing loans, resulting from the reclassification due to the implementation of the aforementioned new definition of default. As a result of this increased balance of non-performing loans, the area's NPL coverage ratio is reduced to 62% as of December 31, 2021.
- Total customer funds increased (+2.8%) compared to 2020 year-end, supported by the favorable performance of off-balance sheet funds (+11.7%). For its part, the balance of customer deposits under management was stable during the year (0.0%), as the increase in deposits held by retail customers was offset by the decrease in the balances held by wholesale customers. By product, demand deposits grew by 7.4%, compensating for the drop in time deposits (-41.6%).
Results
Spain generated a net attributable profit of €1,581m during 2021, up 142.6% from the result posted in the previous year, mainly due to the increased provisions for impairment on financial assets as a result of the COVID-19 outbreak and the provisions made, in both cases in 2020, as well as the increased contribution from fees and commissions revenues and NTI in 2021.
The most notable aspects of the year-on-year changes in the area's income statement at the end of December 2021 were:
- Net interest income decreased by 1.8%, mainly due to the effect of the declining interest rates environment on the stock of loans and the lower contribution of the ALCO portfolios, which were partially offset by lower financing costs.
- Net fees and commissions continued to show a very positive performance (+21.5% year-on-year), mainly favored by a greater contribution from banking services, revenues associated with asset management and the contribution of insurance, in the latter case, by the bancassurance operation with Allianz.
- NTI showed at the end of December 2021 a significant year-on-year growth of 97.4%, mainly due to the results of the Global Markets unit.
- The other operating income and expenses line performed poorly compared to the previous year, due to the lower contribution from the insurance business in this line due to the bancassurance operation with Allianz and the higher contribution to the Single Resolution Fund.
- Operating expenses remained under control (-0.3% in year-on-year terms).
- As a result of gross income growth and contained expenses, the efficiency ratio stood at 51.1%, representing a significant improvement compared to 54.6% recorded at the end of December 2020.
- Impairment on financial assets recorded a significant reduction compared to the amount accumulated during 2020, mainly due to the negative impact of the worsening macroeconomic scenario caused by the pandemic following the outbreak of COVID-19 in March 2020, as well as the improvement of said scenario in 2021. For its part, the accumulated cost of risk remained on a downward trend and stood at 0.30% as of December 31, 2021.
- The provisions and other results line closed at €-270m, which was well below the €-538m recorded in the same period last year, which included provisions for potential claims.
3.2.2 Mexico
Highlights
- Growth in lending activity in the year driven by the continued acceleration in the retail portfolio segment since the second quarter of 2021
- Increase in demand deposits and therefore improvement in the funding mix
- Growth in recurring income and strength of operating income throughout the year
- Better performance of impairment on financial assets in 2021
BUSINESS ACTIVITY (1) (VARIATION AT CONSTANT
EXCHANGE RATE COMPARED TO 31-12-20)

(1) Excluding repos.
NET INTEREST INCOME/ATAS
(PERCENTAGE AT CONSTANT EXCHANGE RATE)

OPERATING INCOME (MILLIONS OF EUROS AT
CONSTANT EXCHANGE RATE)

(1) At current exchange rate: +5.6%.
NET ATTRIBUTABLE PROFIT (LOSS) (MILLIONS OF
EUROS AT CONSTANT EXCHANGE RATE)

(1) At current exchange rate: +45.8%.
FINANCIAL STATEMENTS AND RELEVANT BUSINESS INDICATORS (MILLIONS OF EUROS AND PERCENTAGE)
| Income statement | 2021 | ∆% | ∆%(1) | 2020 |
|---|---|---|---|---|
| Net interest income | 5,836 | 7.8 | 5.4 | 5,415 |
| Net fees and commissions | 1,211 | 14.1 | 11.6 | 1,061 |
| Net trading income | 366 | (13.3) | (15.3) | 423 |
| Other operating income and expenses | 190 | 50.3 | 46.9 | 126 |
| Gross income | 7,603 | 8.2 | 5.8 | 7,025 |
| Operating expenses | (2,659) | 13.4 | 10.9 | (2,344) |
| Personnel expenses | (1,199) | 22.9 | 20.2 | (976) |
| Other administrative expenses | (1,134) | 7.3 | 4.9 | (1,057) |
| Depreciation | (326) | 4.6 | 2.3 | (312) |
| Operating income | 4,944 | 5.6 | 3.3 | 4,680 |
| Impairment on financial assets not measured at fair value through profit or loss | (1,440) | (33.7) | (35.2) | (2,172) |
| Provisions or reversal of provisions and other results | 24 | n.s. | n.s. | (33) |
| Profit (loss) before tax | 3,528 | 42.5 | 39.4 | 2,475 |
| Income tax | (960) | 34.5 | 31.5 | (714) |
| Profit (loss) for the year | 2,568 | 45.8 | 42.6 | 1,761 |
| Non-controlling interests | (0) | 41.4 | 38.3 | (0) |
| Net attributable profit (loss) | 2,568 | 45.8 | 42.6 | 1,761 |
| Balance sheets | 31-12-21 | ∆% | ∆% (1) | 31-12-20 |
|---|---|---|---|---|
| Cash, cash balances at central banks and other demand deposits | 12,985 | 41.7 | 34.4 | 9,161 |
| Financial assets designated at fair value | 35,126 | (3.4) | (8.4) | 36,360 |
| Of which: Loans and advances | 835 | (67.7) | (69.4) | 2,589 |
| Financial assets at amortized cost | 65,311 | 9.2 | 3.5 | 59,819 |
| Of which: Loans and advances to customers | 55,809 | 11.6 | 5.8 | 50,002 |
| Tangible assets | 1,731 | 5.1 | (0.4) | 1,647 |
| Other assets | 2,953 | (9.1) | (13.9) | 3,249 |
| Total assets/liabilities and equity | 118,106 | 7.1 | 1.6 | 110,236 |
| Financial liabilities held for trading and designated at fair value through profit or loss | 19,843 | (16.6) | (21.0) | 23,801 |
| Deposits from central banks and credit institutions | 3,268 | (36.2) | (39.6) | 5,125 |
| Deposits from customers | 64,003 | 18.4 | 12.2 | 54,052 |
| Debt certificates | 7,984 | 4.5 | (0.9) | 7,640 |
| Other liabilities | 15,779 | 22.2 | 15.8 | 12,911 |
| Regulatory capital allocated | 7,229 | 7.8 | 2.2 | 6,707 |
| Relevant business indicators | 31-12-21 | ∆% | ∆% (1) | 31-12-20 |
|---|---|---|---|---|
| Performing loans and advances to customers under management (2) | 55,926 | 10.9 | 5.1 | 50,446 |
| Non-performing loans | 1,921 | 5.7 | 0.1 | 1,818 |
| Customer deposits under management (2) | 63,349 | 17.8 | 11.7 | 53,775 |
| Off-balance sheet funds (3) | 26,445 | 17.4 | 11.3 | 22,524 |
| Risk-weighted assets | 64,573 | 6.2 | 0.6 | 60,825 |
| Efficiency ratio (%) | 35.0 | 33.4 | ||
| NPL ratio (%) | 3.2 | 3.3 | ||
| NPL coverage ratio (%) | 106 | 122 | ||
| Cost of risk (%) | 2.67 | 4.02 |
(1) Figures at constant exchange rate.
(2) Excluding repos.
(3) Includes mutual funds and other off-balance sheet funds.
Macro and industry trends
Economic growth decelerated in the second half of 2021 after a strong expansion in the first half of the year. Given the recent slowdown, BBVA Research estimates that GDP growth was 5.3% in 2021, seven tenths lower than in the previous forecast, reflecting a partial recovery from the 8.4% drop in 2020. At the same time, in an environment of relatively weak domestic demand, strong inflationary pressures have led Banxico to raise monetary policy interest rates to 5.5% in December, from 4.0% in May. According to estimates by BBVA Research, interest rates will continue to increase, in an environment of relatively high inflation, and GDP growth will moderate significantly to around 2.2% in 2022.
With regard to the banking system, based on data at the end of November 2021, the system's lending volume increased since December 2020 (+4.1%), showing strong growth in the mortgage portfolio (+8,8% since the end of 2020), followed by consumer loans (+3.4%) and corporate loans (+2.1%), while demand and time deposits increased (+4.6 since December 2020). The NPL ratio in the system recorded slight improvement in 2021, reaching a NPL ratio of 2.15% at the end of November (+2.56% at the end of 2020) and capital indicators, by their part, remained comfortable.
Unless expressly stated otherwise, all the comments below on rates of change, for both activity and results, will be given at constant exchange rate. These rates, together with changes at current exchange rates, can be found in the attached tables of financial statements and relevant business indicators.
Activity
The most relevant aspects related to the area's activity during 2021 were:
- Lending activity (performing loans under management) grew by 5.1% compared to December 2020 thanks to the performance of the retail segment (+9.5%), which continued to show the dynamism that began in the second quarter of 2021. Within the retail segment, credit cards continued to stand out (+13.4%) followed by consumer and mortgage loans (+4.7% and +9.7%, respectively). Within this segment, SME financing was 15.4% higher compared to the end of December 2020, supported by the expansion of the product offering and the increase in the commercial effort with qualified personnel, which have resulted in a greater number of customers. For its part, the wholesale portfolio, which includes larger companies and the public sector, recorded a growth of (+3.6%). As a result of the above, BBVA Mexico's mix shows a shift towards the most profitable portfolio, with the retail portfolio representing 50.8% and the wholesale portfolio 49.2%.
- With regard to asset quality indicators, the NPL ratio recorded an increase of 63 basis points in the fourth quarter of 2021 and a decrease of 16 basis points compared to December 2020, explained by lower recurring NPL entries and a higher recognition of write-offs during the year, along with an increase in activity that has been partially offset in the last quarter due to the reclassification resulting from the implementation of the new definition of default. For its part, the NPL coverage ratio decreased to 106% during the year, due to the reclassification non-performing loans as a result of the new definition of default.
- Customer deposits under management showed an increase of 11.7% during 2021. This performance is explained by a growth of 15.9% in demand deposits, due to customers' preference for having liquid balances in an uncertain environment, compared to the decline observed in time deposits (-6.1%). The above has allowed BBVA Mexico to improve its deposits mix, with 84% of total deposits in lower-cost funds. Finally, mutual funds grew by 11.3% between January and December 2021, favored by an improved offering that includes funds linked to environmental, social and governance (ESG) factors.
Results
In Mexico, BBVA achieved a net attributable profit of €2,568m in 2021, representing a 42.6% increase compared to the same period in 2020, which was significantly affected by the COVID-19 pandemic.
The most relevant aspects of the year-on-year changes in the income statement at the end of December 2021 are summarized below:
- Net interest income closed 2021 with an increase of 5.4%, due to lower financing costs, the negative impact on this line due to the customer support measures against a backdrop of the pandemic in the second quarter of 2020 and, to a lesser extent, the aforementioned improvement in the portfolio mix in 2021. Also notable is the favorable trend towards recovery in the new retail loan origination, which has already been reflected in this line since the third quarter.
- Net fees and commissions increased by 11.6% thanks to higher levels of transactions, especially on credit cards, as well as those arising from investment banking operations and mutual fund management.
- NTI decreased by 15.3% year-on-year, mainly due to lower results from the Global Markets unit in 2021, as well as lower results from ALCO portfolios.
- The other operating income and expenses line recorded a year-on-year increase of 46.9%, mainly thanks to the results of the insurance unit in 2021 and also supported by the extraordinary revenue generated by the effects of initiatives aimed at transforming the production model, which have allowed operational efficiencies to be increased.
- Operating expenses increased (+10.9%) in an environment of relatively high inflation, mainly due to higher personnel expenses against a backdrop of increased activity. Also contributing to the year-on-year growth is the fact that certain expenses were not incurred in 2020 as a result of the pandemic, and thus increased general expenses in 2021, like technology expenses, among others.
- The impairment on financial assets decreased significantly compared to the same period last year (-35.2%), mainly due to additional provisions for COVID-19 recorded in 2020. As a result of all the above, the cumulative cost of risk as of December 2021 stood at 2.67%.
- The provisions and other results line showed a favorable comparison, driven by higher sales of foreclosed assets in 2021 and lower provisions related to contingent risks compared to those recorded during 2020.
3.2.3 Turkey
Highlights
- Activity driven by Turkish lira loans and deposits
- Year-on-year growth in recurring income and NTI
- Year-on-year decrease in the cost of risk
- Net attributable profit growth driven by higher revenues and lower impairment on financial assets
BUSINESS ACTIVITY (1) (VARIATION AT CONSTANT
EXCHANGE RATE COMPARED TO 31-12-20)

(1) Excluding repos.
NET INTEREST INCOME/ATAS
(PERCENTAGE AT CONSTANT EXCHANGE RATE)
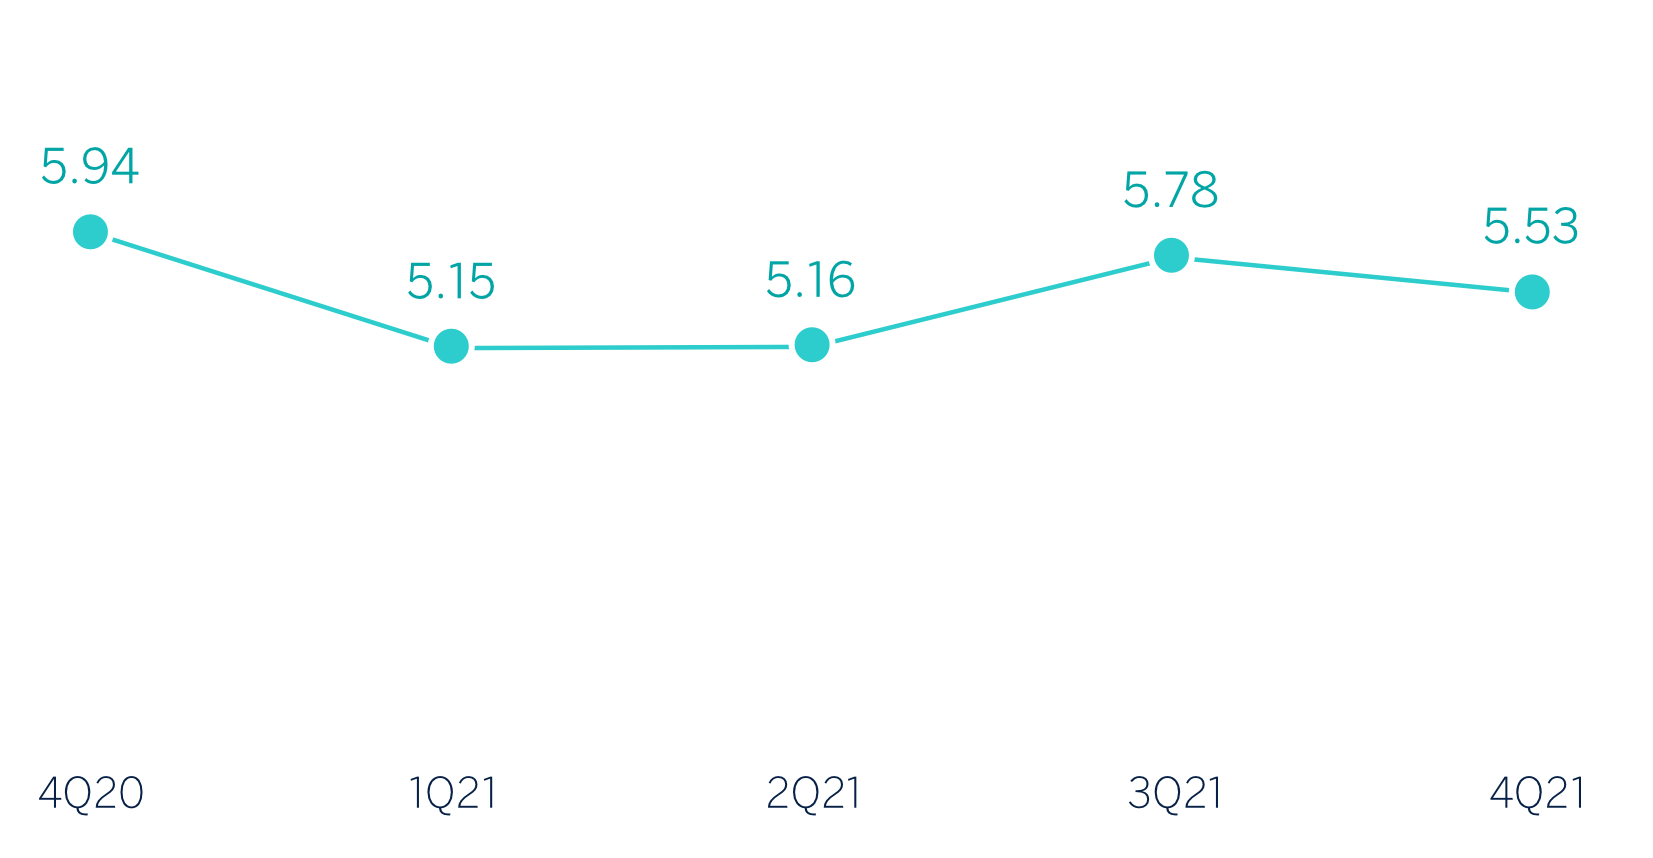
OPERATING INCOME (MILLIONS OF EUROS AT
CONSTANT EXCHANGE RATE)
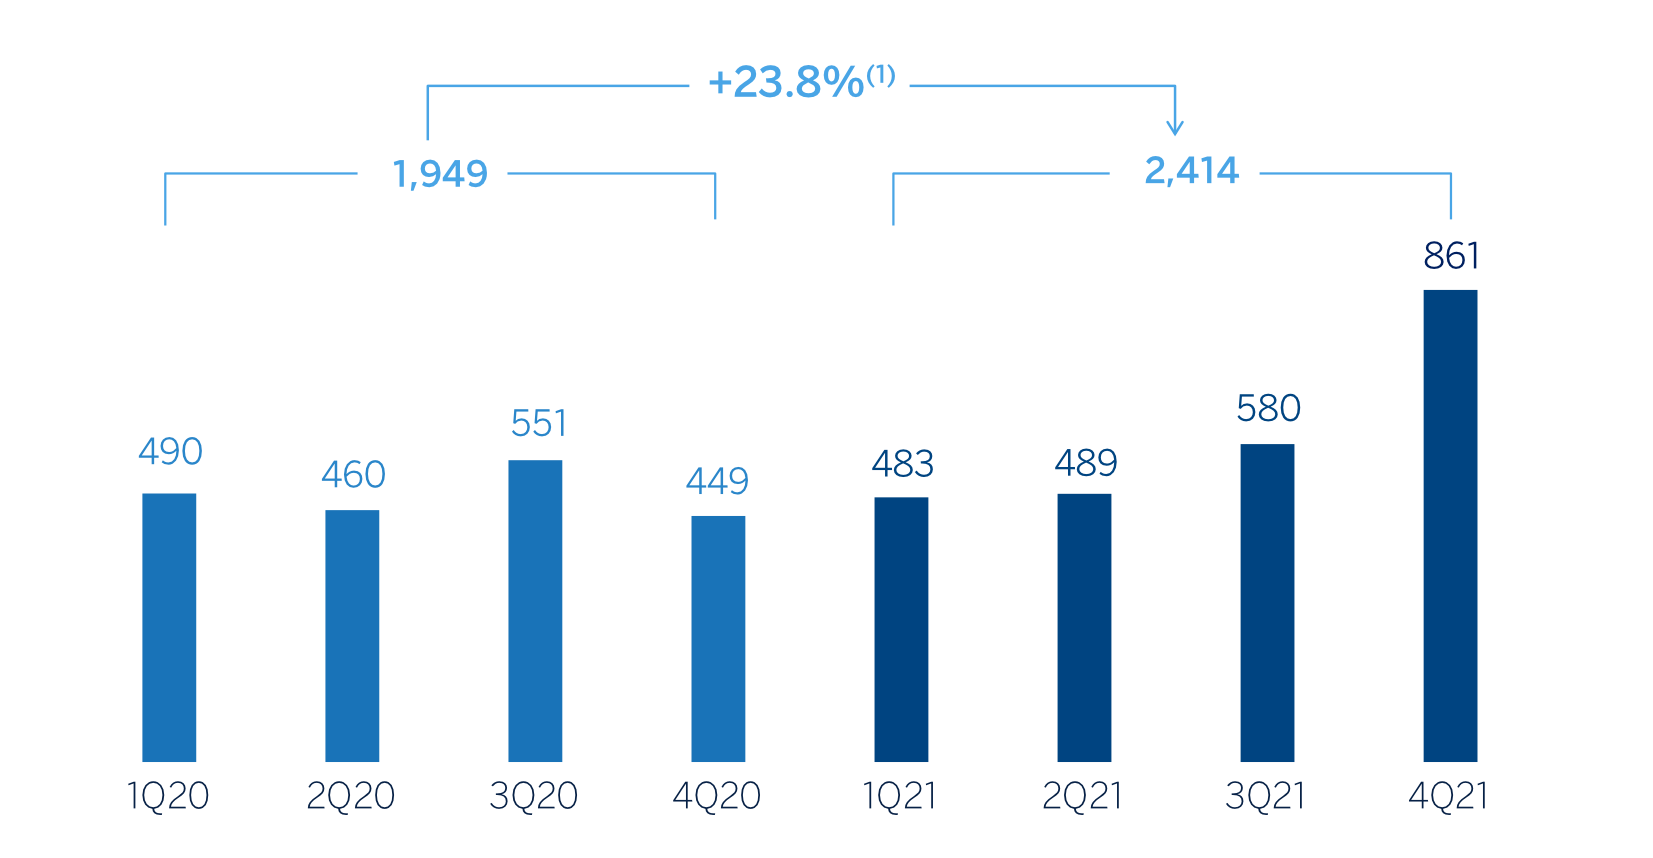
(1) At current exchange rate: -5.1 %.
NET ATTRIBUTABLE PROFIT (LOSS) (MILLIONS OF
EUROS AT CONSTANT EXCHANGE RATE)
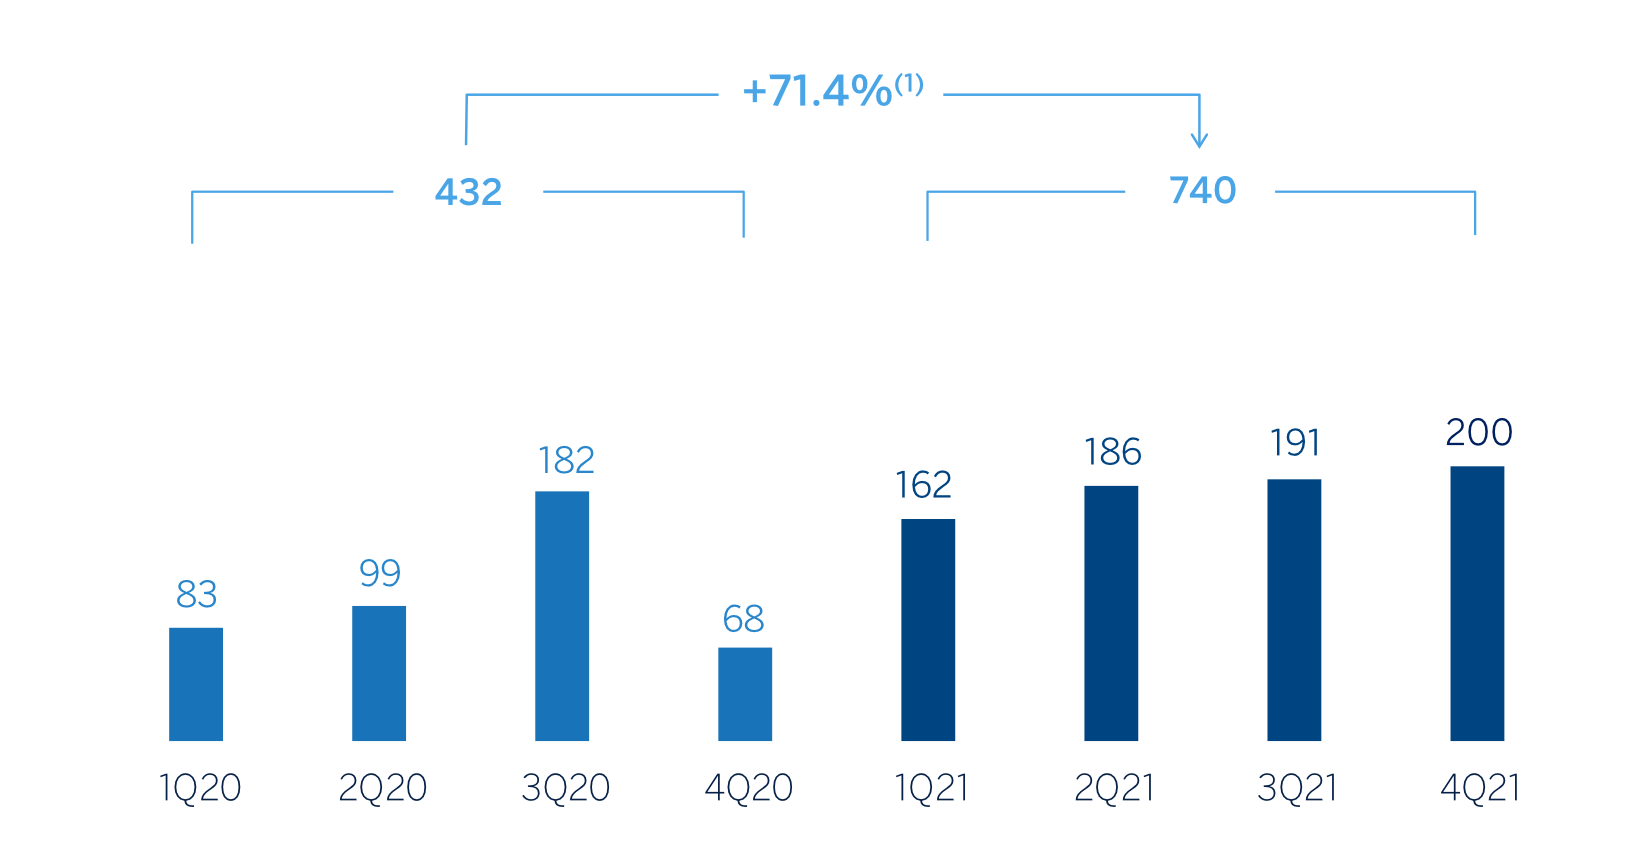
(1) At current exchange rate: +31.1%.
FINANCIAL STATEMENTS AND RELEVANT BUSINESS INDICATORS (MILLIONS OF EUROS AND PERCENTAGE)
| Income statement | 2021 | ∆% | ∆%(1) | 2020 |
|---|---|---|---|---|
| Net interest income | 2,370 | (14.8) | 11.2 | 2,783 |
| Net fees and commissions | 564 | 10.6 | 44.4 | 510 |
| Net trading income | 413 | 81.9 | 137.4 | 227 |
| Other operating income and expenses | 74 | 39.4 | 81.9 | 53 |
| Gross income | 3,422 | (4.2) | 25.0 | 3,573 |
| Operating expenses | (1,008) | (2.1) | 27.8 | (1,029) |
| Personnel expenses | (593) | 5.8 | 38.0 | (561) |
| Other administrative expenses | (297) | (7.0) | 21.4 | (319) |
| Depreciation | (118) | (20.8) | 3.3 | (150) |
| Operating income | 2,414 | (5.1) | 23.8 | 2,544 |
| Impairment on financial assets not measured at fair value through profit or loss | (494) | (44.8) | (27.9) | (895) |
| Provisions or reversal of provisions and other results | 33 | n.s. | n.s. | (127) |
| Profit (loss) before tax | 1,953 | 28.3 | 67.4 | 1,522 |
| Income tax | (455) | 19.9 | 56.5 | (380) |
| Profit (loss) for the year | 1,498 | 31.1 | 71.1 | 1,142 |
| Non-controlling interests | (758) | 30.9 | 70.8 | (579) |
| Net attributable profit (loss) | 740 | 31.3 | 71.4 | 563 |
| Balance sheets | 31-12-21 | ∆% | ∆% (1) | 31-12-21 |
|---|---|---|---|---|
| Cash, cash balances at central banks and other demand deposits | 7,764 | 41.7 | 136.9 | 5,477 |
| Financial assets designated at fair value | 5,289 | (0.8) | 65.8 | 5,332 |
| Of which: Loans and advances | 295 | (29.0) | 18.7 | 415 |
| Financial assets at amortized cost | 41,544 | (11.1) | 48.7 | 46,705 |
| Of which: Loans and advances to customers | 31,414 | (15.8) | 40.8 | 37,295 |
| Tangible assets | 623 | (30.8) | 15.7 | 901 |
| Other assets | 1,025 | (12.4) | 46.4 | 1,170 |
| Total assets/liabilities and equity | 56,245 | (5.6) | 57.8 | 59,585 |
| Financial liabilities held for trading and designated at fair value through profit or loss | 2,272 | (2.7) | 62.6 | 2.336 |
| Deposits from central banks and credit institutions | 4,087 | 20.9 | 102.1 | 3.381 |
| Deposits from customers | 38,341 | (2.6) | 62.9 | 39.353 |
| Debt certificates | 3.618 | (10.4) | 49.8 | 4.037 |
| Other liabilities | 2.166 | (49.7) | (16.0) | 4.308 |
| Regulatory capital allocated | 5,761 | (6.6) | 56.1 | 6.170 |
| Relevant business indicators | 31-12-21 | ∆% | ∆% (1) | 31-12-20 |
|---|---|---|---|---|
| Performing loans and advances to customers under management (2) | 30,610 | (16.5) | 39.7 | 36,638 |
| Non-performing loans | 2,995 | (5.9) | 57.3 | 3,183 |
| Customer deposits under management (2) | 38,335 | (2.6) | 62.9 | 39,346 |
| Off-balance sheet funds (3) | 3,895 | 13.7 | 90.1 | 3,425 |
| Risk-weighted assets | 49,718 | (6.2) | 56.7 | 53,021 |
| Efficiency ratio (%) | 29.5 | 28.8 | ||
| NPL ratio (%) | 7.1 | 6.6 | ||
| NPL coverage ratio (%) | 75 | 80 | ||
| Cost of risk (%) | 1.33 | 2.13 |
(1) Figures at constant exchange rate.
(2) Excluding repos.
(3) Includes mutual funds and pension funds.
Macro and industry trends
Activity indicators suggest that GDP has continued to grow strongly in the fourth quarter of 2021, supporting a revision of BBVA Research’s growth estimate for 2021 from 9.5% to around 10.8%. Strong demand, as well as the sharp depreciation of the Turkish lira following the interest rate cuts announced in recent months, contributed to a very significant increase in annual inflation to 36.1% in December 2021. According to BBVA Research's estimates, growth could moderate to around 3.5% in 2022. However, the economic environment is highly volatile given the combination of high inflation (on average it could be around 50% in 2022), very negative real rates environment, pressure on the Turkish lira and high external financing needs.
With regard to the banking system, based on data as of December 2021 the total volume of lending in the system increased by 37% since December 2020 in local currency (+20% in the Turkish lira portfolio and -5% in the foreign currency loan portfolio), while deposits grew by 54%, included in these growth rates are the effect of inflation and the depreciation of the Turkish lira. The deposit dollarization increased to 64.5% (55.3% the previous year and 55.1% as of September 2021), mainly due to the depreciation of the Turkish lira. The system's NPL ratio stood at 3.16% at the end of 2021 (4.05% at the end of 2020 and 3.59% as of September 2021).
Unless expressly stated otherwise, all comments below on rates of changes for both activity and income, will be presented at constant exchange rates. These rates, together with changes at current exchange rates, can be observed in the attached tables of the financial statements and relevant business indicators.
Activity
The most relevant aspects related to the area’s activity during 2021 were:
- Lending activity (performing loans under management) increased by 39.7% between January and December 2021, driven by the growth in Turkish lira loans (+28.1%). This growth was supported by consumer loans, thanks to the strong origination in General Purpose Loans, and also by credit cards, mortgages and commercial loans. Foreign currency loans (in U.S. dollars) decreased in 2021 (-13.3%).
- In terms of asset quality, the NPL ratio increased by 57 basis points to 7.1% compared to the end of September 2021. In the quarter, there was positive performance in recoveries and repayments, as well as partial write-offs in the wholesale portfolio and retail portfolio sales; almost offsetting the higher NPL entries mainly due to the reclassification resulting from the implementation of the new definition of default. The NPL coverage ratio stood at 75% as of December 31, 2021, which represents a decrease of -311 basis points in the quarter, mainly due to the evolution of non-performing loans.
- Customer deposits under management (68% of total liabilities in the area as of December 31, 2021) remained as the main source of funding for the balance sheet and increased by 62.9%. Especially noteworthy is the positive performance of Turkish lira demand deposits (+41.8%), which represent 29% of total customer deposits in local currency, as well as time deposits (+18.7%). Foreign currency deposits (in U.S. dollars) increased by 5.1%. For its part, the evolution of off-balance sheet funds (+90.1%) also stood out.
Results
Turkey generated a net attributable profit of €740m in 2021, 71.4% higher than the previous year, which was impacted by a strong increase in the impairment on financial assets due to the COVID-19 pandemic and also supported by higher contribution from recurring income and NTI in 2021. Taking into account the effect of the depreciation of the Turkish lira over the period, the results generated by Turkey increased by 31.3%.
The most significant aspects of the year-on-year evolution in the area's income statement at the end of December 2021 were:
- Net interest income increased by 11.2%, mainly due to larger loan volumes and also due to a higher contribution from inflation-linked bonds. This was partly offset by the contraction of the customer spread during 2021 and by higher financing costs.
- Net fees and commissions recorded significant growth (+44.4%) mainly driven by the positive performance in payment systems, money transfer, brokerage and guarantees.
- NTI performed significantly well (+137.4%), mainly due to the earnings of the Global Markets unit, as well as gains from securities transactions.
- Other operating income and expenses increased by 81.9% in 2021, mainly due to the greater contribution of the subsidiaries of Garanti BBVA, most notably the leasing operations.
- Operating expenses increased by 27.8%, impacted by the higher average annual inflation rate (above 19%), the depreciation of the Turkish Lira and increased activity. On the other hand, there was a reduction in some discretionary expenses in 2020 due to COVID-19, affecting the year-on-year evolution. Nevertheless, the efficiency ratio remained low (29.5%).
- Impairment on financial assets decreased by 27.9% compared to those registered in 2020, mainly due to the negative impact of the deterioration in the macroeconomic scenario as a result of the outbreak of the COVID-19 pandemic in March 2020, as well as the improvement of said scenario in 2021. In the fourth quarter of 2021, there was an increase in the coverage of customers sensitive to exchange rate fluctuations and higher requirements for provisions were recorded after a recalibration of wholesale risk models, reflecting greater sensitivity to currency evolution. As a result, the cumulative cost of risk at the end of December 2021 has decreased to 1.33% from 2.13% a year earlier.
- The provisions and other results line closed December with a profit of €33m, compared to the loss of €-127m recorded in the same period of the previous year, mainly thanks to lower provisions for special funds and contingent liabilities and commitments and capital gains from the sale of real estate assets.
3.2.4 South America
Highlights
- Increase in lending activity in 2021, with growth in both retail and commercial segments
- Reduction in higher-cost customer funds
- Favorable year-on-year evolution of recurring income and higher adjustment for inflation in Argentina
- Reduction in the impairment on financial assets line as 2020 was affected by the outbreak of the pandemic
BUSINESS ACTIVITY (1) (VARIATION AT CONSTANT
EXCHANGE RATE COMPARED TO 31-12-20)
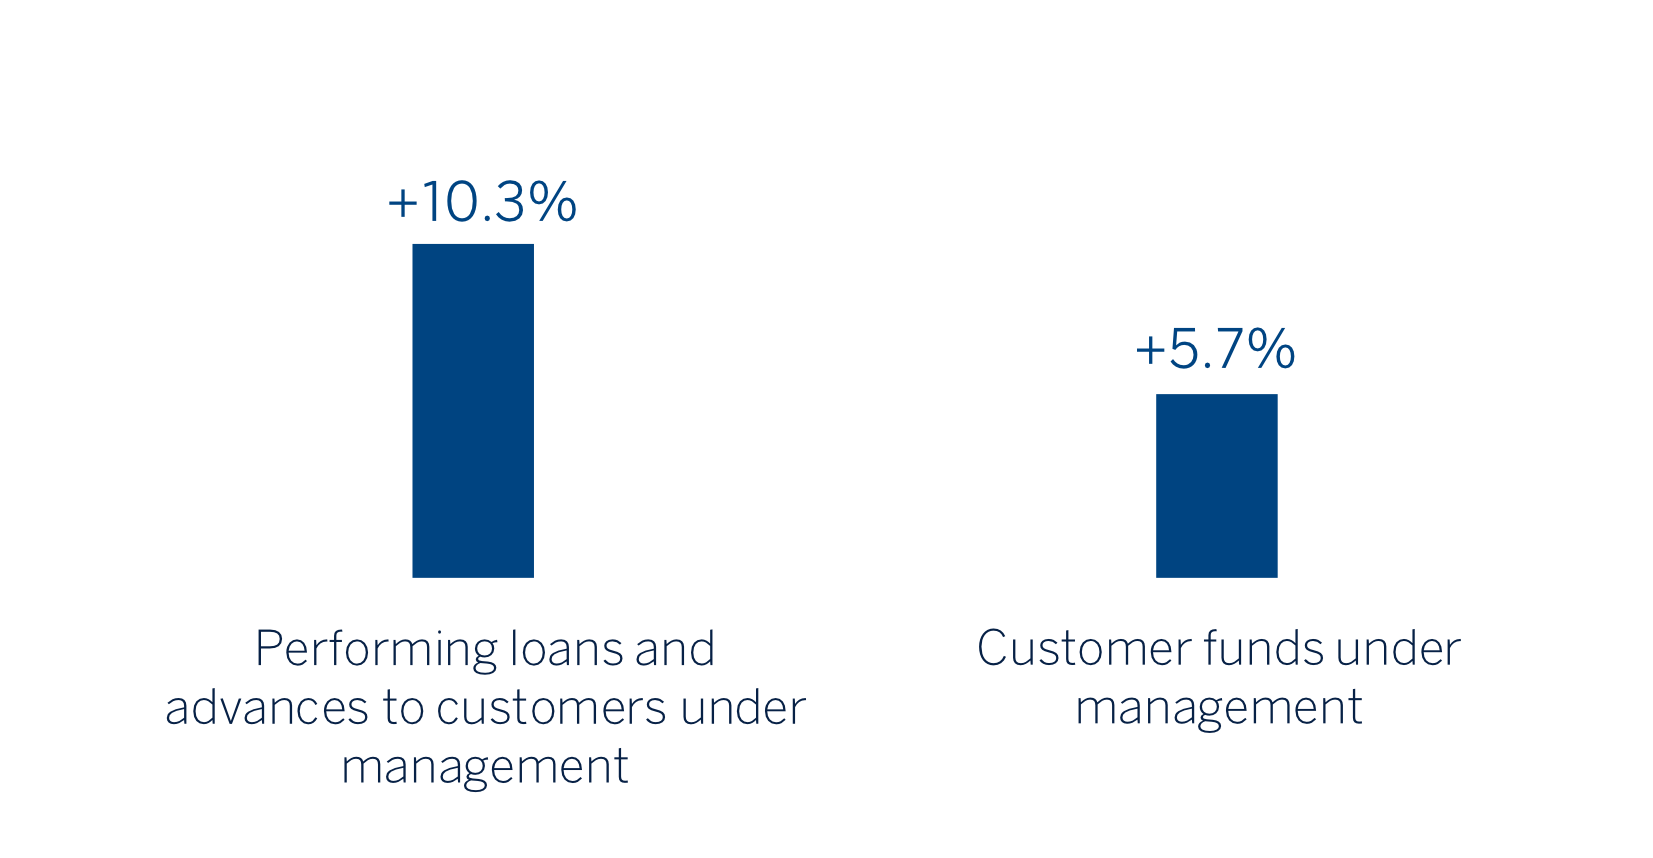
(1)Excluding repos. It excludes the balances of BBVA Paraguay as of 31-12-2020.
NET INTEREST INCOME/ATAS
(PERCENTAGE AT CONSTANT EXCHANGE RATES)
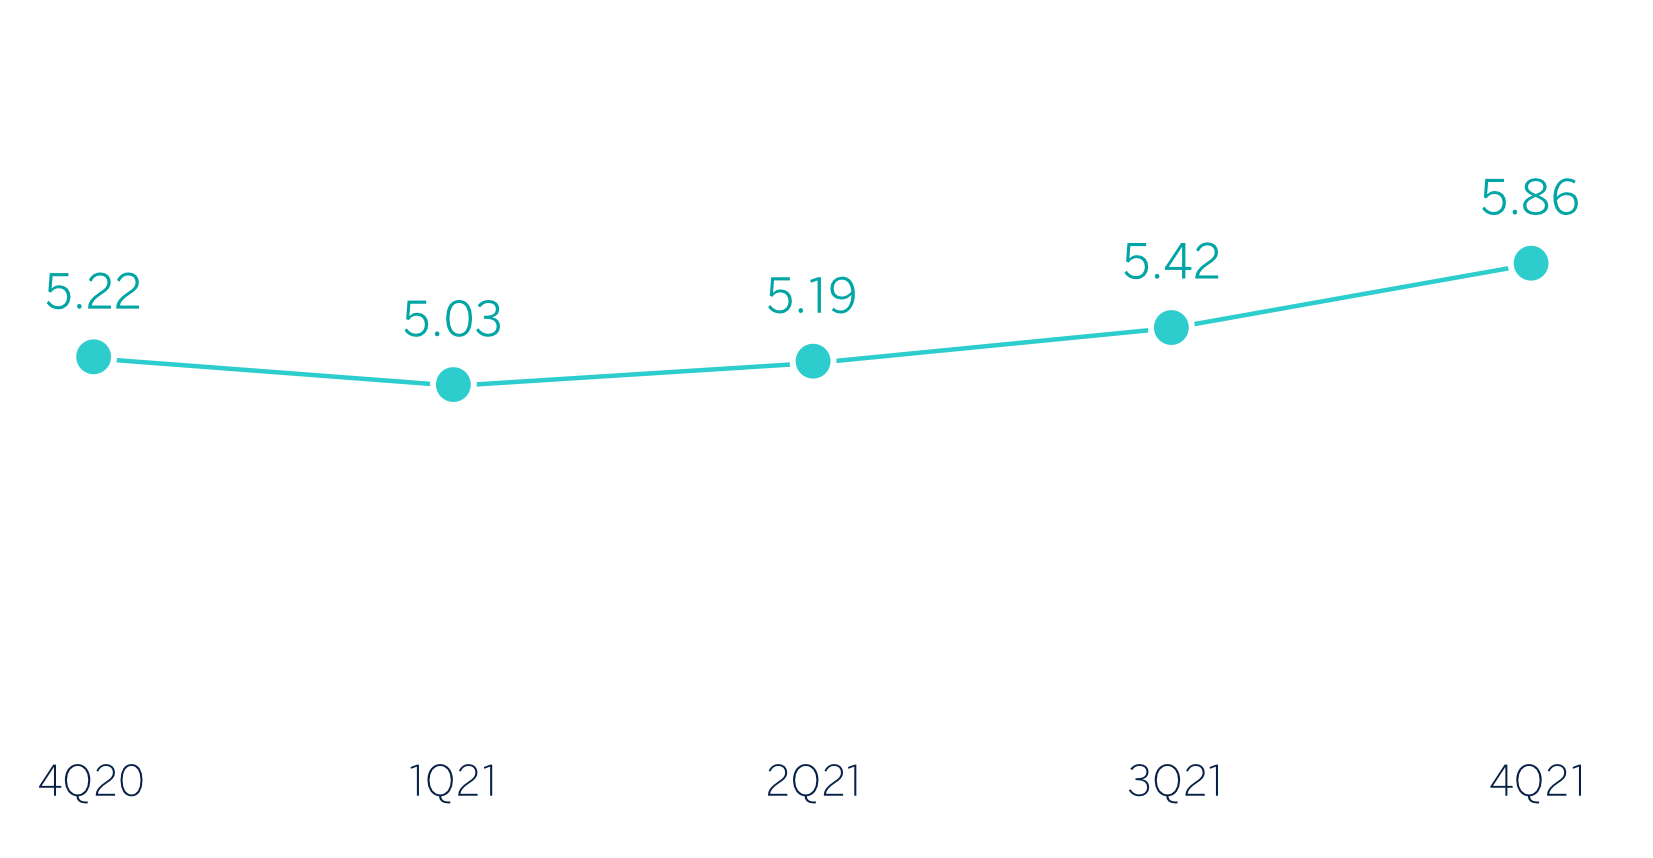
General note: Excluding BBVA Paraguay.
OPERATING INCOME
(MILLIONS OF EUROS AT CONSTANT EXCHANGE RATES)
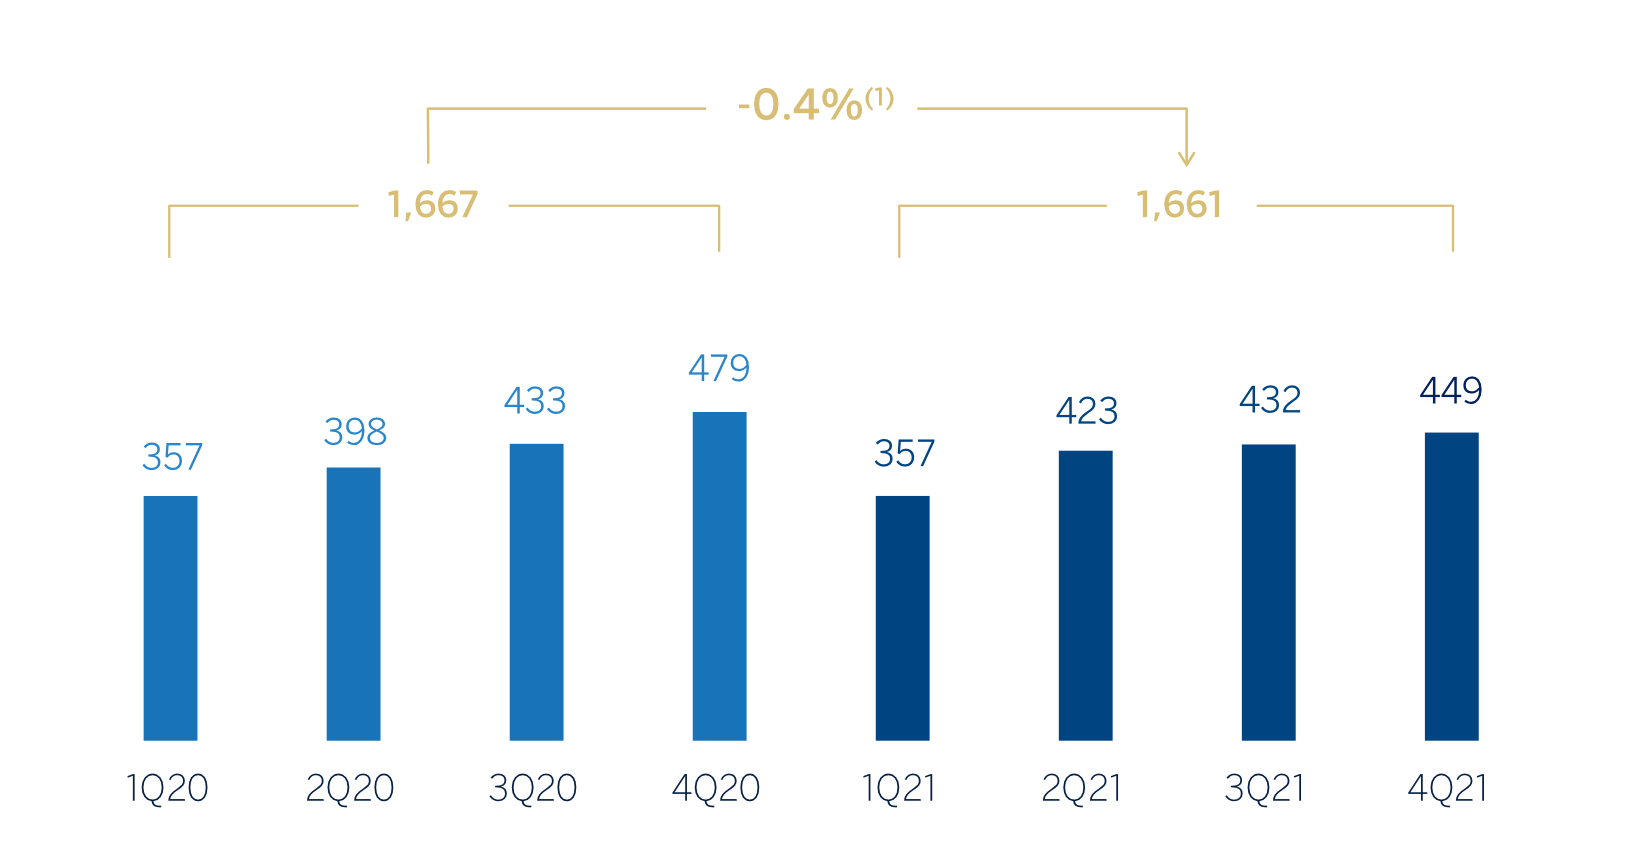
(1) At current exchange rates: -10.4%.
At constant exchange rates, excluding BBVA Paraguay: +2.0%.
Resultado atribuido
(MILLIONS OF EUROS AT CONSTANT EXCHANGE RATES)

(1) At current exchange rates: +10.1%.
At constant exchange rates, excluding BBVA Paraguay: +30.3%.
FINANCIAL STATEMENTS AND RELEVANT BUSINESS INDICATORS (MILLIONS OF EUROS AND PERCENTAGE)
| Income statement | 2021 | ∆% | ∆% (1) | ∆% (2) | 2020 |
|---|---|---|---|---|---|
| Net interest income | 2,859 | 5.8 | 15.5 | 18.1 | 2,701 |
| Net fees and commissions | 589 | 21.8 | 34.9 | 37.8 | 483 |
| Net trading income | 324 | (20.3) | (11.6) | (9.8) | 407 |
| Other operating income and expenses | (611) | 66.4 | 71.9 | 74.4 | (367) |
| Gross income | 3,162 | (2.0) | 8.1 | 10.6 | 3,225 |
| Operating expenses | (1,501) | 9.4 | 19.4 | 22.0 | (1,372) |
| Personnel expenses | (724) | 8.2 | 18.4 | 21.4 | (670) |
| Other administrative expenses | (632) | 15.0 | 25.3 | 27.6 | (549) |
| Depreciation | (145) | (5.7) | 2.4 | 4.8 | (154) |
| Operating income | 1,661 | (10.4) | (0.4) | 2.0 | 1,853 |
| Impairment on financial assets not measured at fair value through profit or loss | (622) | (28.0) | (21.3) | (20.0) | (864) |
| Provisions or reversal of provisions and other results | (77) | (17.0) | (7.7) | (6.8) | (93) |
| Profit (loss) before tax | 961 | 7.3 | 21.3 | 25.3 | 896 |
| Income tax | (287) | 3.5 | 16.0 | 17.3 | (277) |
| Profit (loss) for the year | 674 | 9.0 | 23.8 | 29.1 | 618 |
| Non-controlling interests | (184) | 6.3 | 25.9 | 25.9 | (173) |
| Net attributable profit (loss) | 491 | 10.1 | 23.0 | 30.3 | 446 |
| Balance sheets | 31-12-21 | ∆% | ∆% (1) | ∆% (2) | 31-12-20 |
|---|---|---|---|---|---|
| Cash, cash balances at central banks and other demand deposits | 8,549 | 20.0 | 24.1 | 33.1 | 7,127 |
| Financial assets designated at fair value | 7,175 | (2.1) | 2.5 | 2.5 | 7,329 |
| Of which: Loans and advances | 157 | 45.4 | 55.6 | 55.6 | 108 |
| Financial assets at amortized cost | 37,747 | (2.1) | 1.8 | 5.0 | 38,549 |
| Of which: Loans and advances to customers | 34,608 | 3.0 | 7.0 | 10.7 | 33,615 |
| Tangible assets | 895 | 10.7 | 13.7 | 14.9 | 808 |
| Other assets | 1,758 | 8.3 | 14.4 | 16.6 | 1,624 |
| Total assets/liabilities and equity | 56,124 | 1.2 | 5.3 | 8.7 | 55,436 |
| Financial liabilities held for trading and designated at fair value through profit or loss | 1,884 | 42.0 | 50.6 | 50.7 | 1,326 |
| Deposits from central banks and credit institutions | 5,501 | 2.3 | 5.1 | 5.4 | 5,378 |
| Deposits from customers | 36,340 | (1.4) | 2.3 | 6.5 | 36,874 |
| Debt certificates | 3,215 | (1.7) | 3.8 | 4.7 | 3,269 |
| Other liabilities | 4,207 | 10.3 | 16.1 | 17.9 | 3,813 |
| Regulatory capital allocated | 4,977 | 4.2 | 8.8 | 12.7 | 4,776 |
| Relevant business indicators | 31-12-21 | ∆% | ∆% (1) | ∆% (2) | 31-12-20 |
|---|---|---|---|---|---|
| Performing loans and advances to customers under management (3) | 34,583 | 2.6 | 6.6 | 10.3 | 33,719 |
| Non-performing loans | 1,813 | 1.8 | 5.6 | 8.1 | 1,780 |
| Customer deposits under management (4) | 36,364 | (1.4) | 2.3 | 6.5 | 36,886 |
| Off-balance sheet funds (5) | 14,756 | 7.5 | 3.7 | 3.7 | 13,722 |
| Risk-weighted assets | 43,334 | 8.9 | 13.6 | 17.6 | 39,804 |
| Efficiency ratio (%) | 47.5 | 42.6 | |||
| NPL ratio (%) | 4.5 | 4.4 | |||
| NPL coverage ratio (%) | 99 | 110 | |||
| Cost of risk (%) | 1.65 | 2.36 |
- (1) Figures at constant exchange rates.
- (2) At constant exchange rates excluding BBVA Paraguay.
- (3) Excluding repos.
- (4) Excluding repos and including specific marketable debt securities.
- (5) Includes mutual funds and pension funds.
SOUTH AMERICA. DATA PER COUNTRY (MILLIONS OF EUROS)
| Operating income | Net attributable profit/(loss) | |||||||
|---|---|---|---|---|---|---|---|---|
| Country | 2021 | ∆% | ∆% (1) | 2020 | 2021 | ∆% | ∆% (1) | 2020 |
| Argentina | 260 | (24.2) | n.s. | 343 | 63 | (29.4) | n.s. | 89 |
| Colombia | 569 | (3.8) | 1.0 | 591 | 228 | 38.5 | 45.4 | 165 |
| Peru | 685 | (4.6) | 9.6 | 718 | 122 | 11.4 | 28.0 | 110 |
| Other countries (2) | 147 | (26.8) | (24.9) | 200 | 77 | (5.8) | (2.4) | 82 |
| Total | 1,661 | (10.4) | (0.4) | 1,853 | 491 | 10.1 | 23.0 | 446 |
- (1) Figures at constant exchange rates.
- (2) Bolivia, Chile (Forum), Paraguay in 2020, Uruguay and Venezuela. Additionally, it includes eliminations and other charges.
SOUTH AMERICA. RELEVANT BUSINESS INDICATORS PER COUNTRY (MILLIONS OF EUROS)
| Argentina | Colombia | Peru | ||||
|---|---|---|---|---|---|---|
| 31-12-21 | 31-12-20 | 31-12-21 | 31-12-20 | 31-12-21 | 31-12-20 | |
| Performing loans and advances to customers under management (1) (2) | 3,333 | 2,495 | 12,334 | 10,913 | 15,552 | 14,914 |
| Non-performing loans and guarantees given (1) | 81 | 46 | 697 | 632 | 966 | 892 |
| Customer deposits under management (1) (3) | 6,083 | 4,101 | 12,814 | 11,330 | 13,946 | 15,648 |
| Off-balance sheet funds (1) (4) | 1,716 | 860 | 998 | 1,463 | 1,543 | 2,119 |
| Risk-weighted assets | 6,775 | 5,685 | 14,262 | 13,096 | 18,016 | 15,845 |
| Efficiency ratio (%) | 68.2 | 53.6 | 36.2 | 35.2 | 37.6 | 37.7 |
| NPL ratio (%) | 2.3 | 1.8 | 5.0 | 5.2 | 4.9 | 4.5 |
| NPL coverage ratio (%) | 146 | 241 | 103 | 113 | 89 | 101 |
| Cost of risk (%) | 2.20 | 3.24 | 1.85 | 2.64 | 1.59 | 2.13 |
- (1) Figures at constant exchange rates.
- (2) Excluding repos.
- (3) Excluding repos and including specific marketable debt securities.
- (4) Includes mutual funds.
Unless expressly stated otherwise, all the comments below on rates of change, for both activity and results, will be given at constant exchange rates. These rates, together with the changes at current exchange rates, can be found in the attached tables of the financial statements and relevant business indicators. The information for this business area includes BBVA Paraguay with regard to data on the results, activity, balance sheet and relevant business indicators for 2020, but does not include Paraguay for 2021, as the sale agreement materialized in January of that year. To facilitate an homogeneous comparison, the attached tables include a column at constant exchange rates that does not take BBVA Paraguay into account. All comments for this area also exclude BBVA Paraguay.
Activity and results
The most relevant aspects related to the area's activity during 2021 were:
- Lending activity (performing loans under management) recorded a variation of +10.3% over the period, with growth in all products and in all countries of the region, highlighting consumer and credit cards portfolios (+15.2%) and corporate portfolio (+9.3%).
- With regard to asset quality, the NPL ratio stood at 4.5%, which represents a decrease of 6 basis points compared to the end of September 2021, even taking into account the increase in non-performing loans due to the implementation of the new definition of default. For its part, the NPL coverage rate stood at 99, with a decrease of -943 basis points in the quarter due to this increase in non-performing loans.
- Customer funds under management increased (+5.7%) compared to the previous year's closing balances, with growth in demand deposits (+13.3%) and off-balance sheet funds (+3.7%) and a reduction in time deposits, in line with the strategy of some countries to reduce higher-cost liabilities in an environment whereby the Group's liquidity situation throughout the region is adequate.
With regard to the year-on year evolution of the results of South America, the area generated €491m in 2021, representing a year-on-year variation of +30.3%, mainly due to the improved performance of recurring income in 2021 (+21.0%), despite COVID-19 outbreaks and restrictions on mobility which have been in force during part of 2021 in some countries of the region. This comparison is also affected by the significant provision for impairment on financial assets made in 2020, also caused by COVID-19. In addition to all the aforementioned, it is worth mentioning two impacts originating in Argentina in the cumulative net attributable profit of the area: on the one hand, the impact derived from inflation in the country, which stood at €-164m at the close of December 2021, compared to €-104m accumulated at the close of December 2020; and on the other hand, a lower contribution due to the annual valuation on the remaining stake in Prisma Medios de Pago S.A. (hereinafter Prisma), with an impact on the NTI of the area.
More detailed information on the most representative countries of the business area is provided below:
Argentina
Macro and industry trends
Greater control of the pandemic during the second half of 2021 has allowed for a rapid recovery of economic activity. BBVA Research estimates that, after a contraction of 9.9% in 2020, GDP could stand at around 10.0% growth in 2021 and forecasts moderation to around 3.5% in 2022. Inflation remains very high, at around 50% at the end of December 2021, and some acceleration is expected during 2022, pending the negotiation of a new loan agreement with the International Monetary Fund.
The banking system continues to be influenced by the high inflation scenario. At the end of October 2021, lending grew by 28% compared to December 2020, while deposits grew by 39%. Meanwhile, during 2021, the NPL ratio increased to 4.9% in October (+1 percentage point compared to December 2021).
Activity and results
- Lending activity increased by 33.6% compared to the close of December 2020, a figure that is below inflation, with growth in the retail segment (+38.2%), highlighting credit cards (+38.4%), consumer loans (+41.1%) and corporate loans (+27.0%). The NPL ratio decreased in the last quarter of the year to 2.3%, due to increased activity and higher level of write-offs. For its part, the NPL coverage ratio was reduced to 146%, as a result of the reversal of provisions due to the annual parameters' recalibration.
- Balance sheet funds grew by 48.3% in 2021 and off-balance sheet funds (mutual funds) grew by 99.5% compared to December 2020.
- The cumulative net attributable profit at the end of December 2021 stood at €63m, below the figure achieved twelve months earlier, as a result of the good performance of the recurring income, offset by: lower NTI, impacted by a lower contribution from Prisma's annual valuation; a more negative adjustment for inflation; higher expenses and higher provisions compared to 2020.
Colombia
Macro and industry trends
Economic activity has shown greater dynamism than expected in the last months of 2021, so that growth in the year could reach 10% (one point higher than expected three months ago), a significant recovery from the 6.8% contraction of GDP in 2020. In addition, the high inflation has helped the Bank of the Republic raise interest rates to 3.0% in December, from 1.75% in August. BBVA Research also estimates that further interest rate hikes will help control inflation expectations and that growth will converge to about 4.0% by 2022.
Total lending in the banking system recovered (+7.5% at the end of October 2021, compared to December 2020), driven by credit to households, particularly the consumer portfolio (+8.8%). Corporate lending grew by 5.8%. Total deposits, meanwhile, grew by 3.9% at the end of October 2021 compared to December 2020. The system's NPL ratio at the end of October 2021 fell to 4.29% (70 basis points lower than in December 2020).
Activity and results
- Lending activity grew by 13.0% compared to 2020 year-end, with a good performance in both wholesale (+20.3%) and retail portfolios (+9.0%). In terms of asset quality, between September and December 2021 there was a -25 basis points drop in the NPL ratio to 5.0%, as a result of higher recoveries and good write-off management, coupled with the increase in activity mentioned above. For its part, the NPL coverage ratio stood at 103%, lower than the figure recorded in September 2021 (107%) due to a reduction in provisions.
- Customer deposits under management increased by 13.1%, compared to 2020 year-end, with growth in demand deposits, which compensated for the strategic reduction of time deposits, with higher costs for BBVA Colombia. For its part, off-balance sheet funds closed with a negative variation of 31.8% in 2021 due to the volatility of investments made by institutional customers.
- The net attributable profit for 2021 stood at €228m, significantly higher (+45.4% year-on-year) than the €165m reached in 2020, thanks to the favorable evolution of recurring income, as well as lower provisions for impairment on financial assets in 2021 compared to the previous year, when they increased notably due to the outbreak of the pandemic, which offset the negative impact on the other operating income and expenses line and the increased costs.
Peru
Macro and industry trends
The economic recovery process continued in the last months of 2021. Activity indicators have surprised positively compared to what was expected. Thus, BBVA Research estimates that after a fall of 11% in 2020, GDP would have increased by around 13.1% in 2021 (about one point above the previous forecast), despite inflationary pressures and monetary policy interest rate hikes to 2.5% in December. BBVA Research also projects growth to slightly exceed 2% in 2022, against a background of relatively high, albeit declining, inflation and further increases in interest rates.
Total lending in the banking system recovered (+5.6% at the end of September 2021, compared to December 2020) due to the stabilization of the consumer portfolio after decreasing in 2020 and the first months of 2021. The housing portfolio accelerated its growth (+8.9%) and the corporate portfolio continued its deceleration (-6.2%) in September 2021, compared to December 2020, after the strong growth of the previous year due to the Reactiva program. For its part, the system's NPL ratio was still contained at 3.11% on the same date.
Activity and results
- Lending activity was favored by improving economic conditions and closed December 2021 with a growth of 4.3% compared to the previous year, mainly due to the performance of mortgages (+4.1%), consumer loans (+21.9%) and corporate lending (+2.7%). The NPL ratio increased in the fourth quarter of 2021 to stand at 4.9% (+18 basis points compared to September 2021), due to the implementation of the new definition of default. For its part, the NPL coverage ratio decreased to 89%, due to the increase in non-performing loans.
- Customers funds under management decreased by 12.8% in 2021, mainly due to lower balances in time deposits, with the aim of reducing their cost, as well as the reduction in mutual funds, which also recorded a decrease compared to the close of December 2020 (-27.2%), due to the departure of some customers.
- In the year-on-year evolution of the income statement, recurring income grew by 11.1%, thanks to the favorable evolution of the net interest income and commissions, which grew by 8.2% and 21.8%, respectively, offsetting the increase in operating expenses. Regarding items below operating income on the income statement, the year-on-year reduction in provisions for impairment on financial assets has boosted the results (-16.1%), as a result of high provision charges in 2020 following the pandemic outbreak. As a result, the net attributable profit stood at €122m at the end of December 2021, 28.0% higher than the figure posted in 2020.
3.2.5 Rest of Business
Highlights
- Increase in lending due to evolution in the second half of the year and decrease in customer funds in 2021
- Good performance of NTI
- Favorable evolution of risk indicators
- Reversal in the impairment on financial assets line, which contrasts with provisions made in 2020
BUSINESS ACTIVITY (1) (VARIATION AT CONSTANT
EXCHANGE RATES COMPARED TO 31-12-20)

(1)Excluding repos.
NET INTEREST INCOME/ATAS
(PERCENTAGE AT CONSTANT EXCHANGE RATES)

OPERATING INCOME
(MILLIONS OF EUROS AT CONSTANT EXCHANGE RATES)
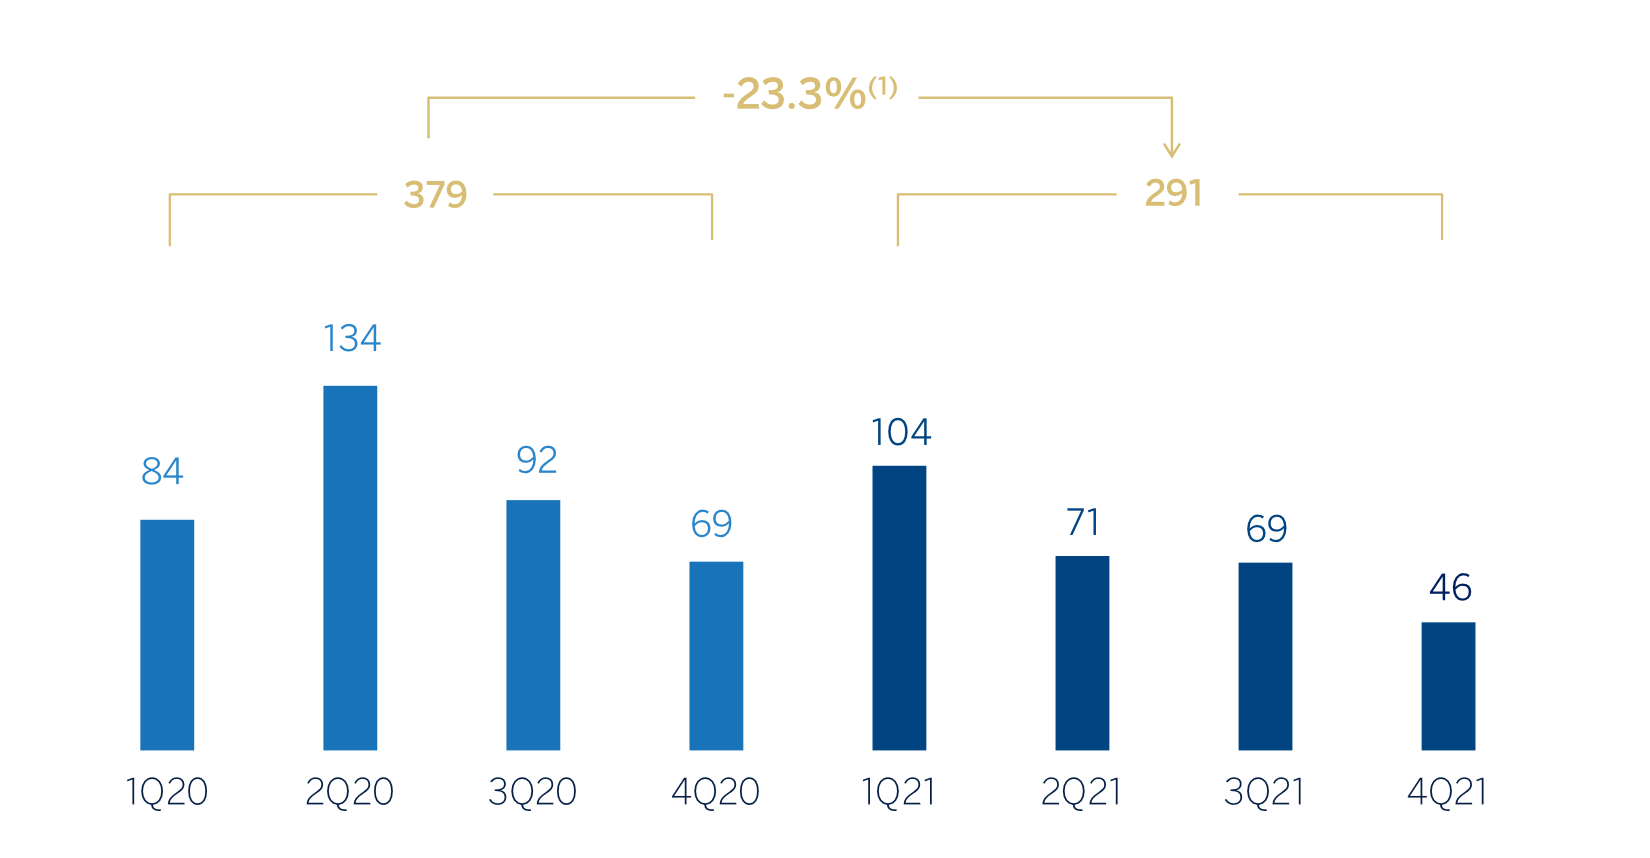
(1) At current exchange rates: -21.9%.
NET ATTRIBUTABLE PROFIT (LOSS)
(MILLIONS OF EUROS AT CONSTANT EXCHANGE RATES)
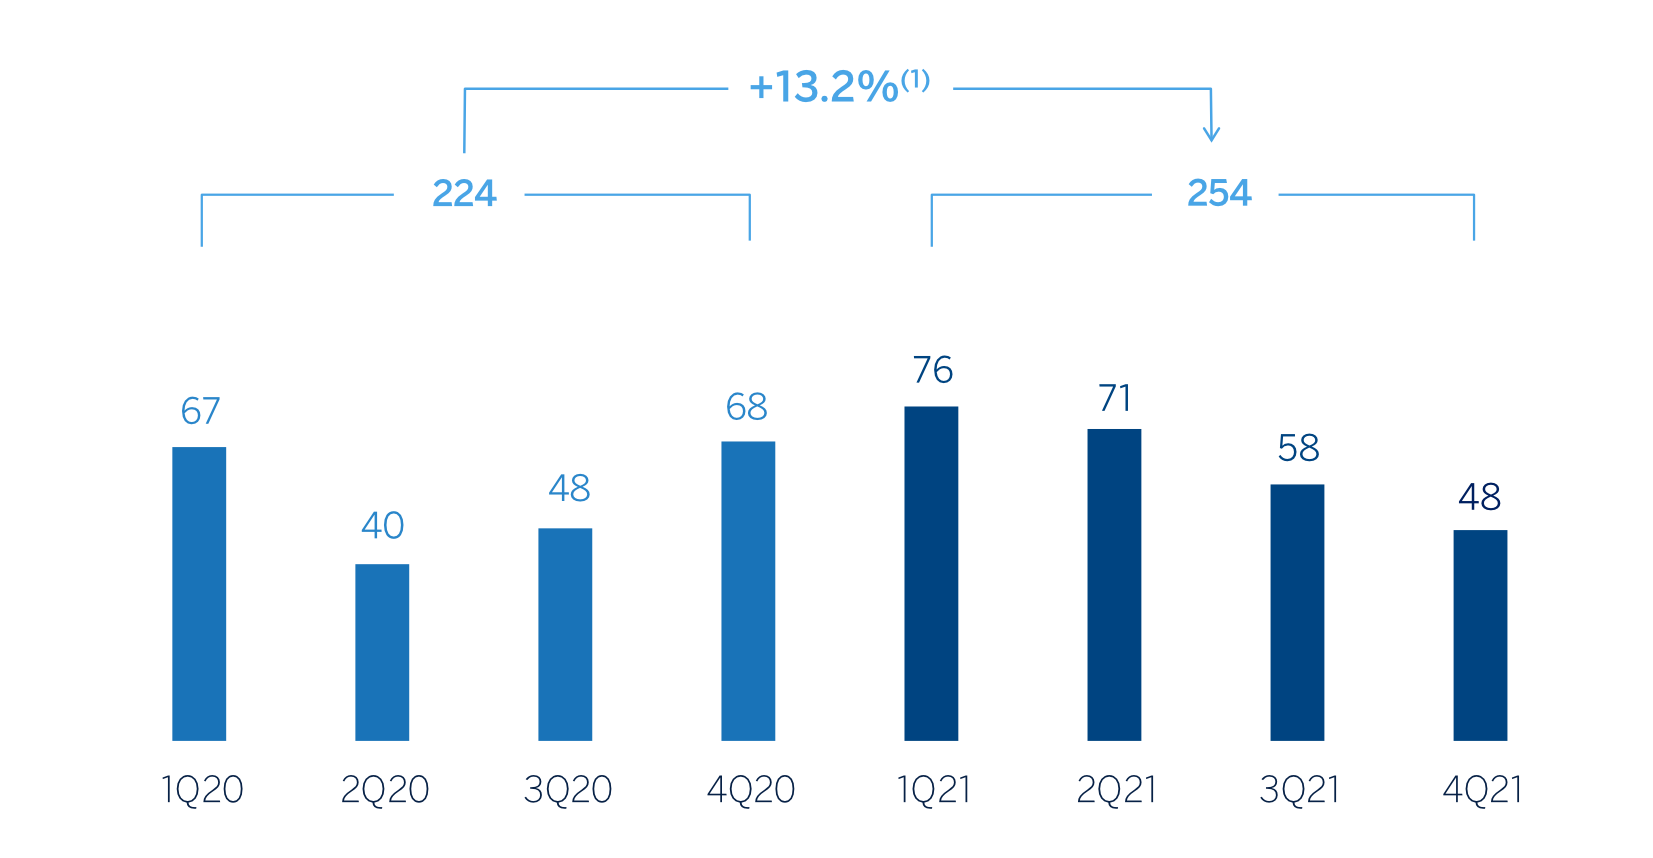
(1) At current exchange rates: +14.2%.
FINANCIAL STATEMENTS AND RELEVANT BUSINESS INDICATORS (MILLIONS OF EUROS AND PERCENTAGE)
| Income statement | 2021 | ∆% | ∆% (1) | 2020 |
|---|---|---|---|---|
| Net interest income | 281 | (3.3) | (5.4) | 291 |
| Net fees and commissions | 248 | (25.4) | (24.8) | 332 |
| Net trading income | 197 | 15.0 | 13.3 | 171 |
| Other operating income and expenses | 16 | (65.4) | (65.3) | 45 |
| Gross income | 741 | (11.6) | (12.3) | 839 |
| Operating expenses | (451) | (3.4) | (3.4) | (467) |
| Personnel expenses | (233) | (9.3) | (8.9) | (257) |
| Other administrative expenses | (197) | 4.3 | 3.7 | (189) |
| Depreciation | (20) | (0.3) | (0.7) | (20) |
| Operating income | 291 | (21.9) | (23.3) | 372 |
| Impairment on financial assets not measured at fair value through profit or loss | 27 | n.s. | n.s. | (85) |
| Provisions or reversal of provisions and other results | (4) | (51.9) | (54.6) | (8) |
| Profit (loss) before tax | 314 | 12.2 | 11.4 | 280 |
| Income tax | (60) | 4.8 | 4.3 | (57) |
| Profit (loss) for the year | 254 | 14.2 | 13.2 | 222 |
| Non-controlling interests | — | — | — | — |
| Net attributable profit (loss) | 254 | 14.2 | 13.2 | 222 |
| Balance sheets | 2021 | ∆% | ∆% (1) | 2020 |
|---|---|---|---|---|
| Cash. cash balances at central banks and other demand deposits | 3,970 | (35.1) | (40.0) | 6,121 |
| Financial assets designated at fair value | 5,684 | 286.8 | 266.2 | 1,470 |
| Of which: Loans and advances | 4,693 | n.s. | n.s. | 153 |
| Financial assets at amortized cost | 30,299 | 11.3 | 9.4 | 27,213 |
| Of which: Loans and advances to customers | 26,949 | 12.2 | 10.2 | 24,015 |
| Inter-area positions | — | — | — | — |
| Tangible assets | 70 | (6.9) | (8.2) | 75 |
| Other assets | 291 | (0.6) | (3.3) | 293 |
| Total assets/liabilities and equity | 40,314 | 14.6 | 11.2 | 35,172 |
| Financial liabilities held for trading and designated at fair value through profit or loss | 5,060 | n.s. | n.s. | 849 |
| Deposits from central banks and credit institutions | 1,709 | 0.5 | (3.5) | 1,700 |
| Deposits from customers | 6,266 | (32.9) | (35.9) | 9,333 |
| Debt certificates | 1,166 | (22.8) | (24.0) | 1,511 |
| Inter-area positions | 22,103 | 21.9 | 19.4 | 18,132 |
| Other liabilities | 723 | 18.8 | 15.5 | 608 |
| Regulatory capital allocated | 3,287 | 8.2 | 5.6 | 3,039 |
| Relevant business indicators | 31-12-21 | ∆% | ∆% (1) | 31-12-20 |
|---|---|---|---|---|
| Performing loans and advances to customers under management (2) | 26,983 | 12.3 | 10.2 | 24,038 |
| Non-performing loans | 261 | (19.6) | (20.2) | 324 |
| Customer deposits under management (2) | 6,266 | (32.9) | (35.9) | 9,333 |
| Off-balance sheet funds (3) | 597 | 4.9 | 4.9 | 569 |
| Risk-weighted assets | 29,252 | 20.2 | 17.7 | 24,331 |
| Efficiency ratio (%) | 60.8 | 55.6 | ||
| NPL ratio (%) | 0.7 | 1.0 | ||
| NPL coverage ratio (%) | 116 | 109 | ||
| Cost of risk (%) | (0.11) | 0.30 |
(1) Figures at constant exchange rates.
(2) Excluding repos.
(3) Includes pension funds.
Unless expressly stated otherwise, all the comments below on rates of change, for both activity and results, will be given at constant exchange rates. These rates, together with the changes at current exchange rates, can be found in the attached tables of the financial statements and relevant business indicators. Comments that refer to Europe exclude Spain.
Activity
The most relevant aspects of the activity of Rest of Business of BBVA Group during 2021 were:
- Lending activity (performing loans under management) increased during the year (+10.2%), thanks to the business growth of BBVA's branches located in Asia.
- Regarding credit risk indicators, the NPL ratio stood at 0.7%, 23 basis points below the end of September 2021 due to increased activity and higher recoveries of wholesale customers in Europe, improving the coverage rate 18 percentage points to 116%.
- Customer funds under management decreased by 33.6% mainly due to a decrease in deposits from wholesale customers in the New York branch.
Results
The most significant aspects of the year-on-year evolution in the area's income statement at the end of December 2021 are the following:
- The net interest income decreased -5.4% compared to the same period of the previous year, mainly due to the evolution of the New York branch.
- Net commissions fell by 24.8% compared to the end of December 2020, due to lower issuance and advisory fees in Europe and, in particular, due to lower contribution from BBVA Securities, the Group's broker-dealer in the United States.
- The NTI line increased (+13.3%) driven by a better performance of BBVA Securities, the business in Europe and branches in Asia.
- Year-on-year decrease in operating expenses (-3.4%) due to lower expenses recorded by BBVA Securities.
- The impairment on financial assets line closed December with a reversal of €27m, which positively compares against the €-85m recorded twelve months earlier, mainly explained by the positive evolution of impaired clients of the New York branch and the retail portfolio in Europe.
- As a result, the area's cumulative net attributable profit between January and December 2021 was €254m (+13.2% year-on-year).
3.2.6 Corporate Center
FINANCIAL STATEMENTS (MILLIONS OF EUROS AND PERCENTAGE)
| Income statement | 2021 | ∆% | 2020 |
|---|---|---|---|
| Net interest income | (163) | (0.4) | (164) |
| Net fees and commissions | (36) | (45.5) | (66) |
| Net trading income | 266 | 84.2 | 144 |
| Other operating income and expenses | 146 | n.s. | 22 |
| Gross income | 212 | n.s. | (63) |
| Operating expenses | (881) | 5.4 | (836) |
| Personnel expenses | (558) | 13.2 | (493) |
| Other administrative expenses | (129) | (13.4) | (149) |
| Depreciation | (194) | — | (194) |
| Operating income | (668) | (25.6) | (898) |
| Impairment on financial assets not measured at fair value through profit or loss | (2) | n.s. | 4 |
| Provisions or reversal of provisions and other results | 32 | n.s. | (289) |
| Profit (loss) before tax | (638) | (46.1) | (1,183) |
| Income tax | 94 | (64.9) | 268 |
| Profit (loss) for the year | (544) | (40.6) | (915) |
| Non-controlling interests | (20) | n.s. | — |
| Net attributable profit (loss) excluding non-recurring impacts | (564) | (38.3) | (915) |
| Profit (loss) after tax from discontinued operations (1) | 280 | n.s. | (1,729) |
| Corporate operations (2) | — | — | 304 |
| Net cost related to the restructuring process | (696) | — | — |
| Net attributable profit (loss) | (980) | (58.1) | (2,339) |
- (1) Including the results generated by BBVA USA and the rest of the companies in the United States until the sale operation closing on June 1, 2021.
- (2) Net capital gains from the sale to Allianz of the half plus one share of the company created to jointly develop the non-life insurance business in Spain, excluding the health insurance line.
| Balance sheets | 31-12-21 | ∆% | 31-12-20 |
|---|---|---|---|
| Cash, cash balances at central banks and other demand deposits | 9,609 | n.s. | 874 |
| Financial assets designated at fair value | 2,099 | 43.3 | 1,464 |
| Of which: Loans and advances | — | n.s. | — |
| Financial assets at amortized cost | 2,175 | 26.6 | 1,718 |
| Of which: Loans and advances to customers | 1,006 | 99.4 | 505 |
| Inter-area positions | — | — | — |
| Tangible assets | 1,964 | (4.8) | 2,063 |
| Other assets | 14,988 | (84.9) | 99,298 |
| Total assets/liabilities and equity | 30,835 | (70.7) | 105,416 |
| Financial liabilities held for trading and designated at fair value through profit or loss | 84 | 17.3 | 72 |
| Deposits from central banks and credit institutions | 825 | (2.4) | 845 |
| Deposits from customers | 175 | (51.7) | 363 |
| Debt certificates | 1,556 | (64.2) | 4,344 |
| Inter-area positions | 7,758 | n.s. | 64 |
| Other liabilities | 6,932 | (91.7) | 83,707 |
| Regulatory capital allocated | (35,257) | 3.7 | (33,998) |
| Total equity | 48,760 | (2.5) | 50,020 |
Results
The Corporate Center recorded a net attributable loss of €564m between January and December 2021, excluding various non-recurring impacts, among them:
- The profit (loss) after tax from discontinued operations which includes the results generated by the Group's businesses in the United States prior to its sale to PNC on June 1, 2021, which amounted to a positive result of €280m, while at the end of December 2020 it stood at €-1,729m, including the goodwill impairment in the United States which amounted to €-2,084m.
- The net cost related to the restructuring process of BBVA S.A. in Spain which amounted to €-696m, of which, before tax, €-754m correspond to the collective layoff and €-240m to branches closures.
Including both non-recurring impacts, the Corporate Center recorded a cumulative net attributable loss of €-980m at the end of December 2021, showing a significant improvement over the previous year. For comparative purposes, it should be noted that the net attributable loss recorded by the Corporate Center in 2020 was positively impacted by the materialization, in the fourth quarter of that year, of the bancassurance agreement reached with Allianz in Spain, which contributed a net capital gain of €304m, recorded in the corporate operations line of the income statement.
In addition to the aforementioned, the most relevant aspects of the year-on-year evolution are summarized below:
- Net fees and commissions evolved positively, since those from the previous year recorded expenses associated with the issuance of the first green convertible bond (CoCo) for an amount of €1,000m.
- NTI increased by 84.2% as a result, mainly, from the valuation of the Group’s stakes in Funds & Investment Vehicles in tech companies.
- The other operating income and expenses line registered a positive result at the end of December 2021, mainly due to higher dividend income obtained from the Group's stake in Telefónica and funds and investment vehicles in tech companies.
- Finally, the provisions or reversal of provisions and other results line compares very positively with the balance of the previous year, mainly due to the deterioration of investments in subsidiaries, joint venture or associates businesses in 2020.
3.2.7 Other information: Corporate & Investment Banking
Highlights
- Recovery of lending activity, which was above pre-pandemic levels, and reduction of customer funds
- Growth of recurring income and good performance of NTI
- Efficiency ratio remains at low levels thanks to the good performance of revenue items and management of discretionary expenses
- Significant reduction in the impairment on financial assets line, compared to 2020 which was strongly affected by the effects of the pandemic
BUSINESS ACTIVITY (1) (VARIATION AT CONSTANT
EXCHANGE RATES COMPARED TO 31-12-20)

(1) Excluding repos.
GROSS INCOME/ATAS (PERCENTAGE AT CONSTANT
EXCHANGE RATES)
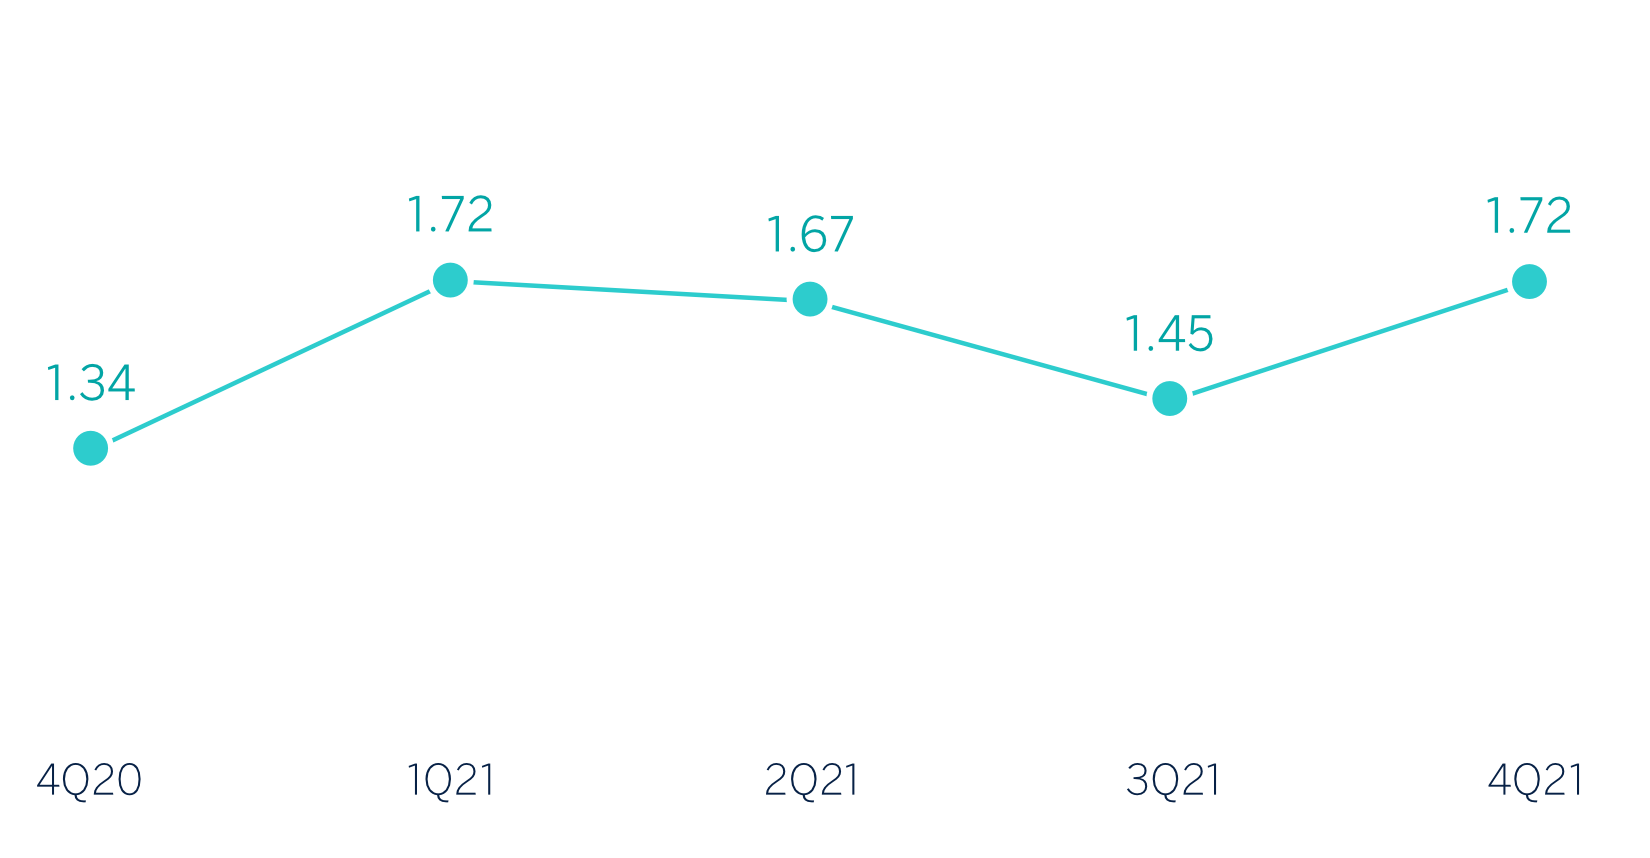
OPERATING INCOME (MILLIONS OF EUROS AT
CONSTANT EXCHANGE RATES)
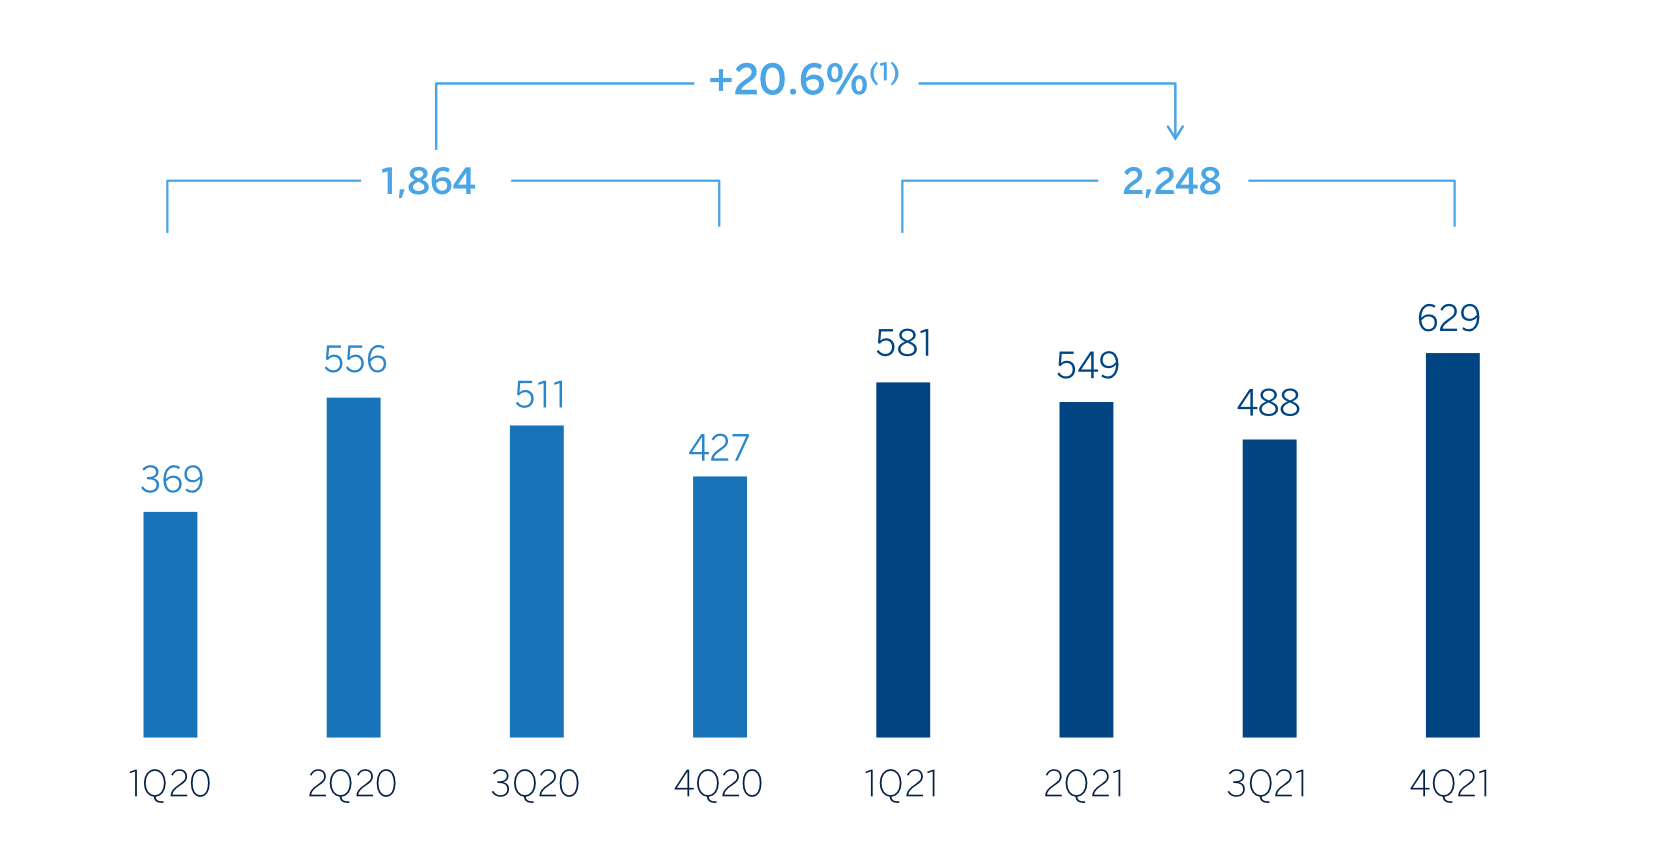
(1) At current exchange rates: +11.8%
NET ATTRIBUTABLE PROFIT (LOSS) (MILLIONS OF
EUROS AT CONSTANT EXCHANGE RATES)

(1) At current exchange rates: +40.4%
FINANCIAL STATEMENTS AND RELEVANT BUSINESS INDICATORS (MILLIONS OF EUROS AND PERCENTAGE)
| Income statement | 2021 | ∆% | ∆% (1) | 2020 |
|---|---|---|---|---|
| Net interest income | 1,576 | 6.3 | 12.2 | 1,482 |
| Net fees and commissions | 794 | 5.7 | 11.1 | 751 |
| Net trading income | 905 | 22.5 | 31.2 | 739 |
| Other operating income and expenses | (40) | 5.6 | 7.6 | (38) |
| Gross income | 3,235 | 10.3 | 16.7 | 2,934 |
| Operating expenses | (987) | 7.0 | 8.7 | (922) |
| Personnel expenses | (474) | 15.9 | 17.1 | (409) |
| Other administrative expenses | (405) | 1.8 | 4.4 | (398) |
| Depreciation | (107) | (6.7) | (6.6) | (115) |
| Operating income | 2,248 | 11.8 | 20.6 | 2,011 |
| Impairment on financial assets not measured at fair value through profit or loss | (69) | (84.9) | (82.5) | (454) |
| Provisions or reversal of provisions and other results | (12) | (78.4) | (78.4) | (54) |
| Profit (loss) before tax | 2,168 | 44.2 | 52.9 | 1,504 |
| Income tax | (593) | 50.4 | 59.0 | (394) |
| Profit (loss) for the year | 1,575 | 42.0 | 50.7 | 1,109 |
| Non-controlling interests | (327) | 48.3 | 75.7 | (220) |
| Net attributable profit (loss) | 1,248 | 40.4 | 45.3 | 889 |
(1) Figures at constant exchange rates.
| Balance sheets | 31-12-21 | ∆% | ∆% (1) | 31-12-20 |
|---|---|---|---|---|
| Cash, cash balances at central banks and other demand deposits | 5,125 | (31.6) | (35.5) | 7,491 |
| Financial assets designated at fair value | 131,711 | 22.1 | 21.7 | 107,838 |
| Of which: Loans and advances | 55,232 | 91.8 | 92.8 | 28,804 |
| Financial assets at amortized cost | 72,363 | 1.9 | 5.6 | 71,031 |
| Of which: Loans and advances to customers | 62,042 | 4.8 | 9.3 | 59,225 |
| Inter-area positions | — | — | — | — |
| Tangible assets | 43 | (13.3) | (10.9) | 50 |
| Other assets | 110 | (87.0) | (85.5) | 843 |
| Total assets/liabilities and equity | 209,352 | 11.8 | 12.8 | 187,253 |
| Financial liabilities held for trading and designated at fair value through profit or loss | 95,283 | 11.9 | 11.0 | 85,129 |
| Deposits from central banks and credit institutions | 12,884 | (19.3) | (19.5) | 15,958 |
| Deposits from customers | 38,360 | (10.7) | (9.1) | 42,966 |
| Debt certificates | 5,746 | 174.2 | 190.9 | 2,096 |
| Inter-area positions | 44,184 | 46.2 | 54.1 | 30,218 |
| Other liabilities | 2,913 | 38.1 | 14.2 | 2,108 |
| Regulatory capital allocated | 9,983 | 13.7 | 20.4 | 8,778 |
(1) Figures at constant exchange rates.
| Relevant business indicators | 31-12-21 | ∆% | ∆% (1) | 31-12-20 |
|---|---|---|---|---|
| Performing loans and advances to customers under management (2) | 61,588 | 6.7 | 11.3 | 57,704 |
| Non-performing loans | 1,417 | 11.2 | 63.8 | 1,275 |
| Customer deposits under management (2) | 37,445 | (11.5) | (9.9) | 42,313 |
| Off-balance sheet funds (3) | 1,249 | 21.3 | 28.1 | 1,030 |
| Efficiency ratio (%) | 30.5 | 31.4 |
(1) Figures at constant exchange rates.
(2) Excluding repos.
(3) Includes mutual funds and other off-balance sheet funds.
Strategic business principles of Corporate & Investment Banking
The area of Corporate & Investment Banking (CIB) strives to “be more relevant to its clients, helping them achieve their business goals, offering wholesale solutions and contributing to a more sustainable future” and to achieve this it is based on 4 principles:
- 1. Globality: turn CIB’s global presence into a competitive advantage to expand its business, capturing the full potential of its international clients. CIB’s cross-border business is an excellent indicator for measuring this value creation, generating tangible results, as evidenced by the year-on-year increase in revenues generated by this business in 2021 (+6%).
- 2. Consulting capabilities with in-depth knowledge of the industry, which have enabled CIB to generate new growth opportunities. This represents a year-on-year increase in revenues of 45% in 2021, although it will continue to increase in the forthcoming years.
- 3. Sustainability: CIB has taken advantage of the massive change in industries, actively advising and financing, as stated in the second strategic priority of the BBVA Group, “helping our clients in their transition to a sustainable future”. Proof of this is the significant year-on-year increase of 78% in sustainable channelled funds as of December 31, 2021.
- 4. Robust operating model: these three levers are based on a model of operational excellence that helps CIB achieve the highest level of compliance and internal control for the business: (I) optimize capital; (II) continuously seek efficiency improvements (the 30.5% efficiency ratio of CIB at the end of 2021 is well below the average of its European and American competitors); and (III) proactively manage CIB’s talent, which is fundamental to the business.
Activity
Unless expressly stated otherwise, all the comments below on rates of change, for both activity and results, will be given at constant exchange rates. These rates, together with changes at current exchange rates, can be found in the attached tables of financial statements and relevant business indicators.
The most relevant aspects related to the area's activity in 2021 were:
- Lending activity (performing loans under management) recorded a growth of (11.3%) in the year, standing at the end of December 2021 well above the level prior to the outbreak of the pandemic in March 2020, showing clear signs of recovery, especially in the second half of 2021, which has proved to be a complex year in terms of activity due to the competitive environment, excess liquidity and difficulties in renewing financing lines pre-approved in 2020. By geographical areas, Turkey, Asia and, to a lesser extent, South America showed a positive evolution.
- Customer funds fell by 9.0% in 2021, due to some transactions originated in the last months of 2020 that had not been renewed in 2021, being this trend widespread in all business areas, except for Mexico and Turkey, which recorded a growth of 22.7% and 44.3%, respectively, in 2021.
Results
CIB generated a net attributable profit of €1,248m in 2021, which represents an increase of 45.3% on a year-on-year basis, thanks to the growth in recurring income and NTI as well as lower provisions for impairment on financial assets, which increased significantly in 2020 due to the COVID-19 pandemic. It should also be noted that all business lines of the CIB area recorded growth, both in income and at the level of net attributable profit, compared to 2020.
The most relevant aspects of the year-on-year evolution in the income statement of Corporate & Investment Banking are summarized below:
- Net interest income registered double-digit growth (+12.2%), supported by the evolution in Spain and Turkey. In addition to the performance of lending activity mentioned above, it is worth noting the commercial effort to adjust the price of certain transactions, one of the strategic focuses of the area in 2021, which has led to an improvement in profitability per transaction. The performance of the Global Markets unit in Spain and Mexico was also relevant.
- Increase in net fees and commissions (+11.1%), mainly due to the performance of investment and transactional banking, the latter benefiting from the reactivation of business in 2021, with relevant agreements in Spain, Asia and Mexico. On the contrary, Global Markets' primary market operations have been slowed down due to lower liquidity needs of the customers. By geographical areas, double-digit growth in Spain, Mexico, South America and Turkey stood out.
- NTI showed a good evolution (+31.2%), mainly due to the performance of the Global Markets unit, due to income from foreign exchange positions in emerging markets, where the macro situation and political uncertainty in many of them favored volatility, boosting business with customers and trading operations, and to the recovery of dividends after the payment restrictions in force in 2020.
- Operating expenses increased by 8.7% in 2021. The year-on-year comparison is affected by the cost containment plans implemented by CIB in 2020 which did not re-occur in 2021 after the return to normality, although the area continues to focus its efforts on vacancy management and discretionary expenses.
- Provisions for impairment on financial assets were significantly lower than in the previous year, driven by the improved outlook, compared to 2020 which was severely affected by provisions related to COVID-19, as well as by lower impacts on individual clients.
3.3 Subsequent events
Between January 1 and February 3, 2022, J.P. Morgan AG, as manager of the first tranche, has acquired 65,272,189 BBVA shares as part of its share buyback program (see Note 4 of the Consolidated Financial Statements).
On February 3, 2022, BBVA announced that its Board of Directors agreed, within the Framework Program, to carry out a second buyback program (the “Second Tranche”) aimed at reducing BBVA’s share capital, for a maximum amount of €2,000 million and a maximum number of shares to be acquired equal to the result of subtracting from 637,770,016 own shares (9.6% of BBVA’s share capital at that date) the number of own shares finally acquired in execution of the First Tranche. The implementation of the Second Tranche, which will also be executed externally through a lead-manager, will begin after the end of the implementation of the First Tranche and shall end no later than October 15, 2022.
On January 3, 2022, it was announced that a cash distribution in the amount of €0.23 gross per share as shareholder remuneration in relation to the Group's result in the 2021 financial year was expected to be submitted to the relevant governing bodies of BBVA for consideration.
From January 1, 2022 to the date of preparation of these Consolidated Financial Statements, no other subsequent events not mentioned above in these financial statements have taken place that could significantly affect the Group’s earnings or its equity position.