
Eligible Own Funds and minimum Requirements
BBVA Group’s regulatory capital tiers
Article 92 of the CRR establishes that credit institutions must maintain the following own funds requirements at all times:
- a) Common Equity Tier 1 capital ratio of 4.5%, calculated as Common Equity Tier 1 capital expressed as a percentage on the total amount of risk-weighted assets.
- b) Tier 1 capital ratio of 6%, calculated as the level of tier capital 1 expressed as a percentage of the total amount of risk-weighted assets.
- c) Total capital ratio of 8%, calculated as the total own funds expressed as a percentage of the total amount of risk-weighted assets.
Notwithstanding the application of the Pillar 1 requirement, CRD IV allows competent authorities to require credit institutions to maintain a level of own funds higher than the requirements of Pillar 1 to cover types of risk other than those already covered by the Pillar 1 requirement (this power of the competent authority is commonly referred to as "Pillar 2").
Furthermore, from 2016 and in accordance with CRD IV, credit institutions must comply with the following combined requirement of capital buffers at all times: (i) the capital conservation buffer, (ii) the buffer for global systemically important banks (the "G-SIB" buffer), (iii) the entity-specific countercyclical capital buffer, (iv) the buffer for other systemically important banks ("D-SIB" buffer) and (v) the systemic risk capital buffer. The “combined capital buffer requirement” must be met with Common Equity Tier 1 capital (“CET1”) to cover both minimum capital required by “Pillar 1” and “Pillar 2".
Both the capital conservation buffer and the G-SIB buffer (where appropriate) will apply to credit institutions as it establishes a percentage greater than 0%.
The buffer for global systemically important banks applies to those institutions on the list of global systemically important banks, which is updated annually by the Financial Stability Board (“FSB”). Considering the fact that BBVA does not appear on that list, as at the report date, the G-SIB buffer does not apply to BBVA. Detailed information on each of the quantitative indicators that form part of the evaluation process is available on the BBVA Group's website.
The Bank of Spain has extensive discretionary powers as regards the countercyclical capital buffer specific to each bank, the buffer for other systemically important financial institutions (which are those institutions considered to be systemically important domestic financial institutions “D-SIB”) and the buffer against systemic risk (to prevent or avoid systemic or macroprudential risk). The European Central Bank (ECB) has the powers to issue recommendations in this respect following the entry into force on November 4, 2014 of the Single Supervisory Mechanism (SSM).
With regard to minimum capital requirements, following the latest decision of the SREP (Supervisory Review and Evaluation Process), which comes into force as of January 1, 2023, the ECB has notified the Group of maintaining the Pillar 2 requirement at 1.71 Therefore, BBVA must maintain a CET1 capital ratio of 8.75% and a total capital ratio of 13.00% at a consolidated level.
Thus, the consolidated overall capital requirement includes: i) the minimum capital requirement of Common Equity Tier 1 (CET1) of Pillar 1 (4.5%); ii) the capital requirement of Additional Tier 1 (AT1) of Pillar 1 (1.5%); iii) the capital requirement of Tier 2 of Pillar 1 (2%); iv) the CET1 requirement of Pillar 2 (0.96%), v) the capital requirement of Additional Tier 1 (AT1) of Pillar 2 (0.32%); vi) the capital requirement of Tier 2 of Pillar 2 (0.43%); vii) the capital conservation buffer (2.5% of CET1); viii) the capital buffer for Other Systemically Important Institutions (O-SIIs) (0.75% of CET1); and ix) the countercyclical buffer (CCyB) (0.04% of CET1).
The BBVA Group has set the objective of maintaining a fully-loaded CET1 ratio at a consolidated level between 11.5% and 12.0%. At the end of the financial year 2022, the fully-loaded CET1 ratio was above this target management range.
CET1 phased-in ratio reach 12.68% which represents +405 basis points over the minimum requirement of 8.63%.
Capital requirements and capital ratios (Phased-in)
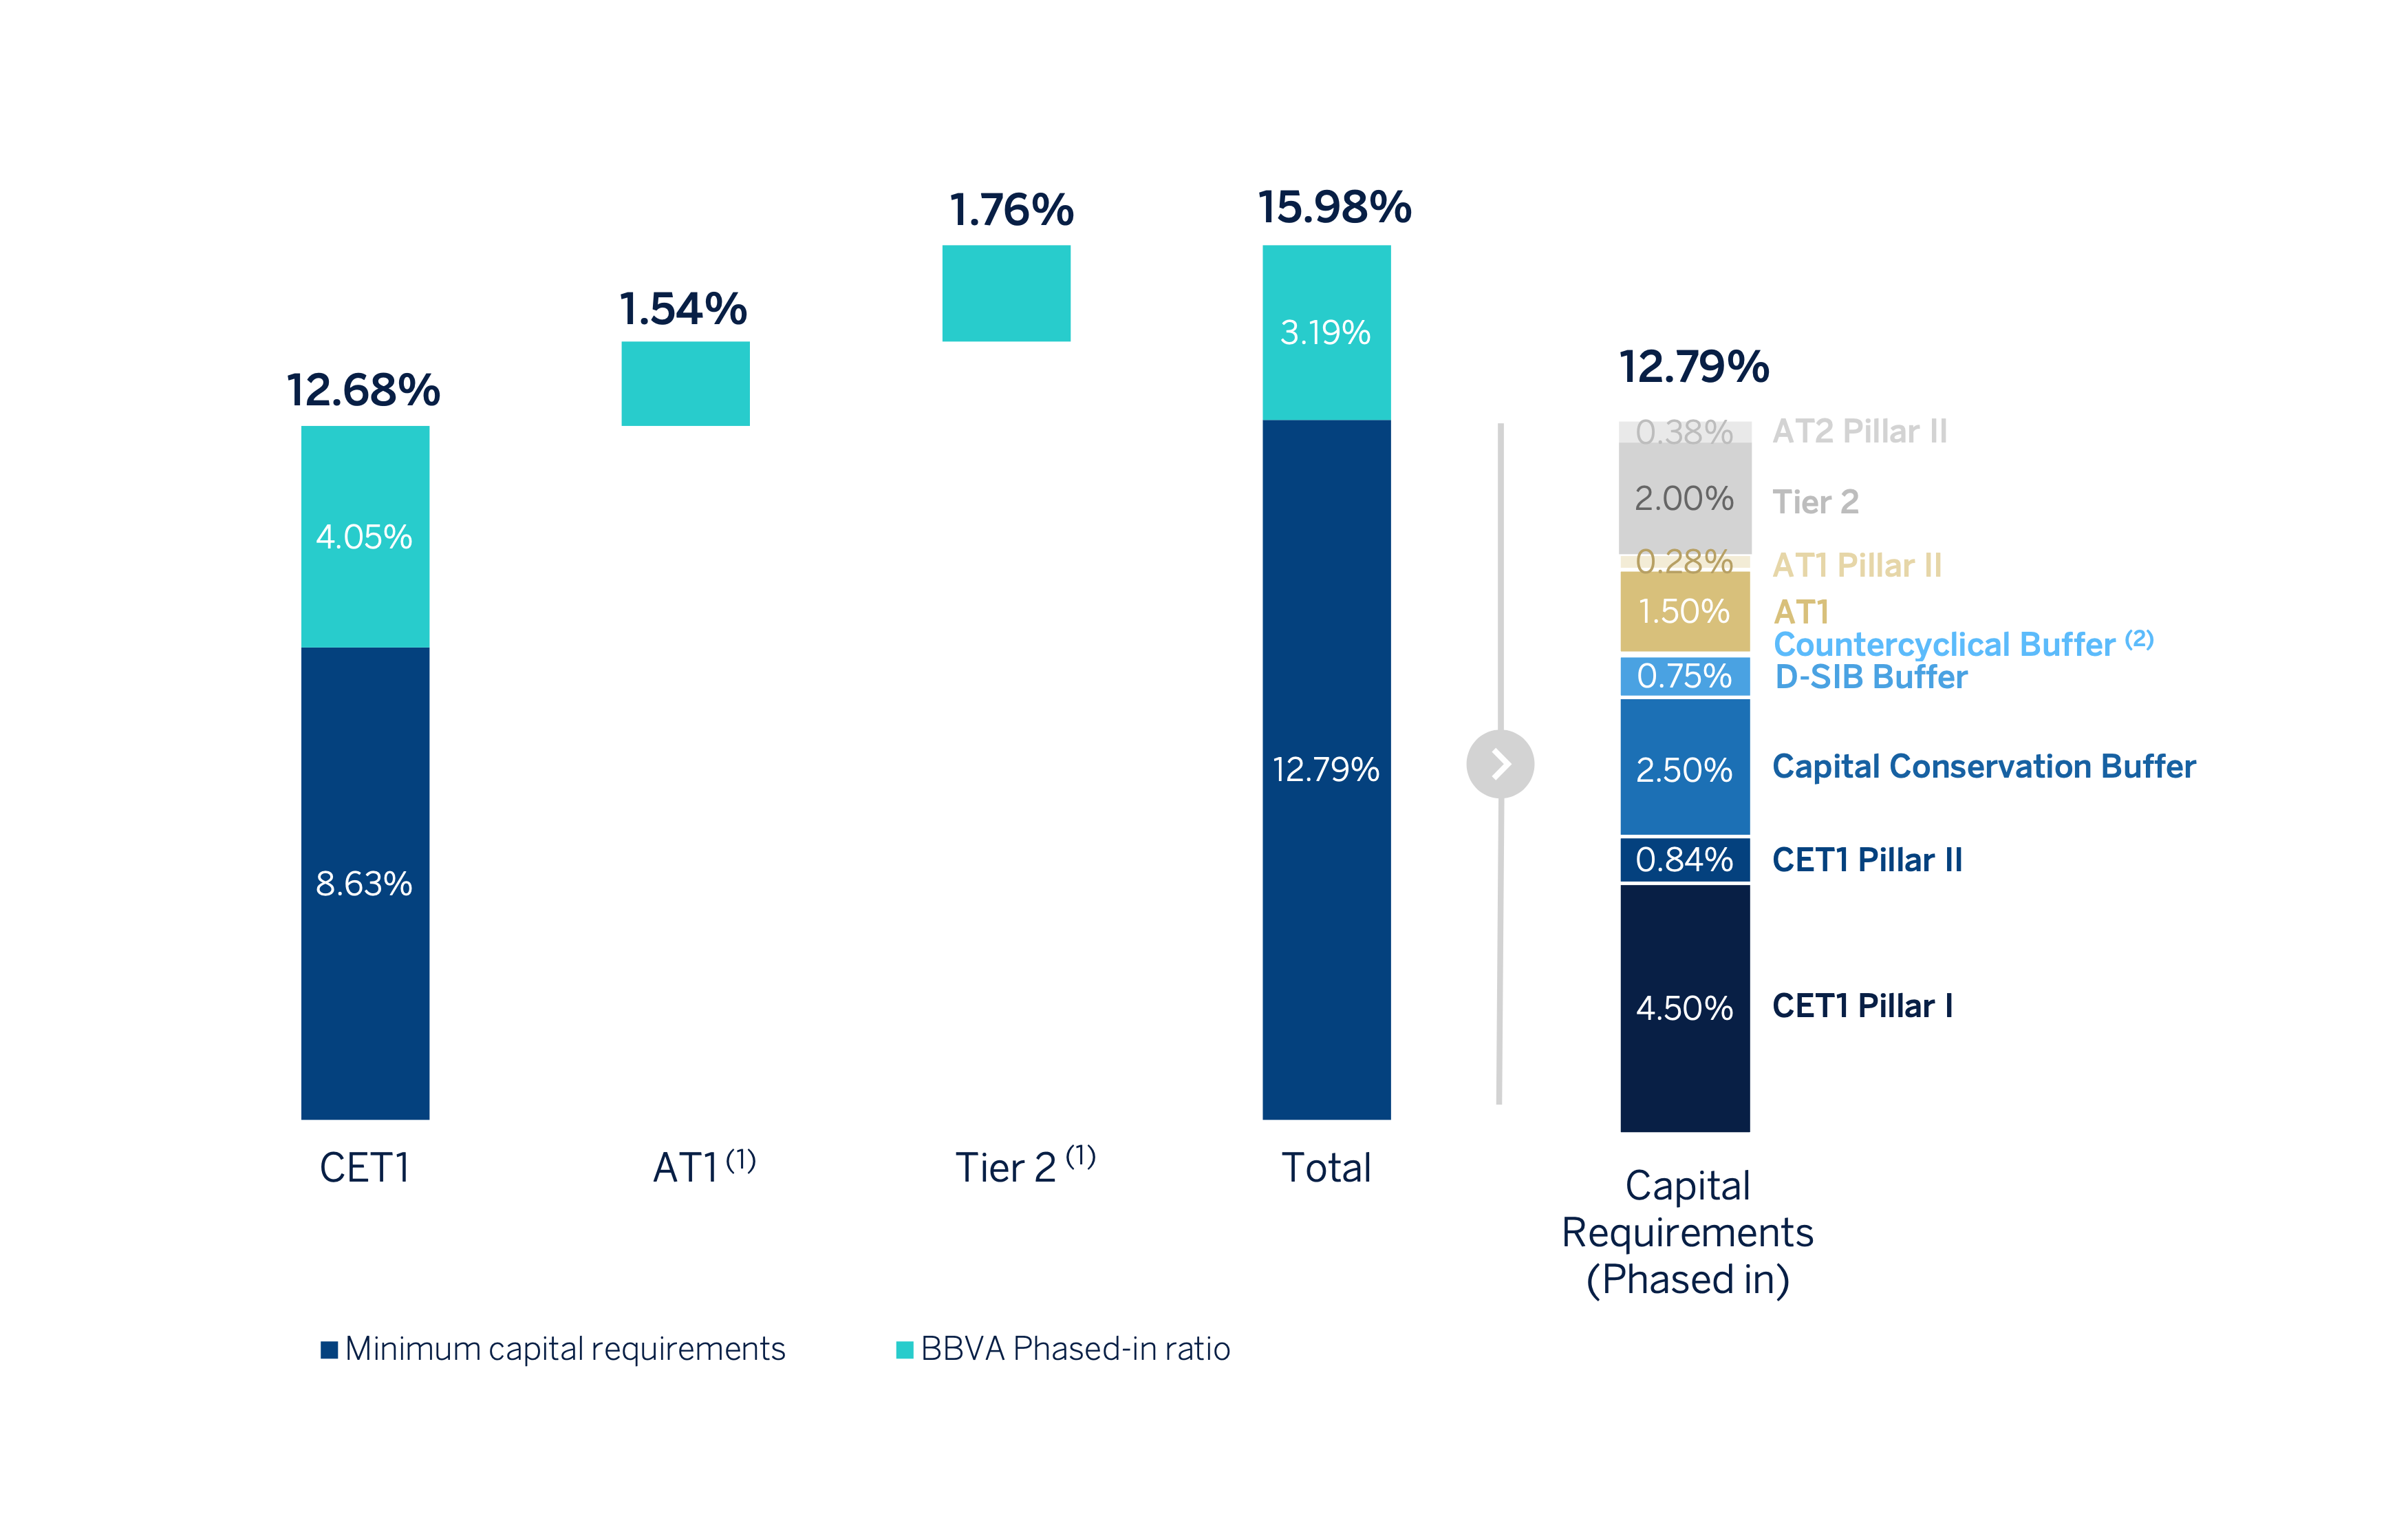
(1) The AT1 requirement is 1.78%, and Tier2, 2.38%.
(2) The countercyclical capital buffer as of December 31, 2022 amounts to 0.04%.
The following table shows the CET1 ratio that would trigger restrictions on capital distribution capacity and the capital ratios as of December 2022:
Capital distribution constraints
| CET1 capital ratio that would trigger capital distribution constraints (%) | Current CET1 capital ratio (%) | |
|---|---|---|
| CET1 Pillar 1 | 4.50% | |
| CET1 Pillar 2 (P2R) | 0.84% | |
| Capital conservation buffer | 2.50% | |
| D-SIB buffer | 0.75% | |
| Countercyclical buffer | 0.04% | |
| CET1 phased-in minimum plus Basel III buffers (excluding capital used to meet other minimum regulatory capital) | 8.63% | 12.68% |
| CET1 phased-in minimum plus Basel III buffers (including capital used to meet other minimum regulatory capital) | 9.49% | 12.68% |
Eligible Own Funds
For the purposes of calculating minimum capital requirements, according to Regulation (EU) 575/2013 and subsequent amendments, which are applicable as of the report date, the elements and instruments of Tier 1 capital are defined as the sum of Common Equity Tier 1 capital (CET1) and additional Tier 1 capital (AT1), as defined in Part Two, Title I, Chapters I to III of the CRR, as well as their corresponding deductions, in accordance with Articles 36 and 56, respectively.
Also considered are the elements of Tier 2 capital defined in Part Two, Title I of Chapter IV, Section I of the CRR. The deductions defined as such in Section II of the same Chapter are also considered.
The amount of total eligible capital, net of deductions, for the different items making up the capital base as of December 31, 2022 and 2021, respectively, is below, in accordance with the requirements for the disclosure of information related to regulatory own funds established by the Implementing Technical Standards (EBA/ ITS/2020/04) (Implementing Regulation 2021/637 of March 15, 2021):
Amount of capital (EU CC1) (Million euros)
| Reference to template EU CC2(1) | 12-31-2021 | 06-30-2021 | 12-31-2020 |
|---|---|---|---|
| a) Capital and share premium | 23,810 | 25,463 | 26,866 |
| b) Retained earnings | 31,436 | 31,214 | 30,745 |
| c) Other accumulated earnings and other reserves | (13,952) | (13,295) | (17,200) |
| d) Minority interests eligible as CET1 | 1,853 | 1,988 | 2,800 |
| e) Net profit of the year attributed to the Group (2) | 3,814 | 1,478 | 2,573 |
| Common Equity Tier 1 Capital before other regulatory adjustments | 46,962 | 46,847 | 45,784 |
| f) Additional value adjustments | (356) | (350) | (260) |
| g) Intangible assets | (1,395) | (1,416) | (1,484) |
| h) Deferred tax assets | (1,057) | (1,048) | (1,009) |
| i) Fair value reserves related to gains o losses on cash flow hedges | 425 | 662 | 483 |
| j) Expected losses in equity | (16) | — | — |
| k) Profit or losses on liabilities measured at fair value | (72) | (97) | (2) |
| l) Direct, indirect and synthetic holdings of own instruments | (356) | (1,749) | (2,800) |
| m) Securitisations tranches at 1250% | (1) | (24) | (22) |
| n) Other CET1 regulatory adjustments(2) | (1,396) | (1,262) | (741) |
| Total Common Equity Tier 1 regulatory adjustments | (4,223) | (5,284) | (5,835) |
| Common Equity Tier 1 (CET1) | 42,738 | 41,563 | 39,949 |
| o) Equity instruments and AT1 share premium | 4,875 | 4,925 | 5,265 |
| p) Qualifying Tier 1 capital included in consolidated AT1 capital issued by subsidiaries and held by third parties | 318 | 339 | 472 |
| Additional Tier 1 before regulatory adjustments | 5,193 | 5,264 | 5,737 |
| Total regulatory adjustments of Additional Tier 1 | — | — | — |
| Additional Tier 1 (AT1) | 5,193 | 5,264 | 5,737 |
| Tier 1 (Common Equity Tier 1+Additional Tier 1) | 47,931 | 46,828 | 45,686 |
| q) Equity instruments and Tier 2 share premiums | 3,510 | 3,737 | 4,324 |
| r) Eligible own funds instruments included in consolidated Tier 2 issued by subsidiaries and held by third parties | 2,310 | 2,333 | 2,516 |
| s) Credit risk adjustments | 213 | 758 | 722 |
| Tier 2 before regulatory adjustments | 6,033 | 6,828 | 7,562 |
| t) Tier 2 regulatory adjustments | (103) | (9) | (179) |
| Tier 2 | 5,930 | 6,819 | 7,383 |
| Total Capital (Total capital = Tier 1 + Tier 2) | 53,861 | 53,647 | 53,069 |
| Total RWAs | 337,066 | 330,871 | 307,795 |
| CET1 (phased-in) | 12.68% | 12.56% | 12.98% |
| CET1 (fully loaded) | 12.61% | 12.45% | 12.75% |
| TIER 1 (phased-in) | 14.22% | 14.15% | 14.84 |
| TIER 1 (fully loaded) | 14.15% | 14.05% | 14.62% |
| Total Capital (phased-in) | 15.98% | 16.21% | 17.24% |
| Total Capital (fully loaded) | 15.94% | 16.11% | 16.99% |
- (*) As of 31 December 2022, the difference between the phased-in and fully loaded ratios arises from the transitional treatment of certain elements of capital, mainly the impact of IFRS 9, to which the BBVA Group has voluntarily adhered (in accordance with article 473a of the CRR). See table 11 for more information on the transitional impact of IFRS 9.
In addition, noted that the Group to date is not applying the transitional treatment of unrealised gains and losses valued at fair value through Other comprehensive Income (hereinafter, unrealised P&L measured at fair value through OCI) as defined in Article 1.6 of that Regulation amending Article 468 of the CRR. Therefore, the Group’s own funds, capital and leverage ratios to date reflect the full impact of the above-mentioned unrealised P&L measured at fair value through OCI. - (1) References to regulatory balance sheet (EU CC2) where these items are included.
- (2) As of December 31, 2022, the total shareholder remuneration for 2022 is deducted from CET1, so that "Net profit of the year attributable to the Group" includes the amount of cash remuneration (€2,593 million) and "Other CET1 regulatory adjustments" includes the deduction of €422 million corresponding to the execution of a program to repurchase BBVA shares, approved by the Board of Directors on January 31, 2023 and subject to obtaining the corresponding regulatory authorizations.
The CET1 fully-loaded ratio of the BBVA Group (hereinafter, the Group) stood at 12.61% at the end of December 2022, which allows maintaining a large management buffer over the Group's CET1 requirement (8.63%) and over the Group's target management range established between 11.5-12% of CET1. The phased-in CET1 ratio was 12.68%, the difference between the two ratios is explained by the effect of the transitional adjustments of the IFRS9 impacts on solvency indicators.
These ratios incorporate the effects of the corporate transactions carried out during the year, with a combined impact of -38 basis points on the Group's CET1. These transactions are the agreement reached with Neon Payments Limited in the first quarter of 2022, the voluntary takeover bid for Garanti BBVA and the acquisition from Merlin of 100% of Tree Inversiones Inmobiliarias Socimi, S.A. in the second quarter of 2022. Excluding these elements, the CET1 fully loaded ratio has increased by 24 basis points, mainly explained by: the generation of earnings in the year (+214 basis points) which, net of shareholder remuneration and payment of CoCos coupons (Contingent Convertible ) has generated a positive contribution of +106 basis points. On the other hand, the growth of risk-weighted assets (RWAs) in constant has subtracted -101 basis points, reflecting the organic growth of the activity. Finally, the other elements that make up CET1 had a positive contribution of +19 basis points; these include market effects, minority interests, regulatory impacts and the compensation in equity of the negative effect on results due to the loss in value of the net monetary position in hyperinflationary economies.
Additional Tier 1 (AT1) fully-loaded capital stood at 1.54% at the end of December 2022 (1.54% phased-in), 34 basis points lower than in 2021, which includes the €500 million reduction effect from the early redemption of a CoCos issue dating back to 2017.
The Tier 2 fully-loaded ratio stood at 1.79% (1.76% phased-in) which represents a reduction of -58 basis points compared to 2021, mainly explained by the effect of increased RWAs during the year and the lower computability of internal credit model provisions.
As a consequence of the foregoing, the fully-loaded total capital ratio stands at 15.94 % as of December 2022, while the total phased-in ratio is 15.98 % as of the same date.
Following the latest SREP (Supervisory Review and Evaluation Process) decision, the ECB has informed the Group that with effect from January 1, 2023, it must maintain at consolidated level a total capital ratio of 13.00% and a CET1 capital ratio of 8.75%, which include a Pillar 2 requirement at consolidated level of 1.71% (a minimum of 0.96% must be satisfied with CET1). Regarding this total capital requirement, 0.21% (0.12% to be met by CET1) corresponds to the ECB's prudential provisioning expectations. Prudential provisions, as of January 1, 2023, will no longer be treated as a deduction in CET1 with a positive effect of 19 basis points on the December 2022 close, which would be equivalent to a pro-forma ratio of 12.80%.
The evolution of fully loaded CET1 ratio during the year 2022 is below:
Annual evolution of the CET1 fully loaded ratio
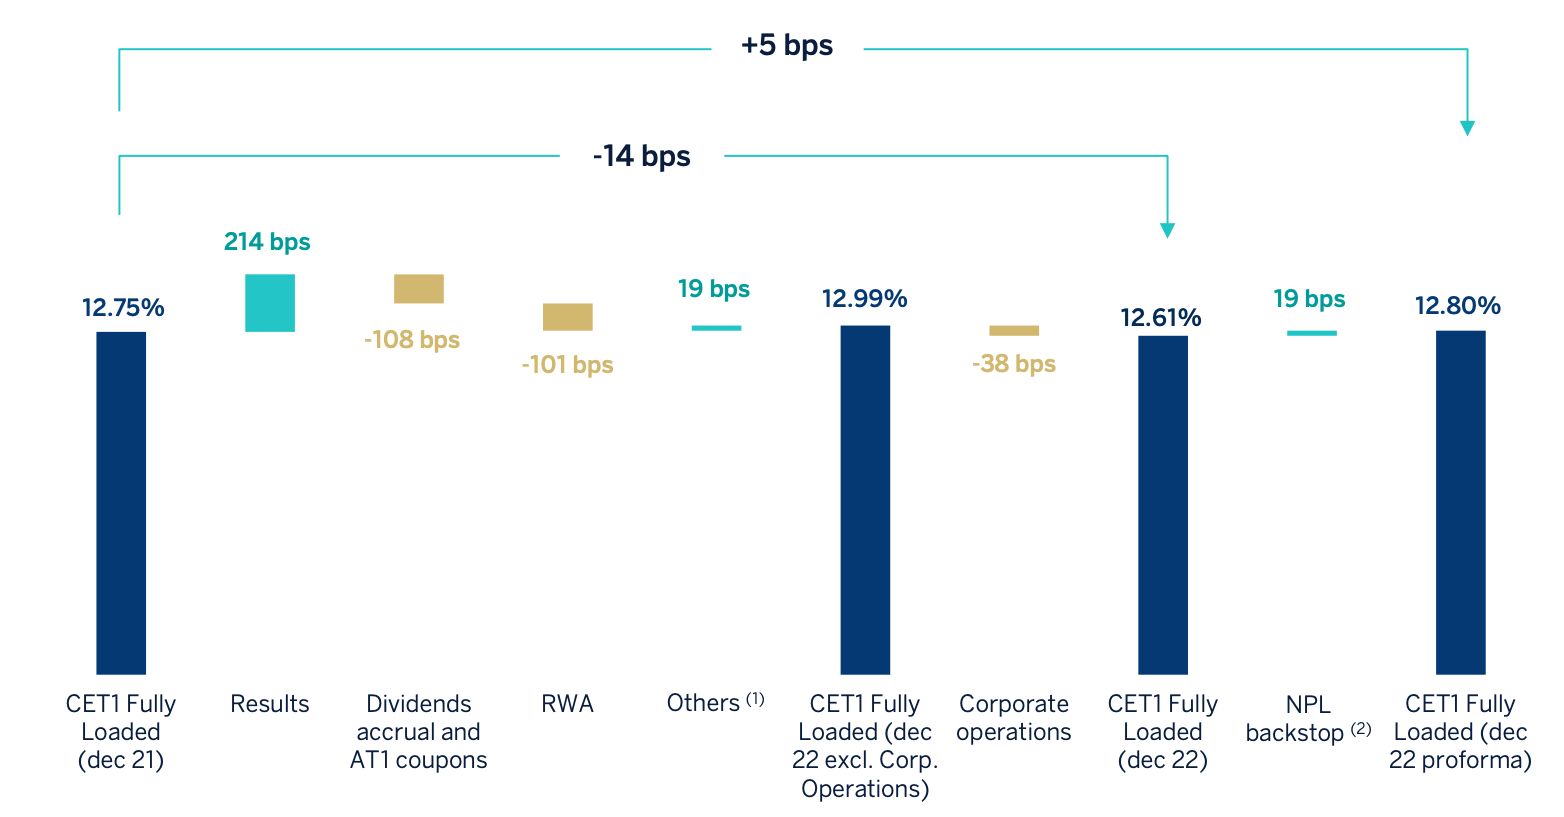
(1) Includes, among others, minority interests, market related impacts, regulatory impacts and the credit in OCIs that offsets the debit in P&L due to the hyperinflation accounting.
(2) Includes the reversal of the NPL backstop deduction (+19 bps) in January 2023. From that time the SREP Requirement is 8.72% for BBVA Group.
The process of reconciliation between accounting own funds and regulatory own funds is shown below. Based on the shareholders’ equity reported in the Consolidated Financial Statements of BBVA Group and applying the deductions and adjustments shown in the table below, reaching to the regulatory capital figure eligible for solvency purposes:
Article 468 of the CRR. Therefore, the Group's own funds, and its capital adequacy and leverage ratios, reflect to date the full impact of the aforementioned unrealised gains and losses measured at FVTOCI.
Reconciliation of the Public Balance Sheet from the accounting perimeter to the regulatory perimeter (Million Euros)
| Eligible capital own funds | 12-31-2022 | 12-31-2021 |
|---|---|---|
| Capital | 2,955 | 3,267 |
| Share premium | 20,856 | 23,599 |
| Retained earnings, revaluation reserves and other reserves | 34,881 | 29,984 |
| Other equity | 63 | 60 |
| Less: Treasury shares | (29) | (647) |
| Attributable to the parent company | 6,420 | 4,653 |
| Attributable dividend | (722) | (532) |
| Total equity | 64,422 | 60,384 |
| Accumulated other comprehensive income (Loss) | (17,432) | (16,477) |
| Non-controlling interest | 3,624 | 4,853 |
| Shareholders`equity | 50,615 | 48,760 |
| Goodwill and other intangible assets | (1,395) | (1,484) |
| Deductions | (1,722) | (1,484) |
| Differences from solvency and accounting level | (123) | (130) |
| Equity not eligible at solvency level | (123) | (130) |
| Other adjustments and deductions (2) | (6,032) | (7,197) |
| Common Equity Tier 1 (CET1) | 42,738 | 39,949 |
| Additional Tier 1 before Regulatory Adjustments | 5,193 | 5,737 |
| Total regulatory adjustments of additional Tier 1 | — | — |
| Tier 1 | 47,931 | 45,686 |
| Tier 2 | 5,930 | 7,383 |
| Total Capital (Tier 1 + Tier 2) | 53,861 | 53,069 |
| Total Minimum capital required (1) | 43,111 | 39,275 |
- (1) Calculated over minimum total capital applicable for each period.
- (2) Other adjustments and deductions include, among others, the adjustment related to the amount of minority interest not eligible as capital, the amount of the treasury shares repurchase up to the maximum limit authorised by the ECB to BBVA Group and the amount of dividends not yet distributed.
The table below shows a comparison of institutions' own funds and capital and leverage ratios with and without the application of the transitional treatment of IFRS9 impact, and with and without the application of the transitional treatment in accordance with Article 468 of the CRR, according to the standard format set by EBA guidelines (EBA/GL/2018/01).
Since 2018 BBVA Group has applied the transitional treatment of IFRS9 impact. Therefore, phased-in capital ratios and leverage ratio are calculated taking into account the transitional provisions as defined by article 473a of the CRR and its subsequent amendments made by Regulation 2020/873 of the Parliament and Council of 24 June 2020 in response to the COVID-19 pandemia. The Group also applies paragraph 7a of the aforementioned article in calculating the impact of the transitional treatment on phased in risk-weighted assets.
In addition, as of the end of December 2022, the Group is not applying the transitional treatment of unrealised gains and losses measured at fair value through other comprehensive income (hereinafter, unrealised gains and losses measured at FVTOCI) outlined in Article 1, Paragraph 6 of the aforementioned regulation amending.
IFRS 9-FL - Comparison of institutions’ own funds and capital and leverage ratios with and without the application of transitional arrangements for IFRS 9 or analogous ECLs and with and without the application of the temporary treatment of gains and losses measured at Fair Value through OCI (Million euros)
| Available capital (million euros) | 12-31-2022 | 09-30-2022 | 06-30-2022 | 03-31-2022 | 12-31-2021 |
|---|---|---|---|---|---|
| Common Equity Tier 1 Capital (CET1) | 42,738 | 42,876 | 41,563 | 40,537 | 39,949 |
| Common Equity Tier 1 (CET1) if the transitional provisions of IFRS 9 or similar ECL had not been applied | 42,484 | 42,494 | 41,181 | 40,155 | 39,184 |
| Common Equity Tier 1 (CET1) if the transitional treatment of unrealized gains and losses measured at fair value through OCI (other comprehensive income) had not been applied | |||||
| Tier 1 capital (T1) | 47,931 | 48,281 | 46,828 | 46,364 | 45,686 |
| Tier 1 capital (T1) if the transitional provisions of IFRS 9 or similar ECL had not been applied | 47,677 | 47,899 | 46,446 | 45,982 | 44,922 |
| Tier 1 (T1) capital if the transitional treatment of unrealized gains and losses measured at fair value through OCI (other comprehensive income) had not been applied | |||||
| Total capital | 53,861 | 54,895 | 53,647 | 53,203 | 53,069 |
| Total capital if the transitional provisions of IFRS 9 or similar ECL had not been applied | 53,699 | 54,512 | 53,264 | 52,820 | 52,473 |
| Total capital if the transitional treatment of unrealized gains and losses measured at fair value with changes in OCI had not been applied (other comprehensive income) | |||||
| Risk-weighted assets (million euros) | |||||
| Total risk-weighted assets | 337,066 | 341,678 | 330,871 | 316,361 | 307,795 |
| Total risk-weighted assets had the transitional provisions of IFRS 9 or similar ECL not been applied | 336,884 | 341,448 | 330,642 | 316,131 | 307,335 |
| Total risk-weighted assets if the transitional treatment of unrealised gains and losses measured at fair value through OCI had not been applied (other comprehensive income) | |||||
| Capital ratios | |||||
| Common Equity Tier 1 (CET1) (as a percentage of the risk exposure amount) | 12.68% | 12.55% | 12.56% | 12.81% | 12.98% |
| Common Equity Tier 1 (CET1) (as a percentage of the risk exposure amount) if the transitional provisions of IFRS 9 or similar ECL had not been applied | 12.61% | 12.45% | 12.45% | 12.70% | 12.75% |
| Common Equity Tier 1 (CET1) (as a percentage of the risk exposure amount) if the transitional treatment of unrealized gains and losses measured at fair value through OCI (other comprehensive income) had not been applied | |||||
| Tier 1 capital (T1) (as a percentage of the amount of the exposure) | 14.22% | 14.13% | 14.15% | 14.66% | 14.84% |
| Tier 1 capital (T1) (as a percentage of the exposure amount) if the transitional provisions of IFRS 9 or similar ECL had not been applied | 14.15% | 14.03% | 14.05% | 14.55% | 14.61% |
| Tier 1 (T1) capital (as a percentage of the exposure amount) if the transitional treatment of unrealized gains and losses measured at fair value through OCI (other comprehensive income) had not been applied | |||||
| Total capital (as a percentage of the amount of the exposure) | 15.98% | 16.07% | 16.21% | 16.82% | 17.24% |
| Total capital (as a percentage of the amount of the exposure) if the transitional provisions of IFRS 9 or similar ECL had not been applied | 15.94% | 15.96% | 16.11% | 16.71% | 17.07% |
| Total capital (as a percentage of the amount of the risk exposure) if the transitional treatment of unrealized gains and losses measured at fair value through OCI (other comprehensive income) had not been applied | |||||
| Leverage ratio | |||||
| Measurement of total exposure corresponding to the leverage ratio (million euros) | 737,990 | 765,452 | 752,016 | 687,992 | 671,789 |
| Leverage ratio | 6.49% | 6.31% | 6.23% | 6.74% | 6.80% |
| Leverage ratio if the transitional provisions of IFRS 9 or similar ECL had not been applied | 6.46% | 6.26% | 6.18% | 6.69% | 6.69% |
| Leverage ratio if the transitional treatment of unrealized gains and losses measured at fair value through OCI (other comprehensive income) had not been applied |
Own Funds requirements by risk type
The BBVA Group has a general risk management and control model (hereinafter, the “Model”) that is appropriate for its business model, its organisation, the countries where it operates and its corporate governance system. This model allows the Group to carry out its activity within the risk management and control strategy and policy defined by the corporate bodies of BBVA and to adapt itself to a changing economic and regulatory environment, facing this management at a global level and aligned to the circumstances at all times. The Model establishes a suitable risk management system related to the risk profile and strategy of the entity.
Total risk-weighted assets are shown below, broken down by type of risk (where credit risk includes counterparty risk) as of December 31, 2022 and December 31, 2021:
DISTRIBUTION OF RWAs BY RISK TYPE ELIGIBLE ON PILLAR 1
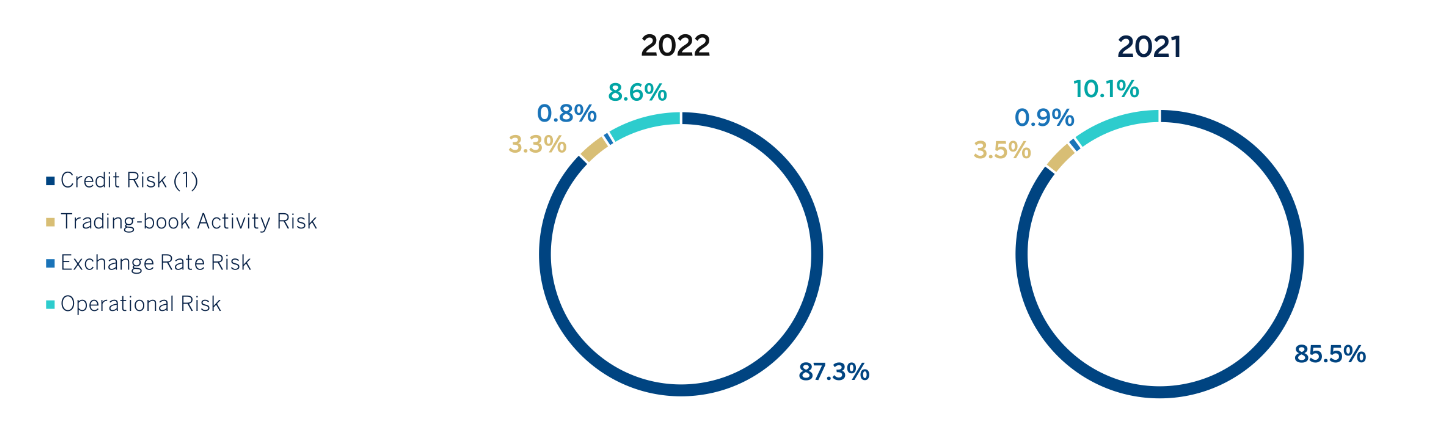
(1) Credit Risk includes Risk for CVA adjustment and the prudential advance for the impacts of the TRIM and other regulatory/supervisory impacts.
The following table shows the total capital requirements broken down by risk type as of quarter-end from December 31, 2021 to December 31, 2022:
EU OV1 - OVERVIEW OF RWAs (MILLION EUROS)
| RWEAs (1) | Minimum Capital Requirements (2)(3) | |||||
|---|---|---|---|---|---|---|
| 12-31-2022 | 09-30-2022 | 06-30-2022 | 03-31-2022 | 12-31-2021 | 12-31-2022 | |
| Credit risk (excluding CCR)(4)(5) | 285,362 | 278,942 | 270,369 | 257,856 | 247,299 | 22,829 |
| Of which the standardised approach (6) | 143,612 | 150,696 | 144,373 | 135,061 | 129,741 | 11,489 |
| Of which the Foundation IRB (F-IRB) approach | — | — | — | — | — | — |
| Of which: slotting approach | 5,177 | 5,541 | 4,928 | 4,718 | 4,498 | 414 |
| Of which equity IRB under the simple risk-weighted approach (7) | 2,570 | 2,600 | 2,307 | 2,418 | 2,442 | 206 |
| Of which the Advanced IRB (A-IRB) approach (8) | 102,547 | 104,095 | 102,013 | 100,760 | 97,614 | 8,204 |
| Counterparty credit risk - CCR | 11,232 | 13,436 | 11,646 | 11,115 | 13,870 | 899 |
| Of which the standardised approach (8) | 6,725 | 8,908 | 8,023 | 7,791 | 9,661 | 538 |
| Of which internal model method (IMM) | — | — | — | — | — | — |
| Of which exposures to a CCP (9) | 702 | 551 | 223 | 154 | 156 | 56 |
| Of which credit valuation adjustment - CVA | 1,741 | 2,461 | 2,072 | 1,932 | 2,518 | 139 |
| Of which other CCR | 2,063 | 1,516 | 1,328 | 1,238 | 1,535 | 165 |
| Settlement risk | — | — | — | — | — | — |
| Securitisation exposures in the non-trading book (after the cap)(10) | 455 | 326 | 364 | 296 | 325 | 36 |
| Of which internal assessment approach (SEC-IRBA) | 438 | 271 | 345 | 274 | 300 | 35 |
| Of which external assessment approach (SEC-ERBA) | 17 | 17 | 20 | 22 | 25 | 1 |
| Of which standardised approach (SEC-SA) | — | 37 | — | — | — | — |
| Of which 1250%/ deduction (10) | — | — | — | — | — | — |
| Market Risk | 12,969 | 15,568 | 15,751 | 14,867 | 14,712 | 1,037 |
| Of which the standardised approach (SA) | 4,716 | 5,439 | 5,884 | 5,580 | 4,445 | 377 |
| Of which IMA | 8,252 | 10,129 | 9,866 | 9,287 | 10,267 | 660 |
| Large exposures | — | — | — | — | — | — |
| Operational risk | 27,049 | 33,407 | 32,742 | 32,227 | 31,589 | 2,164 |
| Of which basic indicator approach | 946 | 690 | 699 | 719 | 748 | 76 |
| Of which standardised approach | 26,103 | 32,717 | 32,043 | 31,508 | 30,841 | 2,088 |
| Of which advanced measurement approach | — | — | — | — | — | — |
| Amounts below the thresholds for deduction (subject to 250% risk weight) (11) | 16,268 | 16,319 | 15,827 | 15,442 | 15,112 | 1,301 |
| Total | 337,066 | 341,678 | 330,871 | 316,361 | 307,795 | 26,965 |
- (1) Risk-weighted assets according to the phased-in period.
- (2) Considering the minimum total capital requirement of 8% (Article 92 of the CRR).
- (3) Under the total capital requirement ratio after the supervisory review process (SREP), the total capital requirement ratio amounts to 12.79% (€43,111 million as of the reporting date).
- (4) Including amounts below the deduction thresholds subject to 250% weighting (DTAs rise to €8,472 million and significant investments in financial sector entities and insurance companies amounting to €7,796 million).
- (5) Excluding deferred tax assets arising from temporary differences subject to 250% risk weighting in accordance with Article 48.4 CRR. This amount is €8,472 million as of december 31, 2022.
- (6) It only includes equity exposures under the simple method of IRB approach.
- (7) It only includes credit risk exposures under the advanced internal ratings-based approach (AIRB).
- (8) It only includes SA-CCR for derivatives.
- (9) This row includes the total RWAs corresponding to exposures with central counterparties (CCPs), both qualified and non-qualified, among which are also the initial margins.
- (10) The BBVA Group deducts from capital those securitisations meeting the deduction requirements, so it does not apply a weight of 1,250% to these exposures. In this row, the value of €11 million that would result from applying this weight to the exposures deducted is not included.
- (11) The information in this row is disclosed for information purposes only, as the amount included here is also included in row 1, where institutions are requested to disclose information on credit risk. As a consequence, this row should not be taken into account when calculating the total indicated at the bottom of the table.
During 2022, risk-weighted assets grew by approximately €30 billion euros, mainly due to the dynamism of lending activity throughout the Group. Of particular note were Turkey and South America, where the Group applies standardised approach. The above growth is partly reduced by the evolution of counterparty credit risk, as well as market risk, in line with the lower volatility observed. Finally, the Group recorded a net impact of supervisory effects and model updates in the calculation of operational risk of approximately €8.2 billion, which had an impact on the Group's CET1 ratio of approximately -30 basis points.
The evolution of RWAs by type of risk is explained in more detail in the respective sections of the report.
The following table is a breakdown of risk-weighted assets and capital requirements broken down by risk type and exposure categories as of December 31, 2022, September 30, 2022 and December 31, 2021:
Capital requirements by risk type and exposure class (Million Euros)
| Capital requirements(2) | RWA's(1) | |||||
|---|---|---|---|---|---|---|
| Exposure Class and risk type | 12-31-2022 | 9-30-2022 | 12-31-2021 | 12-31-2022 | 9-30-2022 | 12-31-2021 |
| Credit Risk | 11,779 | 12,366 | 10,853 | 147,240 | 154,576 | 135,660 |
| Central governments or central banks | 2,500 | 2,556 | 2,521 | 31,254 | 31,948 | 31,511 |
| Regional governments or local authorities | 107 | 96 | 95 | 1,335 | 1,194 | 1,189 |
| Public sector entities | 80 | 73 | 70 | 1,002 | 917 | 876 |
| Multilateral development banks | — | — | — | 6 | 6 | 6 |
| International organisations | — | — | — | — | — | — |
| Institutions | 393 | 544 | 566 | 4,916 | 6,805 | 7,073 |
| Corporates | 3,660 | 3,935 | 3,177 | 45,746 | 49,185 | 39,710 |
| Retail | 2,910 | 2,901 | 2,282 | 36,379 | 36,262 | 28,520 |
| Secured by mortgages on immovable property | 790 | 827 | 691 | 9,871 | 10,332 | 8,637 |
| Exposures in default | 215 | 233 | 280 | 2,691 | 2,913 | 3,495 |
| Exposures associated with particularly high risk | 225 | 241 | 292 | 2,809 | 3,007 | 3,654 |
| Covered bonds | — | — | — | — | — | — |
| Claims on institutions and corporates with a short-term credit assessment | — | 2 | — | — | 24 | — |
| Collective investments undertakings | — | — | — | 1 | 1 | 1 |
| Equity exposures | — | — | — | — | — | — |
| Other exposures | 898 | 959 | 879 | 11,230 | 11,982 | 10,987 |
| Total credit risk by standardised approach | 11,779 | 12,366 | 10,853 | 147,240 | 154,576 | 135,660 |
| Credit Risk | 9,075 | 9,316 | 8,599 | 113,432 | 116,453 | 107,492 |
| Central governments or central banks | 88 | 101 | 79 | 1,105 | 1,266 | 983 |
| Institutions | 587 | 662 | 578 | 7,336 | 8,278 | 7,228 |
| Corporates | 6,441 | 6,631 | 6,044 | 80,508 | 82,892 | 75,554 |
| Of which: SMEs | 1,032 | 1,058 | 1,202 | 12,896 | 13,224 | 15,023 |
| Of which: Specialised lending | 424 | 454 | 414 | 5,306 | 5,677 | 5,173 |
| Of which: Others | 4,985 | 5,119 | 4,429 | 62,307 | 63,991 | 55,359 |
| Retail | 1,959 | 1,921 | 1,898 | 24,483 | 24,017 | 23,727 |
| Of which: Secured by mortgages on immovable property (SME) | 86 | 87 | 108 | 1,078 | 1,091 | 1,346 |
| Of which: Secured by mortgages on immovable property (non SME) | 713 | 711 | 774 | 8,916 | 8,888 | 9,681 |
| Of which: Qualifying revolving | 709 | 696 | 523 | 8,868 | 8,699 | 6,541 |
| Of which: Other SMEs | 93 | 90 | 122 | 1,158 | 1,120 | 1,520 |
| Of which: Other Non-SMEs | 357 | 337 | 371 | 4,463 | 4,218 | 4,639 |
| Equity | 1,048 | 1,053 | 1,059 | 13,097 | 13,160 | 13,235 |
| Simple risk weight approach | 206 | 208 | 195 | 2,570 | 2,600 | 2,442 |
| Exposures in sufficiently diversified portfolios (RW 190%) | 120 | 117 | 108 | 1,500 | 1,465 | 1,351 |
| Exchange traded exposures (RW 290%) | 44 | 49 | 56 | 551 | 612 | 702 |
| Others (RW 370%) | 42 | 42 | 31 | 519 | 523 | 389 |
| PD/LGD approach | 180 | 180 | 205 | 2,250 | 2,248 | 2,559 |
| Internal models approach | 38 | 23 | 35 | 481 | 289 | 433 |
| Exposures subject to a 250% risk weight | 624 | 642 | 624 | 7,796 | 8,022 | 7,800 |
| Total credit risk by IRB approach | 10,122 | 10,369 | 9,658 | 126,529 | 129,612 | 120,727 |
| Total contributions to the default fund of a CCP | 12 | 22 | 4 | 154 | 279 | 54 |
| Securitisation exposures | 36 | 26 | 26 | 455 | 326 | 325 |
| Total credit risk | 21,950 | 22,783 | 20,541 | 274,378 | 284,793 | 256,766 |
| Settlement risk | — | — | — | — | — | — |
| Standardised approach: | 377 | 435 | 191 | 4,716 | 5,439 | 4,445 |
| Of which: Fixed income price risk | 167 | 189 | 113 | 2,088 | 2,358 | 1,971 |
| Of which: Equity market risk | 1 | 2 | 1 | 16 | 21 | 11 |
| Of which: Price risk in CIUs | 18 | 21 | 44 | 230 | 261 | 341 |
| Of which: Foreign exchange | 191 | 218 | 28 | 2,383 | 2,731 | 2,059 |
| Of which: Commodities risk | — | 5 | 5 | — | 68 | 63 |
| IMA: Market Risk | 660 | 810 | 821 | 8,252 | 10,129 | 10,267 |
| Total trading book risk | 1,037 | 1,245 | 1,012 | 12,969 | 15,568 | 14,712 |
| CVA risk | 139 | 197 | 201 | 1,741 | 2,461 | 2,518 |
| Operational risk | 2,164 | 2,673 | 2,527 | 27,049 | 33,407 | 31,589 |
| Others (3) | 1,674 | 436 | 177 | 20,929 | 5,450 | 2,211 |
| Capital requirements | 26,965 | 27,334 | 24,624 | 337,066 | 341,678 | 307,795 |
(1) Risk-weighted assets for the transitional period (phased-in).
(2) Calculated on the minimum total capital requirements of 8% (Article 92 of the CRR).
(3) This line includes capital consumptions that the Group incorporates to reflect a more conservative treatment of certain elements in accordance with article 3 CRR.
For more details, see section 3 of the report.