
Executive Summary
The strength of the BBVA Group's earnings has contributed to achieving a consolidated fully loaded CET1 ratio of 12.61% as of December 31, 2022, which allows it to maintain a large management buffer over the Group's CET1 requirement (8.63%), which is also above the Group's target management range of 11.5-12.0% CET1.
The Group's CET1 incorporates the effects of the corporate transactions carried out during the year, which had a combined impact of -38 basis points. Excluding these elements, the fully loaded CET1 ratio increased by 24 basis points, mainly explained by the generation of earnings in the year (+214 basis points) which, net of shareholder remuneration and payment of convertible contingent instrument coupons (CoCos), generated a positive contribution of +106 basis points. Meanwhile, the growth in risk-weighted assets (RWAs) derived from the organic growth of the business in constant terms has drained 101 basis points. Finally, the other elements that make up CET1 had a positive contribution of +19 basis points; these include the effects of market evolution, the calculation of minority interests, regulatory impacts as well as the compensation in equity of the negative effect on results due to the loss in value of the net monetary position in hyperinflationary economies.
Following the latest SREP (Supervisory Review and Evaluation Process) decision, the ECB has informed the Group that, effective January 1, 2023, it must maintain at consolidated level a total capital ratio of 13.00% and a CET1 capital ratio of 8.75%, including a Pillar 2 requirement at consolidated level of 1.71% (a minimum of 0.96% must be satisfied with CET1), of which 0.21% (0.12% to be met by CET1) is determined on the basis of the ECB's prudential provisioning expectations, which as of January 1, 2023 will no longer be treated as a deduction from CET1 with a positive effect of 19 basis points on fully-loaded CET1 at the end of December 2022, which would be equivalent to a pro-forma ratio of 12.80%.
The evolution of the CET1 fully-loaded ratio through 2022 is presented below:
Annual evolution of the CET1 fully loaded ratio
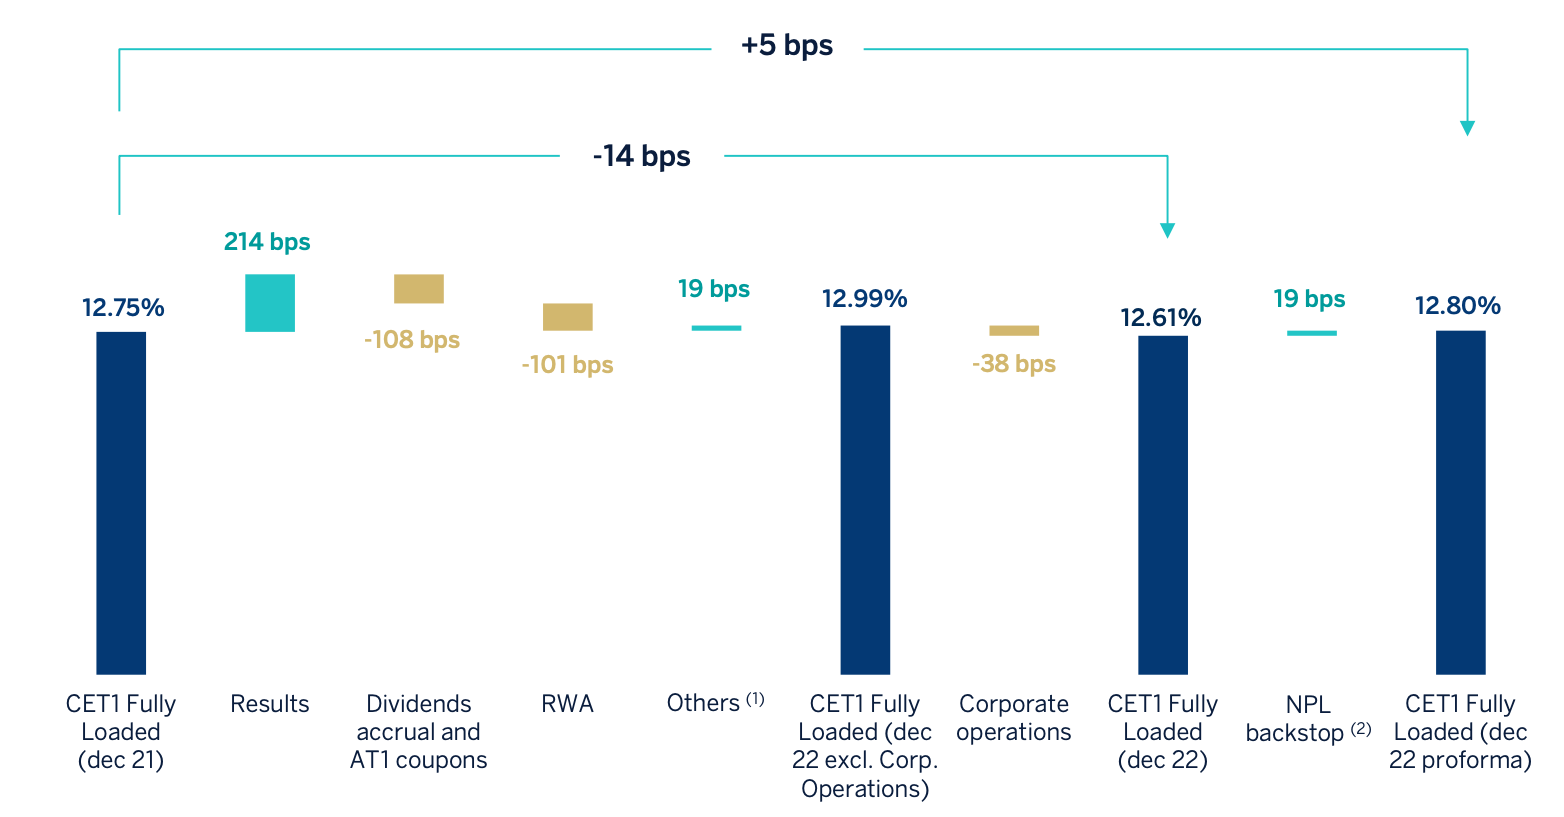
(1) Includes, among others, minority interests, market related impacts, regulatory impacts and the credit in OCIs that offsets the debit in P&L due to the hyperinflation accounting.
(2) Includes the reversal of the NPL backstop deduction (+19 bps) in January 2023. From that time the SREP Requirement is 8.72% for BBVA Group.
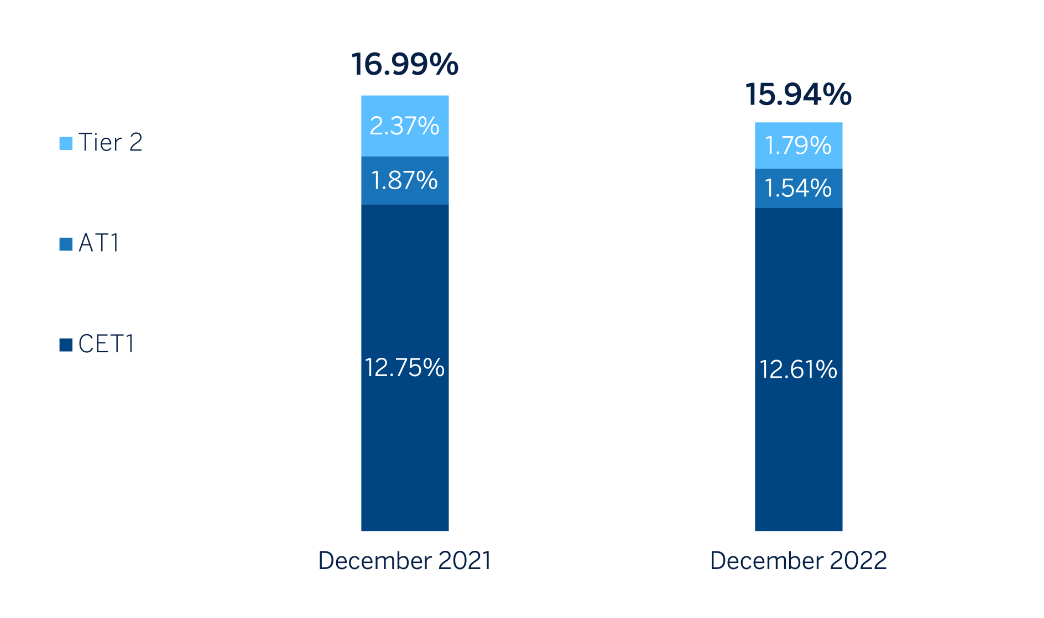
Consolidated fully loaded Additional Tier 1 (AT1) capital fully loaded stood at 1.54% at December 31, 2022, 34 basis points lower than in 2021, mainly due to the early redemption of an issue of AT1 instruments for 500 million dating back to 2017.
The Tier 2 fully loaded ratio stood at 1.79% which represents a reduction of -58 basis points compared to 2021, mainly explained by the effect of increased RWAs during the year and the lower computability of internal credit model provisions.
The composition of the fully loaded total capital ratio as of December 31, 2021 and December 31, 2022 is shown below:
Composition of the fully loaded total capital ratio
With respect to phased-in ratios, the main difference with respect to fully loaded ratios is due to the impact associated with the transitional adjustments associated with IFRS9.
The BBVA Group maintains a solid liquidity position in every geographical area in which it operates, with ratios well above the minimum required:
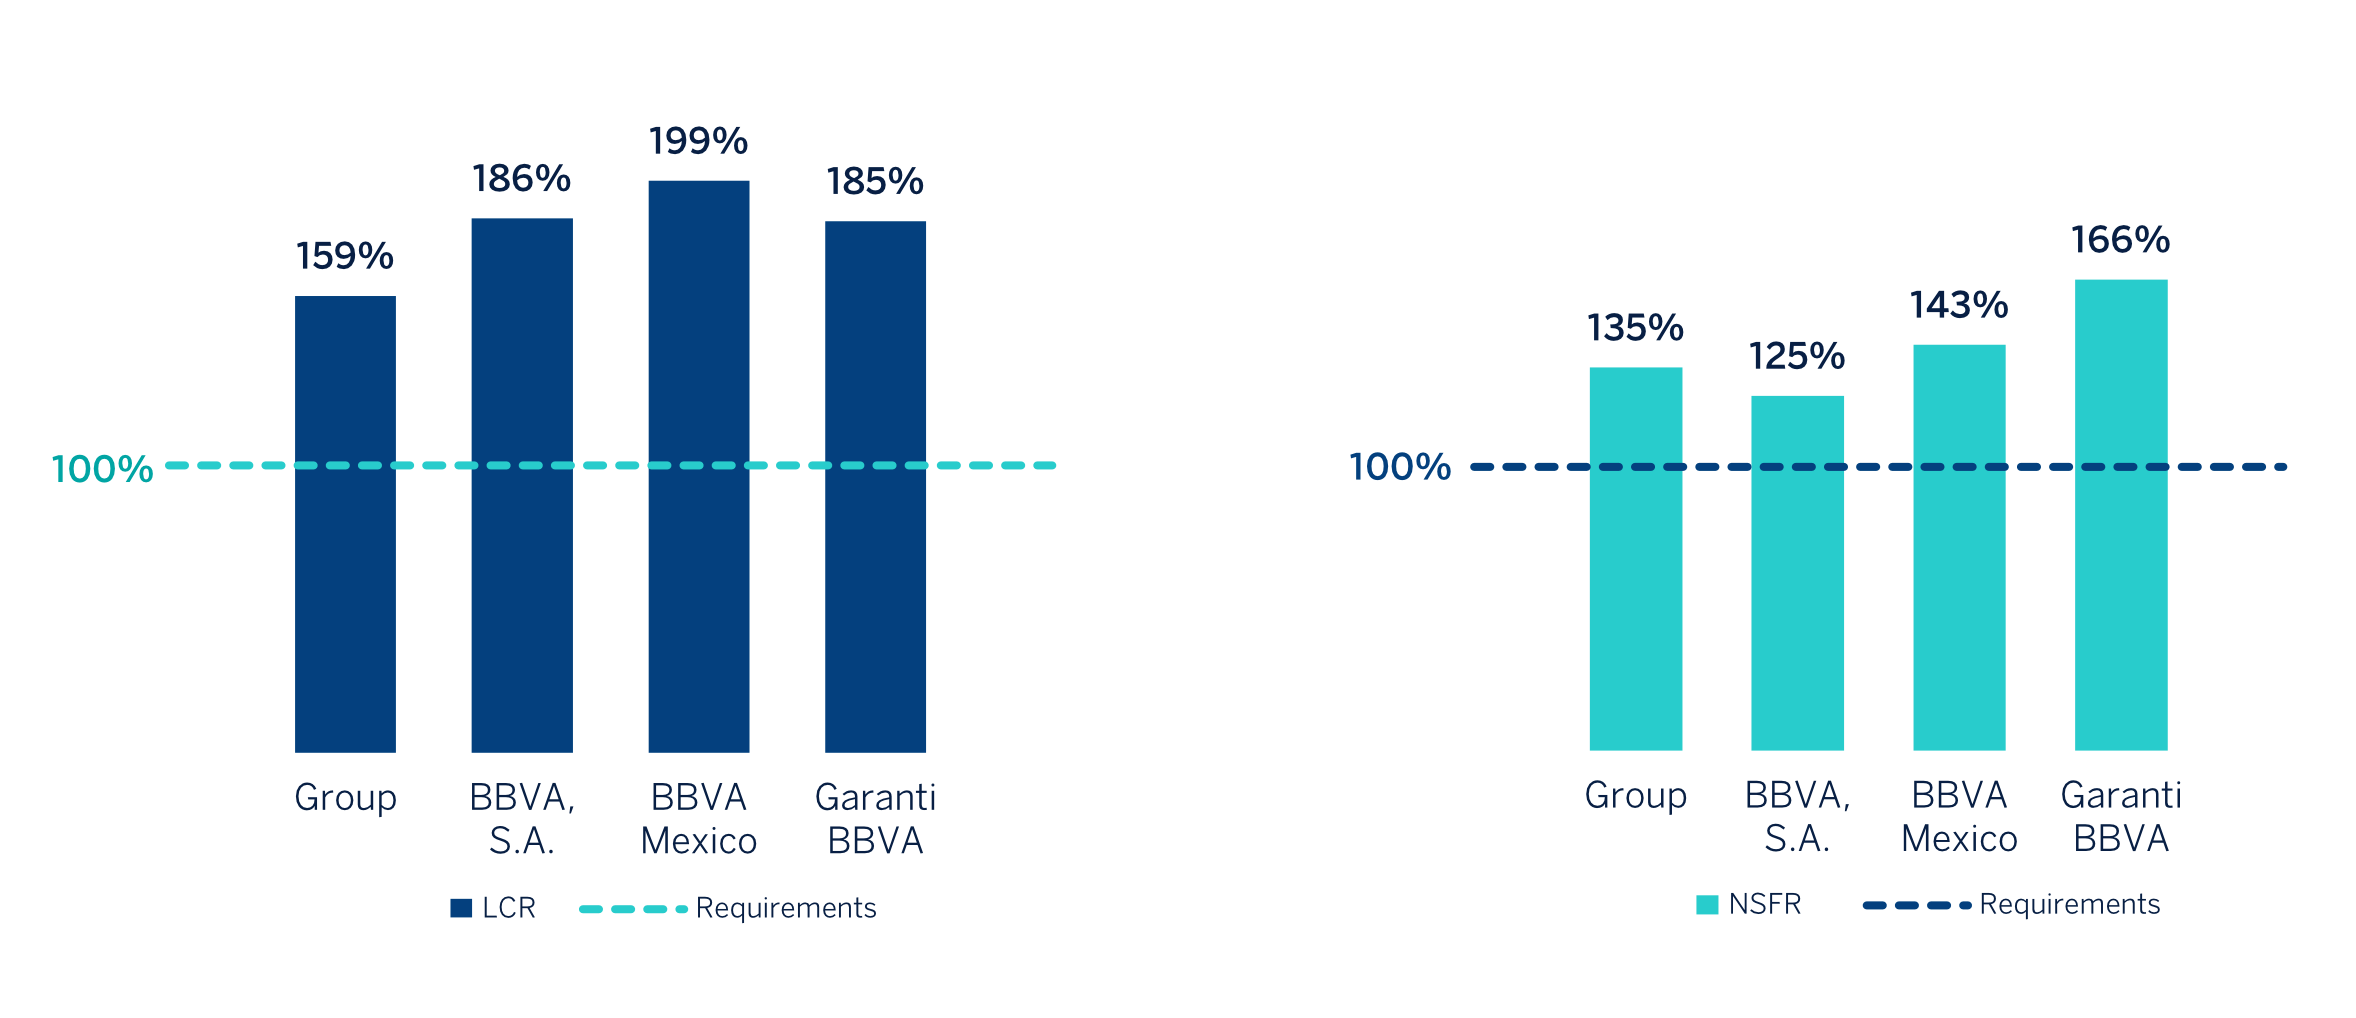
- The BBVA Group's liquidity coverage ratio (LCR) remained comfortably above 100% throughout the year 2022, and stood at 159% as of December 31, 2022. For the calculation of this ratio, it is assumed that there is no transfer of liquidity among subsidiaries; i.e. no type of excess liquidity levels in foreign subsidiaries is being considered in the calculation of the consolidated ratio. When considering these excess liquidity levels, the BBVA Group's LCR would stand at 201%.
- The net stable funding ratio (NSFR), defined as the result between the amount of stable funding available and the amount of stable funding required, demands banks to maintain a stable funding profile in relation to the composition of their assets and off-balance sheet activities. This ratio should be at least 100% at all times.
The BBVA Group's NSFR ratio, stood at 135% as of December 31, 2022.
The breakdown of these ratios in the main geographical areas in which the Group operates is shown below:
Liquidity ratios by LMU
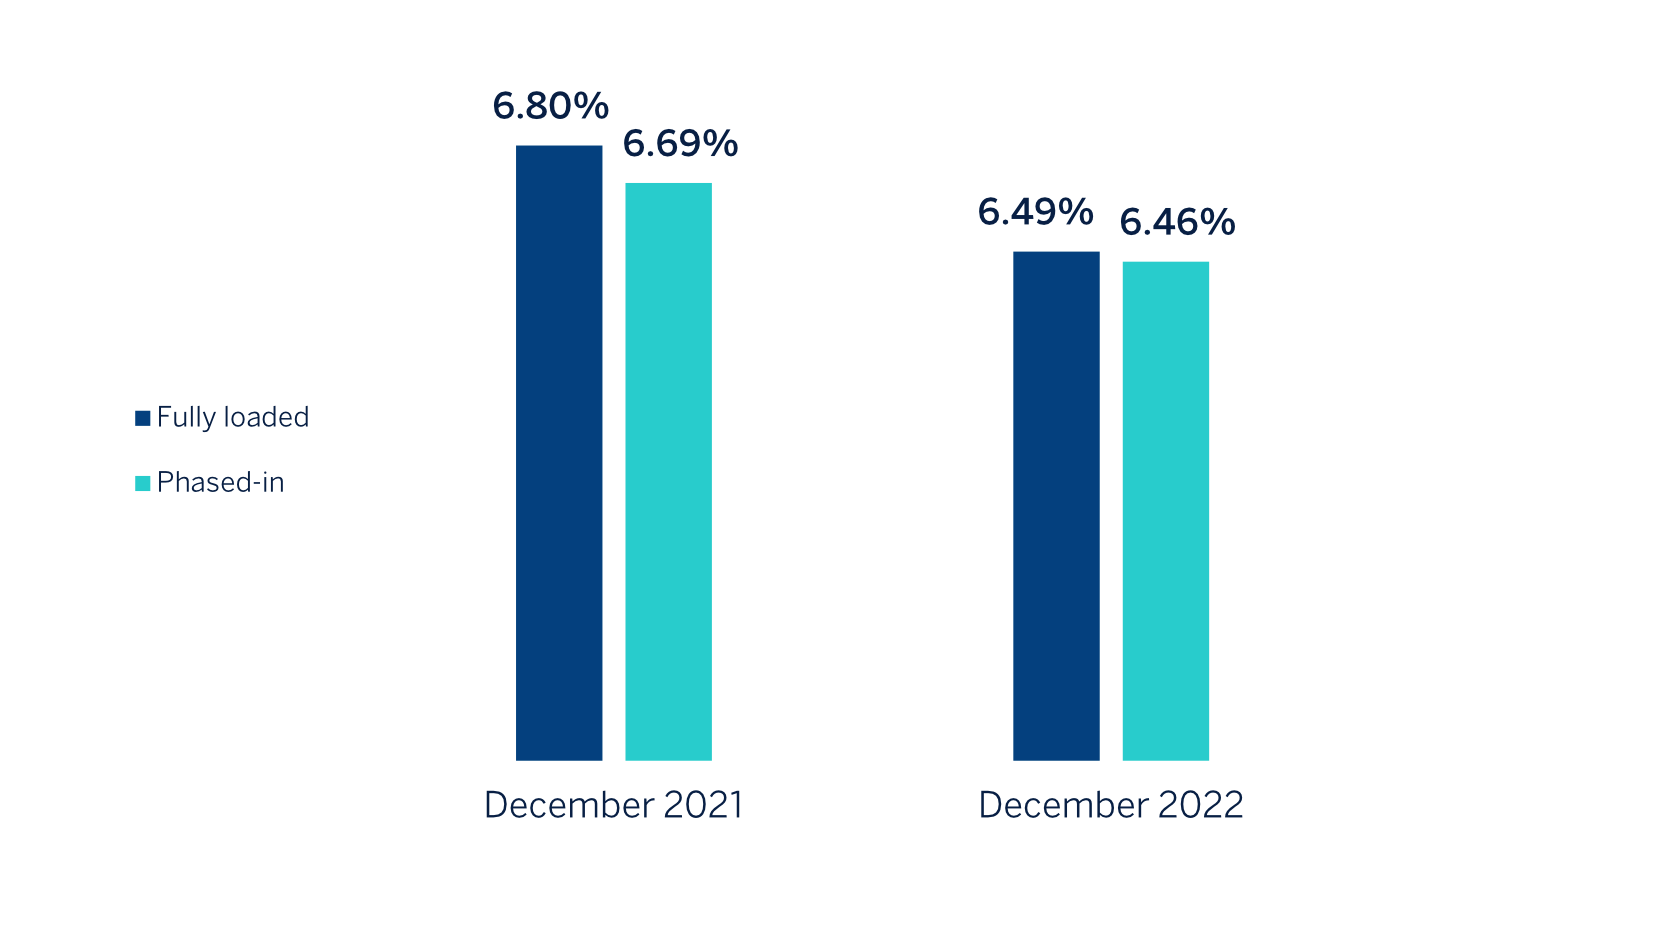
As for the leverage ratio, as of December 31, 2022, the fully loaded ratio stood at 6.46 % (phased in at 6.49 %), above the minimum required ratio of 3.00 %.
The fully loaded and phased in ratios as of December 31, 2021 and December 31, 2022 are shown below:
Fully loaded and phased-in leverage ratio
The following table shows the main regulatory metrics in accordance with Article 447 of the CRR:
EU KM1 - Key metrics
| 12-31-2022 | 9-30-2022 | 6-30-2022 | 3-31-2022 | 12-31-2021 | |
|---|---|---|---|---|---|
| Available own funds (amounts) | |||||
| Common Equity Tier 1 (CET1) capital | 42,738 | 42,876 | 41,563 | 40,537 | 39,943 |
| Tier 1 capital | 47,931 | 48,281 | 46,828 | 46,364 | 45,686 |
| Total capital | 53,861 | 54,895 | 53,647 | 53,203 | 53,069 |
| Risk-weighted exposure amount | |||||
| Total risk-weighted exposure amount | 337,066 | 341,678 | 330,871 | 316,361 | 307,795 |
| Capital ratios (as a percentage of risk-weighted exposure amount) | |||||
| Common Equity Tier 1 ratio (%) | 12.68% | 12.55% | 12.56% | 12.81% | 12.98% |
| Tier 1 ratio (%) | 14.22% | 14.13% | 14.15% | 14.66% | 14.84% |
| Total capital ratio (%) | 15.98% | 16.07% | 16.21% | 16.82% | 17.24% |
| Additional own funds requirements to address risks other than the risk of excessive leverage (as a percentage of risk-weighted exposure amount) | |||||
| Additional own funds requirements to address risks other than the risk of excessive leverage (%) | 1.50% | 1.50% | 1.50% | 1.50% | 1.50% |
| of which: to be made up of CET1 capital (percentage points) | 0.84% | 0.84% | 0.84% | 0.84% | 0.84% |
| of which: to be made up of Tier 1 capital (percentage points) | 1.13% | 1.13% | 1.13% | 1.13% | 1.13% |
| Total SREP own funds requirements (%) | 9.50% | 9.50% | 9.50% | 9.50% | 9.50% |
| Combined buffer requirement (as a percentage of risk-weighted exposure amount) | |||||
| Capital conservation buffer (%) | 2.50% | 2.50% | 2.50% | 2.50% | 2.50% |
| Conservation buffer due to macro-prudential or systemic risk identified at the level of a Member State (%) | — | — | — | — | — |
| Institution specific countercyclical capital buffer (%) | 0.04% | 0.01% | 0.01% | 0.01% | 0.01% |
| Systemic risk buffer (%) | — | — | — | — | — |
| Global Systemically Important Institution buffer (%) | — | — | — | — | — |
| Other Systemically Important Institution buffer | 0.75% | 0.75% | 0.75% | 0.75% | 0.75% |
| Combined buffer requirement (%) | 3.29% | 3.26% | 3.26% | 3.26% | 3.26% |
| Overall capital requirements (%) | 12.79% | 12.76% | 12.76% | 12.76% | 12.76% |
| CET1 available after meeting the total SREP own funds requirements (%) | 6.48% | 6.57% | 7.22% | 7.47% | 7.64% |
| Leverage ratio | |||||
| Total exposure measure | 737,990 | 765,452 | 752,016 | 687,992 | 671,789 |
| Leverage ratio (%) | 6.49% | 6.31% | 6.23% | 6.74% | 6.80% |
| Additional own funds requirements to address the risk of excessive leverage (as a percentage of total exposure measure) | |||||
| Additional own funds requirements to address the risk of excessive leverage (%) | — | — | — | — | — |
| of which: to be made up of CET1 capital (percentage points) | — | — | — | — | — |
| Total SREP leverage ratio requirements (%) | 3.00% | 3.00% | 3.00% | 3.06% | 3.06% |
| Leverage ratio buffer and overall leverage ratio requirement (as a percentage of total exposure measure) | |||||
| Leverage ratio buffer requirement (%) | — | — | — | — | — |
| Overall leverage ratio requirements (%) | 3.00% | 3.00% | 3.00% | 3.06% | 3.06% |
| Liquidity Coverage Ratio(1) | |||||
| Total high-quality liquid assets (HQLA) (Weighted value) | 108,648 | 105,293 | 104,585 | 106,449 | 110,132 |
| Cash outflows - Total weighted value | 97,796 | 93,032 | 89,833 | 89,459 | 91,541 |
| Cash inflows - Total weighted value | 31,352 | 29,211 | 26,999 | 26,169 | 24,709 |
| Total net cash outflows (adjusted value) | 66,443 | 63,822 | 62,833 | 63,289 | 66,833 |
| Liquidity coverage ratio (%) | 163.70% | 165.30% | 166.80% | 168.60% | 165.80% |
| Net Stable Funding Ratio | |||||
| Total available stable funding | 425,240 | 435,473 | 431,382 | 432,723 | 430,759 |
| Total required stable funding | 315,094 | 324,694 | 321,719 | 320,367 | 319,017 |
| NSFR ratio (%) | 134.96% | 134.12% | 134.09% | 135.07% | 135.03% |
(1) The EBA "mapping tool" links the LCR information to the regulatory models C72, C73, C74 and C76, which show end-of-quarter point-in-time values. However, article 447(f) of Regulation 575/2013 (CRR) establishes that the information related to the LCR and its components should be disclosed as the average of the preceding 12 months’ values and not as point-in-time. As a consequence, this information is not based on the EBA "mapping tool" but on table 78 (EU LIQ1)
The following sections detail matters relating to the Group's solvency. These are supplemented by information included in the Group's Consolidated Financial Statements and Management Report as of year 2022, which also contain the Group's main activity and profitability indicators.