The BBVA share
The BBVA share closed June at €6.07, a fall of 14.6% over the first half of the year.
Global economic growth may have slowed slightly in the second quarter of 2018. Although the pace of expansion remains robust, it is geographically less uniforme, with acceleration in the United States contrasting with certain signs of moderation in China, some emerging economies, and even more strongly in Europe. For now, the economic situation remains positive. The main risk is protectionism, since although the direct effect on global growth of the measures taken could be limited, the indirect impact of lower confidence and higher financial volatility could be felt in the second half of the year and increase uncertainty.
Most stock-market indices posted losses in the first half of the year. However, in Europe, the declines of the first quarter have eased: the Stoxx 50 and the Euro Stoxx 50 fell by 4.2% and 3.1%, respectively, year-to-date; while in Spain, the Ibex 35 lost 4.2% over the same period. In contrast, in the United States the S&P 500 index gained 1.7% in the last six months.
BBVA share evolution
Compared with European indices (Base indice 100=30-06-2017)

Shareholder remuneration for 2018 is governed by the shareholder remuneration policy announced by publication of a Significant Event on February 1, 2017. Subject to the approval from the corresponding corporate bodies, BBVA plans to make a cash dividend payment in October 2018 and April 2019.
Shareholder remuneration
(Euros-gross/share)

Group information
Results
- Generalized growth in more recurrent revenue in practically all geographic areas.
- Operating expenses remain under control, leading to an improvement in the efficiency ratio.
- Lower amount of impairment on financial assets not measured at fair value through profit or loss (hereinafter, "impairment losses on financial assets").
- As a result, the net attributable profit was €2,649m, 14.9% higher than the first half of 2017.
Net attributable profit (Million euros)

Net attributable profit breakdown(1) (Percentage. 1H 2018)

(1) Excludes the Corporate Center.
(2) Includes the areas Banking activity in Spain and Non Core Real Estate.
Balance sheet and business activity
- Loans and advances to customers (gross) increase in emerging geographies and the United States, but decline in Spain.
- Non-performing loans continue to improve.
- Within the off-balance-sheet funds, mutual funds continue to perform positively.
Solvency
- The capital position is above regulatory requirements.
- BBVA has received a communication from the Bank of Spain regarding its minimum requirement for own funds and eligible liabilities (MREL requirement), as determined by the Single Resolution Board (SRB). The Group estimates that it currently meets this MREL requirement.
- Issuance of the so-called green bonds for €1 billion (senior non-preferred debt).
Capital and leverage ratios (Percentage as of 30-06-2018)

(1) Data pro-forma includes + 55 basis point of impacts from announced corporate transactions (sale of real-estate assets to Cerberus and BBVA Chile, closed in July).
Risk management
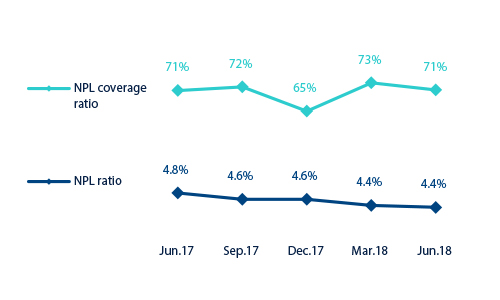
- Good performance of the main credit-risk metrics over the first six months of the year: as of 30-June-2018, the NPL ratio closed at 4.4%, the NPL coverage ratio at 71% and the cumulative cost of risk at 0.82%.
NPL and NPL coverage ratios (Percentage)
Transformation
- The Group's digital and mobile customer base and digital sales continue to increase in all the geographic areas where BBVA operates.
Digital and mobile customers (Millions)

Other matters of interest
- On July 6, BBVA has completed the sale of approximately 68.2% of its stake in BBVA Chile. The impacts of this transaction will be reflected in the Group's financial statements for the third quarter of 2018.
Impact of the initial implementation of IFRS 9
- The figures corresponding to the first half of 2018 are prepared under International Financial Reporting Standard 9 (IFRS 9), which entered into force on January 1, 2018. This new accounting standard does not require the comparative information from prior periods, so the comparative figures shown for the year 2017 have been prepared in accordance with the IAS 39 (International Accounting Standard 39) regulation in force at that time.
- The impacts derived from the first application of IFRS 9, as of January 1, 2018, have been registered with a charge to reserves of approximately €900m mainly due to the allocation of provisions based on expected losses, compared to the model of losses incurred under the previous IAS 39.
- In capital, the impact derived from the first application of IFRS 9 has been a reduction of 31 basis points with respect to the fully-loaded CET1 ratio of December 2017.
- With respect to the main risk metrics, the exposure to non-performing loans hardly changed, lending fell due to reclassification of portfolios and the NPL coverage ratio rose as a result of the increase in loan-loss provisions.
Results
- Generalized sustained growth in more recurrent revenue in practically all geographic areas.
- Operating expenses remain under control, leading to an improvement in the efficiency ratio.
- Lower sums of impairment on financial assets not measured at fair value through profit or loss (hereinafter, "impairment losses on financial assets").
- As a result, the net attributable profit was €2,649m, 14.9% higher than the first half of 2017.
Net attributable profit (Million euros)
Net attributable profit breakdown(1) (Percentage. 1H 2018)
(1) Excludes the Corporate Center.
(2) Includes the areas Banking activity in Spain and Non Core Real Estate.
Banking activity in Spain
Highlights
- Positive trend in lending activity over the quarter.
- Favorable performance of more recurrent revenue.
- Improvement of efficiency due to the steady reduction of expenses.
- Lower impairments and provisions, solid asset-quality indicators.
Spain
Gross income. Year-on-year changes.
€3,050 m
-4.7%

Non Core Real Estate
Highlights
- Continued positive trend in the Spanish real-estate market, although with a more moderate growth rate.
- Agreement with Cerberus that will eliminate net real-estate exposure almost entirely, with its closure estimated for the second half of 2018.
- Significant reduction in exposure and losses in the area.
Spain
Gross income. Year-on-year changes.
-€19 m
+200,8%

The United States
Highlights
- Lending growth supported by consumer and business financing.
- Positive performance of net interest income and provisions.
- Improvement in efficiency.
- Net attributable profit positively affected by the tax reform at the end of 2017.
The United States
Gross income. Year-on-year changes, at constant exchange rate.
€1,437 m
+10.7%

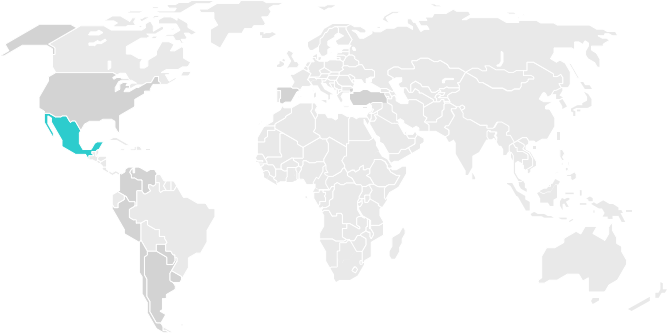
Mexico
Highlights
- In activity, solid growth of the wholesale portfolio.
- Expenses continue to grow below the rate of gross income.
- Double-digit year-on-year growth in net attributable profit.
- Good asset quality indicators.
Mexico
Gross income. Year-on-year changes, at constant exchange rate.
€3,465 m
+7.7%
Turkey
Highlights
- Dynamic activity.
- Solid growth of recurring revenue items.
- Control of operating expenses, with growth below the level of inflation and the area’s gross income.
- Risk indicators affected by the one-off impairment of the wholesale portfolio and the update of the macroeconomic scenario.
Turkey
Gross income. Year-on-year changes, at constant exchange rate.
€1,924 m
+21.2%

South America
Highlights
- Activity continues to grow at a good pace.
- Positive performance of all the lines on the income statement.
- Expenses grow at a rate below the increase in gross income.
- Good asset quality indicators.
South America
Gross income. Year-on-year changes At constant exchange rates.
€2,197 m
+14.3%

Rest of Eurasia
Highlights
- Positive trend in lending activity.
- Performance of deposits strongly influenced by the environment of negative interest rates.
- Earnings affected by decrease in revenues.
- Good performance of the NPL and NPL coverage ratios.
Rest of Eurasia
Gross income. Year-on-year changes.
€216 m
-15.8%

Contact
 Shareholder attention line
902 200 902
912 24 98 21
 Subscription service
  Shareholder Office
 Contact email