Banking activity in Spain
Highlights
- Deleveraging and increase in more liquid resources and off-balance-sheet continue.
- Good performance of net fees and commissions.
- Reduction of operating expenses.
- Solid asset-quality indicators.
Business activity (1)
(Year-on-year change. Data as of 31-12-2017)

(1) Excluding repos.
Net interest income/ATAs
(Percentage)

Operating income (Million euros)

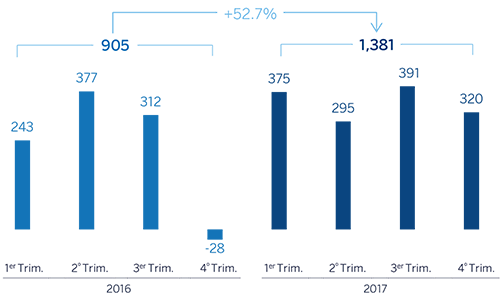
Net attributable profit (Million euros)
Breakdown of performing loans under management (1)
(31-12-2017)

Breakdown of customer funds under management (1)
(31-12-2017)

(1) Excluding repos.
(1) Excluding repos.
Macro and industry trends
According to the latest information from the National Institute of Statistics (INE, according to the acronym in Spanish) the Spanish economy once more registered quarterly growth of 0.8% in the third quarter of 2017, maintaining relative stability over the year, thanks to stronger domestic demand. The most recent indicators point to slight moderation in the final part of the year, in a context of greater uncertainty, although the factors underlying growth continue in place and still suggest a solid growth in GDP. There is still a positive inertia in the data on activity and employment, as well as a more favorable global environment, while monetary policy continues expansive. As a result, GDP growth in the Spanish economy could be more than 3% 2017 as a whole.
Regarding the Spanish banking system, data from the Bank of Spain show that the total volume of private-sector lending (families and companies) continued its declining trend over the year (down 1.8% in the last twelve months through November 2017). However, since August there have been signs of a slight upturn in the total volume of credit in the economy, although it is still too weak to consider confirm that there has been a turning point. The cumulative volume of new lending through November 2017 showed year-on-year growth of 5.5%, with a rise in all portfolios (up 8.1% in the case of new lending to households and SMEs, which has risen consistently for 47 consecutive months). Non-performing loans in the sector continue to improve. As of November 2017, the NPL ratio was down until 8.1%, more than one percentage point below the previous year’s figure, despite the year-on-year fall in the lending volume. This improvement is therefore due to the reduction of the volume of non-performing assets in the system (down 13.9% in the last twelve months to November 2017 and down 48% compared to the maximum figure reached as of December 2013). The system's liquidity position continues to be comfortable. The funding gap (difference between the volume of loans and total deposits) fell to €129 billion, 5% of the total balance sheet of the system.
Activity
As of 31-Dec-2017, lending (performing loans under management) were down by 1.1% compared to the figure in December 2016 (up 0.6% over the quarter). This was primarily driven by a reduction in the mortgage (down 5.3% over the last twelve months and down 1.2% over the quarter) and the public sector portfolios (down 12.7% and 5.1% respectively). In contrast, commercial loans (up 6.4% since the close of 2016 and up 2.7% in the quarter), small businesses loans (up 2.7% and 2.6%, respectively), and consumer finance (up 46.0% and 13.8% respectively), have performed well, driven by the good performance of new loan production with cumulative year-on-year growth rates of 10.4% for businesses (including small businesses up to large corporations) and of 34.7% in consumer finance. It is worth noting that in 2017 there was a transfer of the outstanding portfolio of performing loans to developers for an amount exceeding €1bn from Non Core Real-Estate to Banking Activity in Spain.
Regarding asset quality, there was a further decline in NPLs balance. This decline has had a positive impact on the NPL ratio, which fell by 8 basis points over the last three months to 5.2%. The NPL coverage ratio stood at 50%.
Customer deposits under management were slightly reduced (down 0.9%) compared to the figure as of December 2016. By products, there was a further decline in time deposits (down 32.7% year-on-year and down 16.9% in the quarter), once again partially offset by an increase in current and savings accounts (up 20.2% and 6.3% respectively) and off-balance-sheet funds. The latter have continued their positive trend, with a year-on-year growth of 10.5% and 3.3% over the quarter. This performance was largely the result of increases in mutual funds (up 16.4% and 4.7%, respectively), and to a lesser extent, an increase in pension funds (up 2.4% and 1.3%, respectively).
Results
The key aspects of the income statement in the area are:
- Fourth quarter net interest income was up 2.1% on the figure for the previous quarter. However, the 3.6% year-on-year cumulative decline in this item is the result of lower loan volumes and sales of wholesale portfolios.
- Good performance of net fees and commissions, thanks mainly to the positive contribution from wholesale businesses and the increase of those coming from mutual funds. They have increased by 5.7% compared to the figure at the end of 2016 .
- Smaller contribution from NTI relative to the figure for 2016, strongly affected by capital gains (€138m before tax) from the VISA deal in the second quarter of the previous year.
- Year-on-year increase of 17.9% in other income/expenses. Under this category it is worth highlighting the performance of the insurance activity, whose net result (included in this heading) grew by 9.6%, strongly linked to the increase in new policies contracting during the period and the low claims ratio.
- As a result, gross income declined by 3.7% year-on-year, mainly due to a smaller volume of lending, sales of wholesale portfolios and the NTI generated in the 2016 VISA deal.
- Very positive trend in operating expenses, which declined by 5.6% on the same period of 2016 (down 0.8% in the last quarter). This reduction was again linked to the synergies related to the integration of CX and the ongoing implementation of efficiency plans.
- As a result, the efficiency ratio closed the year at 54.7% (55.8% in 2016) and operating income was barely 1.3% below the figure registered in the previous year.
- Impairment losses on financial assets have declined 25.7% year-on-year as a result of lower loan-loss provisioning needs. The area's cumulative cost of risk continues improving, standing at 0.31% as of 31-Dec-2017.
- Finally, the provisions (net) and other gains (losses) heading fell year-on-year by 54.3%, basically because in the fourth quarter of 2016 there was a charge of €577m before taxes (€404m after taxes) to cover the contingency of future claims by customers linked to the decision of the CJEU on "mortgage floor clauses" in consumer mortgage loans. This item also includes the costs resulting from the restructuring process involved.
As a result, the net attributable profit generated by Banking Activity in Spain in 2017 stood at €1,381m, a year-on-year increase of 52.7%, strongly influenced by the positive performance in the year of net fees and commissions, operating expenses and loan-loss provisions. Moreover, the figures for 2016 were influenced by the charge to cover the contingency for the aforementioned "mortgage floor clauses". Excluding this charge, the year-on-year profit of the area would grow by 5.5%.
Financial statements and relevant business indicators (Million euros. Percentage)
| Income statement | 2017 | ∆% | 2016 |
|---|---|---|---|
| Net interest income | 3.738 | (3.6) | 3.877 |
| Net fees and commissions | 1,561 | 5.7 | 1,477 |
| Net trading income | 555 | (29.4) | 786 |
| Other income/expenses | 327 | 17.9 | 277 |
| of which insurance activities (1) | 438 | 9.6 | 400 |
| Gross income | 6,180 | (3.7) | 6,416 |
| Operating expenses | (3.378) | (5.6) | (3.579) |
| Personnel expenses | (1.916) | (4.2) | (2.000) |
| Other administrative expenses | (1.150) | (8.1) | (1.251) |
| Depreciation | (313) | (4.4) | (327) |
| Operating income | 2,802 | (1.3) | 2,837 |
| Impairment on financial assets (net) | (567) | (25.7) | (763) |
| Provisions (net) and other gains (losses) | (369) | (54.3) | (807) |
| Profit/(loss) before tax | 1,866 | 47.2 | 1,268 |
| Income tax | (482) | 33.9 | (360) |
| Profit/(loss) for the year | 1,384 | 52.5 | 908 |
| Non-controlling interests | (3) | (3.6) | (3) |
| Net attributable profit | 1,381 | 52.7 | 905 |
- (1) Includes premiums received net of estimated technical insurance reserves.
| Balance sheets | 31-12-17 | ∆% | 31-12-16 |
|---|---|---|---|
| Cash, cash balances at central banks and other demand deposits | 13,463 | 10.1 | 12,230 |
| Financial assets | 88,131 | (12.2) | 100,394 |
| Loans and receivables | 213,037 | (0.7) | 214,497 |
| of which loans and advances to customers | 183,172 | 1.1 | 181,137 |
| Inter-area positions | 1,501 | (67.8) | 4,658 |
| Tangible assets | 877 | (38.9) | 1,435 |
| Other assets | 2,409 | (8.5) | 2,632 |
| Total assets/liabilities and equity | 319,417 | (4.9) | 335,847 |
| Financial liabilities held for trading and designated at fair value through profit or loss | 36,817 | (9.1) | 40,490 |
| Deposits from central banks and credit institutions | 62,226 | (5.8) | 66,029 |
| Deposits from customers | 177,763 | (1.5) | 180,544 |
| Debt certificates | 33,301 | (13.1) | 38,322 |
| Inter-area positions | - | - | - |
| Other liabilities | 391 | (68.0) | 1,220 |
| Economic capital allocated | 8,920 | (3.5) | 9,242 |
| Relevant business indicators | 31-12-17 | ∆% | 31-12-16 |
|---|---|---|---|
| Loans and advances to customers (gross) (1) | 177,764 | (1.6) | 180,595 |
| Non-performing loans and contingent liabilities | 10,833 | (8.3) | 11,819 |
| Customer deposits under management (1) | 173,283 | (0.9) | 174,809 |
| Off-balance sheet funds (2) | 62,054 | 10.5 | 56,147 |
| Risk-weighted assets | 111,825 | (1.2) | 113,194 |
| Efficiency ratio (%) | 54.7 | 55.8 | |
| NPL ratio (%) | 5.2 | 5.8 | |
| NPL coverage ratio (%) | 50 | 53 | |
| Cost of risk (%) | 0.31 | 0.32 |
- (1) Excluding repos.
- (2) Includes mutual funds. pension funds and other off-balance-sheet funds.