South America
Highlights
- Activity continues to grow at a good pace.
- More recurring revenue items performing very well.
- Expenses grow below gross income.
- Stable risk indicators.
Business activity (1)
(Year-on-year change at constant exchange rates. Data as of 31-12-2017)

(1) Excluding repos.
Net interest income/ATAs
(Percentage. Constant exchange rates)

Operating income
(Million euros at constant exchange rates)
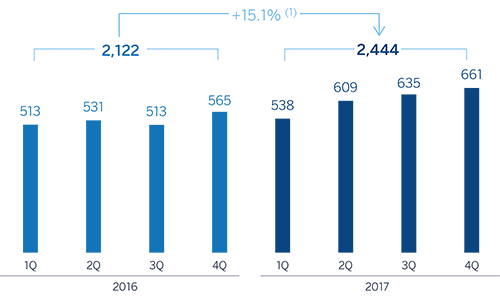
(1)At current exchange rates: +13.1%.
Net attributable profit
(Million euros at constant exchange rates)

(1) At current exchange rates: +11.6%.
Breakdown of performing loans under management (1)
(31-12-2017)

(1) Excluding repos.
Breakdown of customer funds under management (1)
(31-12-2017)

(1) Excluding repos.
Macro and industry trends
The economies of South America consolidated their recovery in 2017, though the pace of growth was still moderate. The external environment improved due to rising global demand and commodity prices, and this was accompanied by a gradual increase in confidence among agents in the region. At the same time, the buoyant financial markets have stimulated capital flows into the emerging economies. The result has been a strong export sector, growth in investment and early signs of an improvement in consumption.
In most countries in the region, inflation moderated in 2017 as a result of relatively stable exchange rates and weak domestic demand. Against this backdrop of low inflationary pressure and very moderate growth, the central banks continued to apply expansive monetary policies (except in Argentina).
Regarding the banking systems within BBVA's regional footprint, the macroeconomic backdrop and reduced levels of banking penetration in these countries in aggregate terms (obviously with differences between countries) led to strong results in terms of the main indicators of profitability and solvency, while non-performing loans remained under control. In addition, there has been sustained growth in lending and deposits.
Activity
All the comments below on rates of change, for both activity and earnings, will be given at constant exchange rate, unless expressly stated otherwise. These rates, together with changes at the current exchange rate, can be seen in the attached tables of financial statements and relevant business indicators.
Growth in lending (performing loans under management) accelerated in the last quarter of the year, and closed 9.7% above the figure at the end of December 2016 and 4.5% up on the close of September. By segments, the strong performance of the individual customer segment (particularly consumer finance, credit cards and, to a lesser extent, mortgages) outpaced growth in the commercial and public sector (wholesale portfolio). By country, the fastest growth continued to be in Argentina (up 65.8% year-on-year), Colombia (up 8.5%) and Chile (up 6.7%).
With respect to credit quality, there was a slight improvement in the NPL ratio over the quarter, closing the year at 3.4%. The NPL coverage ratio ended the year at 89%.
Total customer funds ended 2017 with quarterly growth of 5.2% and year-on-year growth of 10.5%. The trend over the year is explained by the good performance of transactional funds (up 16.3% since December 2016) and off-balance-sheet funds (up 16.6%). By countries, the trend was particularly positive in Argentina (up 37.3% on December 2016) and Colombia (up 12.9%).
Results
South America posted a cumulative net attributable profit of €861m in 2017, a year-on-year increase of 14.0%. The key aspects of the income statement in this area were:
- Gross income grew by 13.9%, thanks to the capacity to generate recurring revenues in the area. Net interest income outpaced growth in the loan book (up 15.1%), on the back of greater volumes and effective price management, while income from fees and commissions rose by 17.9%. The contribution from NTI was also positive, favored by improved results from foreign-currency operations.
- Operating expenses increased by less than gross income (up 12.4%) due to cost controls implemented in all the countries. In fact, they also increased below or in line with the average inflation in most of the countries.
- Impairment losses on financial assets moderated their year-on-year growth with respect to the previous quarter, with a cumulative increase of 26.1%. This heading is affected by the impact of provisions associated with one particular customer. However, the slowdown allowed the cumulative cost of risk to reach 1.32% at the close of December, slightly below the third quarter of 2017 (1.51%).
By country, recurring revenues performed very well in Argentina, with notable growth in both net interest income and the excellent performance of net fees and commissions, which contributed to a growth in gross income of 25.0%. However, expenses remained affected by high inflation. In July, BBVA Francés carried out a USD 400m share capital increase to finance the bank's organic growth, given the country's good economic outlook. The transaction has resulted in a higher charge under the non-controlling interests heading. As a result, net attributable profit increased by 19.1% year-on-year. In Chile, positive trend in gross income (net interest income up thanks to favorable figures in lending and effective management of customer spreads) and strict control of growth in expenses comfortably offset the rise in loan-loss provisioning and the increase in the nominal tax rate. Accordingly, the country recorded a rise of 27.0% in net attributable profit relative to 2016. In Colombia, gross income performed strongly, thanks to positive figures from net interest income (due to both activity and spreads) and net fees and commissions, albeit mitigated by lower NTI (the same period of 2016 included capital gains from the disposal of equity holdings) and an increase in loan-loss provisioning. As a result, net attributable profit was 8.5% lower than in 2016. In Peru, net attributable profit grew by 6.0% when compared to the figure for the previous year. The good NTI performance, strict control of expenses and a reduction of loan-loss provisions were partly mitigated by moderate growth in recurring revenues.
Financial statements and relevant business indicators (Million euros. Percentage)
| Income statement | 2017 | ∆% | ∆%(1) | 2016 |
|---|---|---|---|---|
| Net interest income | 3,200 | 9.2 | 15.1 | 2,930 |
| Net fees and commissions | 713 | 12.4 | 17.9 | 634 |
| Net trading income | 480 | 3.4 | 6.2 | 464 |
| Other income/expenses | 59 | 135.6 | (18.9) | 25 |
| Gross income | 4,451 | 9.8 | 13.9 | 4,054 |
| Operating expenses | (2,008) | 6.0 | 12.4 | (1,894) |
| Personnel expenses | (1,035) | 5.4 | 10.6 | (982) |
| Other administrative expenses | (851) | 5.0 | 12.1 | (811) |
| Depreciation | (121) | 20.8 | 32.8 | (100) |
| Operating income | 2,444 | 13.1 | 15.1 | 2,160 |
| Impairment on financial assets (net) | (650) | 23.6 | 26.1 | (526) |
| Provisions (net) and other gains (losses) | (103) | 26.2 | (12.9) | (82) |
| Profit/(loss) before tax | 1,691 | 8.9 | 13.5 | 1,552 |
| Income tax | (486) | (0.3) | 10.1 | (487) |
| Profit/(loss) for the year | 1,205 | 13.1 | 15.0 | 1,065 |
| Non-controlling interests | (345) | 17.0 | 17.6 | (294) |
| Net attributable profit | 861 | 11.6 | 14.0 | 771 |
| Balance sheets | 31-12-17 | ∆% | ∆%(1) | 31-12-16 |
|---|---|---|---|---|
| Cash, cash balances at central banks and other demand deposits | 9,039 | (14.6) | 5.2 | 10,586 |
| Financial assets | 11,742 | 9.3 | 20.5 | 10,739 |
| Loans and receivables | 51,207 | (5.3) | 6.4 | 54,057 |
| of which loans and advances to customers | 48,272 | (0.9) | 11.2 | 48,718 |
| Tangible assets | 725 | (10.1) | 13.5 | 807 |
| Other assets | 1,923 | 11.2 | 25.1 | 1,729 |
| Total assets/liabilities and equity | 74,636 | (4.2) | 8.7 | 77,918 |
| Financial liabilities held for trading and designated at fair value through profit or loss | 2,823 | 9.2 | 16.0 | 2,585 |
| Deposits from central banks and credit institutions | 7,552 | 13.5 | 23.7 | 6,656 |
| Deposits from customers | 45,666 | (4.7) | 10.0 | 47,927 |
| Debt certificates | 7,209 | (3.2) | 4.0 | 7,447 |
| Other liabilities | 8,505 | (19.8) | (9.0) | 10,600 |
| Economic capital allocated | 2,881 | 6.6 | 23.5 | 2,703 |
| Relevant business indicators | 31-12-17 | ∆% | ∆%(1) | 31-12-16 |
|---|---|---|---|---|
| Loans and advances to customers (gross) (2) | 49,845 | (0.9) | 11.2 | 50,316 |
| Non-performing loans and contingent liabilities | 1,884 | 15.1 | 26.8 | 1,637 |
| Customer deposits under management (2) | 45,676 | (5.5) | 9.0 | 48,334 |
| Off-balance sheet funds (3) | 12,197 | 2.5 | 16.6 | 11,902 |
| Risk-weighted assets | 55,665 | (3.1) | 11.5 | 57,443 |
| Efficiency ratio (%) | 45.1 | 46.7 | ||
| NPL ratio (%) | 3.4 | 2.9 | ||
| NPL coverage ratio (%) | 89 | 103 | ||
| Cost of risk (%) | 1.32 | 1.15 |
- (1) Figures at constant exchange rates.
- (2) Excluding repos.
- (3) Excluding repos and including specific marketable debt securities.
South America. Data per country (Million euros)
| Operating income | Net attributable profit | |||||||
|---|---|---|---|---|---|---|---|---|
| Country | 2017 | ∆% | ∆% (1) | 2016 | 2017 | ∆% | ∆% (1) | 2016 |
| Argentina | 522 | 3.5 | 18.8 | 504 | 219 | 3.8 | 19.1 | 211 |
| Chile | 421 | 19.5 | 17.0 | 352 | 188 | 29.8 | 27.0 | 145 |
| Colombia | 644 | 20.6 | 19.0 | 534 | 206 | (7.3) | (8.5) | 222 |
| Peru | 726 | 4.1 | 2.6 | 698 | 180 | 7.5 | 6.0 | 167 |
| Other countries (1) | 131 | 82.8 | 77.0 | 72 | 68 | 161.1 | 135.1 | 26 |
| Total | 2,444 | 13.1 | 15.1 | 2,160 | 861 | 11.6 | 14.0 | 771 |
- (1) Figures at constant exchange rates.
- (2) Venezuela, Paraguay, Uruguay and Bolivia. Additionally, it includes eliminations and other charges.
South America. Relevant business indicators per country (Million euros)
| Argentina | Chile | Colombia | Peru | |||||
|---|---|---|---|---|---|---|---|---|
| 31-12-17 | 31-12-16 | 31-12-17 | 31-12-16 | 31-12-17 | 31-12-16 | 31-12-17 | 31-12-16 | |
| Loans and advances to customers (gross) (1.2) | 5,856 | 3,392 | 15,067 | 14,028 | 12,475 | 11,240 | 13,309 | 13,247 |
| Deposits from customers | 45 | 36 | 420 | 404 | 672 | 455 | 645 | 649 |
| Customer deposits under management (1.3) | 6,779 | 5,046 | 9,687 | 9,619 | 12,288 | 11,222 | 12,019 | 12,186 |
| Off-balance sheet funds (1.4) | 1,253 | 805 | 1,295 | 1,428 | 1,118 | 655 | 1,581 | 1,385 |
| Risk-weighted assets | 9,364 | 8,717 | 14,300 | 14,300 | 12,249 | 12,185 | 14,750 | 17,400 |
| Efficiency ratio (%) | 56.1 | 53.8 | 45.2 | 49.1 | 36.0 | 38.9 | 35.6 | 35.8 |
| NPL ratio (%) | 0.8 | 0.8 | 2.6 | 2.6 | 5.3 | 3.5 | 3.8 | 3.4 |
| NPL coverage ratio (%) | 198 | 391 | 60 | 66 | 88 | 105 | 100 | 106 |
| Cost of risk (%) | 0.61 | 1.48 | 0.76 | 0.74 | 2.59 | 1.34 | 1.13 | 1.31 |
- (1) Figures at constant exchange rates.
- (2) Excluding repos.
- (3) Excluding repos and including specific marketable debt securities.
- (4) Includes mutual funds, pension funds and other off-balance-sheet funds.