Annex
Corporate & Investment Banking
Highlights
- Continued environment of pressure on margins and excess liquidity.
- Better year-on-year performance of lending.
- Good performance of net interest income.
- Stable net attributable profit in a complicated scenario.
Business activity (1)
(Year-on-year change at constant exchange rates. Data as of 30-09-2018)
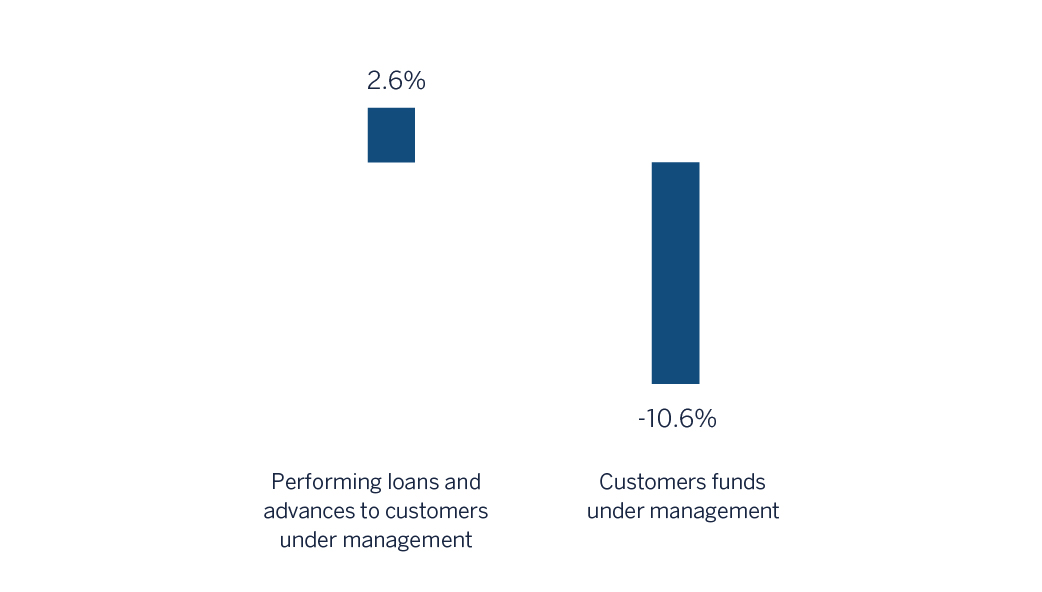
(1) Excluding repos.
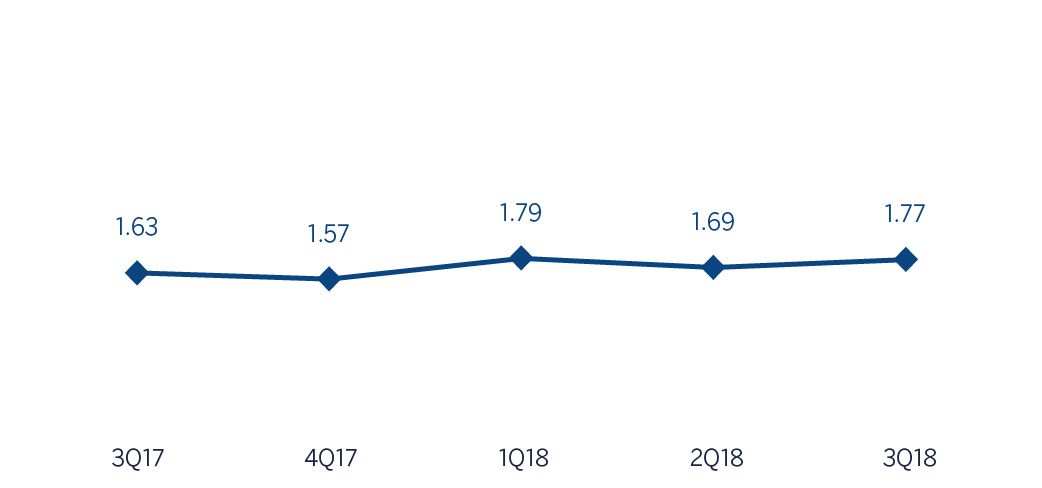
Gross income/ATAs
(Percentage. Constant exchange rates)
Operating income
(Millions of Euros at constant exchange rates)

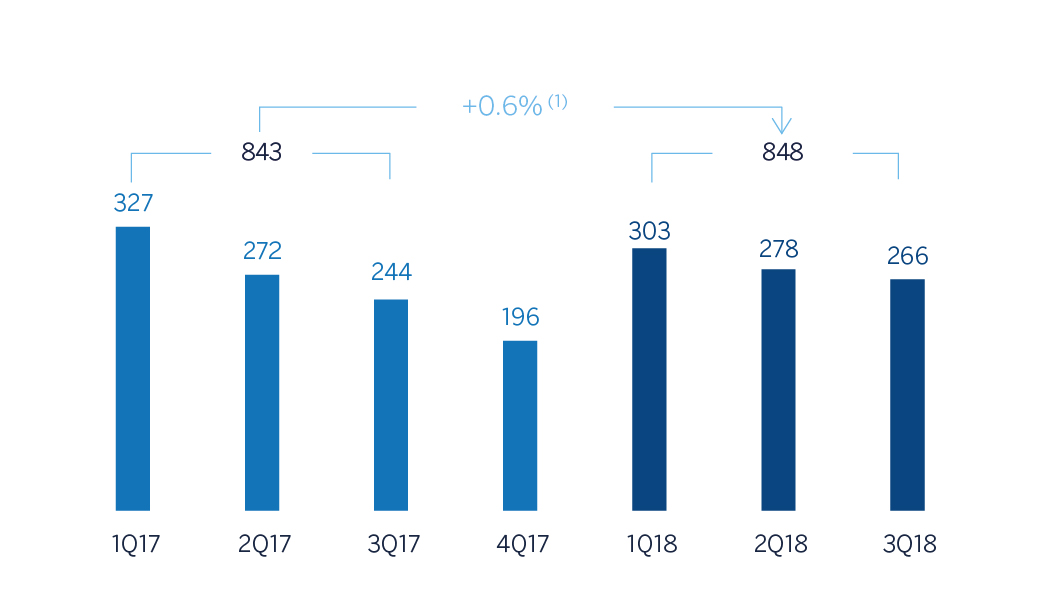
Net attributable profit
(Millions of Euros at constant exchange rates)
(1) At current exchange rate: -11.0%.
(1) At current exchange rate: -8.1%.
Breakdown of performing loans under management (1)
(30-09-2018)
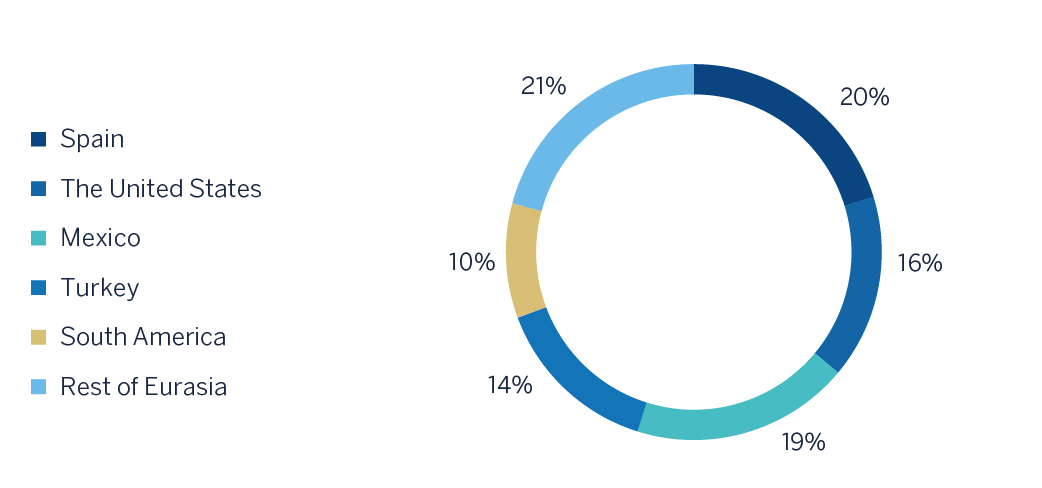
(1) Excluding repos.
Breakdown of customer funds under management (1)
(30-09-2018)

(1) Excluding repos.
Financial market trends
In the third quarter of the year, the financial markets were affected by rising trade tensions between the United States and China, and the ongoing process of gradual normalization of the monetary policies of central banks in developed countries. These two elements, together with idiosyncratic factors in some countries, led to a further adjustment in the currencies of emerging countries, in particular those that had accumulated the biggest imbalances, such as Argentina and Turkey. Recently, the overwhelming response by central banks, together with the greater flexibility of economic policy in China, the stability of the renminbi and the new NAFTA agreement between the United States, Mexico and Canada, have contributed to moderate the pressure on most emerging currencies. Nevertheless, these countries still face major challenges resulting from trade tensions between China and the United States, the impact of increased financial tension on economic growth and specific events that can increase risk for some countries considered systemic for their region (Brazil, India and Russia).
In contrast, developed countries have remained unaffected by the tensions in emerging economies. Thus the volatility in emerging countries, the increase in protectionism and tighter monetary policy in the United States have had not impact on the financial markets of developed countries. The U.S. stock markets hit new highs and implied volatility remains very low, even though the risk-free 10-year yields of U.S. bonds are now consolidated at levels above 3%. In contrast, European assets have been negatively affected by the stagnation in the Brexit negotiations and the proposed fiscal expansion of the Italian government, which represents a move away from the fiscal stability rules of the European Union. In this environment the euro is still unable to consolidate a position at levels above 1.16 dollars and European assets performed worse than North American assets.
Activity
All the comments below regarding rates of change, for both activity and earnings, will be given at constant exchange rate, unless expressly stated otherwise. These rates, together with changes at the current exchange rate, can be seen in the attached tables of financial statements and relevant business indicators.
The most relevant aspects related to the area’s activity year-to-date as of 30-September-2018 were:
- The market conditions remain unchanged, with margins squeezed and excess liquidity. Lending (performing loans under management) showed signs of recovery compared to the end of the first quarter of 2018, and grew by 4.6% year-to-date and 2.6% year-on-year. By geography, all presented positive growth rates with the exception of Spain.
- Positive trend in customer funds during the third quarter of the year, which has led to a positive growth rate in the quarter (+ 5.5%), while it has decreased so far this year (-8.0 %). Figures varied by geography, showing growth in South America, Turkey and Spain and declines in the United States, Mexico and Rest of Eurasia.
- In the mergers & acquisitions (M&A) business, activity in Spain and Portugal during the quarter continued to be positive, driven by the same factors that boosted the market throughout 2017 and influenced by the rebound of foreign direct investment. The High liquidity levels, the attractive financing conditions and the economic growth situation in Spain are expected to continue to stimulate the market during the last quarter of the year.
- In the Equity Capital Markets Unit (ECM), after August, a traditionally low activity month, markets started to reactivate during the first weeks of September.
- BBVA's leadership in the green loan market was reflected in the 20 transactions (including 2 of the 3 mayor sustainable lends) structured and led, representing a total value of €12.4 billion, in different formats: syndicated loans and RCF, bilateral loans and Project Finance, and that made BBVA the most active financial institution in this business at an international level. BBVA´s bet on innovation is evident after the signing of a “green loan” for an amount of €35 million which constituted a pioneer investment within the Spanish market.
Results
CIB registered during the first nine month of 2018 a net attributable profit of €848m, a 0.6% increase with respect to the same period of 2017. The highlights of the year-on-year changes in the income statement in this aggregate are summarized below:
- Increase in net interest income (+11.1% on year-on-year terms), driven by good performance in the United States, South America and Turkey.
- Commissions showed a slight decrease, due to lack of activity in Corporate Finance.
- Rise in NTI (up 8.0%), thanks to a favorable market volatility management and especially, in the emerging ones during the third quarter of 2018.
- Due to the former, gross income showed a year-to-year improvement of +0.4%.
- Operating expenses increased affected by inflation of the emerging geographies (+ 1.7%). Even so, moderation of discrete costs continues.
- Finally, impairment losses on financial assets increased, 52.4%, mainly as a result of higher provision needs in Spain, Turkey and South America for singular clients.
Financial statements and relevant business indicators (Millions of Euros and percentage)
| IFRS 9 | IAS 39 | ||||
|---|---|---|---|---|---|
| Income statement | Jan.-Sep. 18 | ∆% | ∆%(1) | Jan.-Sep. 17 | |
| Net interest income | 1,027 | (0.2) | 11.1 | 1,029 | |
| Net fees and commissions | 535 | (11.0) | (1.8) | 601 | |
| Net trading income | 671 | (1.7) | 8.0 | 682 | |
| Other operating income and expenses | (30) | n.s. | n.s. | 103 | |
| Gross income | 2,203 | (8.8) | 0.4 | 2,415 | |
| Operating expenses | (757) | (4.3) | 1.7 | (791) | |
| Personnel expenses | (340) | (8.6) | (3.9) | (371) | |
| Other administrative expenses | (336) | (1.4) | 7.1 | (341) | |
| Depreciation | (82) | 3.2 | 5.0 | (79) | |
| Operating income | 1,446 | (11.0) | (0.2) | 1,624 | |
| Impairment on financial assets not measured at fair value through profit or loss | (42) | 23.3 | 52.4 | (34) | |
| Provisions or reversal of provisions and other results | (27) | (9.9) | (9.0) | (30) | |
| Profit/(loss) before tax | 1,377 | (11.7) | (1.1) | 1,560 | |
| Income tax | (324) | (22.4) | (13.7) | (418) | |
| Profit/(loss) for the year | 1,053 | (7.8) | 3.6 | 1,142 | |
| Non-controlling interests | (205) | (6.7) | 18.3 | (220) | |
| Net attributable profit | 848 | (8.1) | 0.6 | 922 | |
- (1) Figures at constant exchange rates.
| IFRS 9 | IAS 39 | ||||
|---|---|---|---|---|---|
| Balance sheets | 30-09-18 | ∆% | ∆%(1) | 31-12-17 | |
| Cash, cash balances at central banks and other demand deposits | 3,510 | (16.4) | (19.2) | 4,200 | |
| Financial assets designated at fair value | 93,472 | 28.3 | 26.7 | 72,878 | |
| of which loans and advances | 21,823 | n.s | n.s | 648 | |
| Financial assets at amortized cost | 63,968 | (31.9) | (29.9) | 93,948 | |
| of which loans and advances to customers | 56,068 | (17.0) | (13.9) | 67,529 | |
| Inter-area positions | - | - | - | - | |
| Tangible assets | 27 | (21.8) | (17.9) | 35 | |
| Other assets | 3,766 | 60.8 | 64.1 | 2,342 | |
| Total assets/liabilities and equity | 164,743 | (5.0) | (4.1) | 173,403 | |
| Financial liabilities held for trading and designated at fair value through profit or loss | 77,548 | 58.1 | 57.7 | 49,060 | |
| Deposits from central banks and credit institutions | 15,763 | (65.3) | (65.9) | 45,427 | |
| Deposits from customers | 41,869 | (14.2) | (11.5) | 48,792 | |
| Debt certificates | 983 | 88.0 | 87.5 | 523 | |
| Inter-area positions | 22,424 | 3.4 | 9.1 | 21,687 | |
| Other liabilities | 2,694 | (31.1) | (32.2) | 3,908 | |
| Economic capital allocated | 3,463 | (13.6) | (11.6) | 4,007 | |
- (1) Figures at constant exchange rates.
| IFRS 9 | IAS 39 | ||||
|---|---|---|---|---|---|
| Relevant business indicators | 30-09-18 | ∆% | ∆%(1) | 31-12-17 | |
| Performing loans and advances to customers under management (2) | 56,394 | 0.1 | 4.6 | 56,315 | |
| Non-performing loans | 497 | (15.0) | (16.1) | 584 | |
| Customer deposits under management (2) | 39,358 | (10.7) | (7.7) | 44,095 | |
| Off-balance sheet funds (3) | 957 | (29.5) | (24.4) | 1,357 | |
| Efficiency ratio (%) | 34.4 | 34.1 | |||
- (1) Figures at constant exchange rates.
- (2) Excluding repos.
- (3) Includes mutual funds, pension funds and other off-balance-sheet funds.