
Business areas
Banking activity in Spain
Highlights
- Activity impacted by seasonality.
- Good performance of net fees and commissions.
- Improvement of efficiency due to the steady reduction of expenses.
- Lower impairments and provisions, solid asset-quality indicators.
Spain
Gross income. Year-on-year changes.
€4,516 m
-4.6%
Non Core Real Estate
Highlights
- Continued positive trend in the Spanish real-estate market, although with a more moderate growth rate.
- The operation with Cerberus closed in October, which reduces net real-estate exposure almost entirely.
- Significant reduction in losses in the area.
Spain
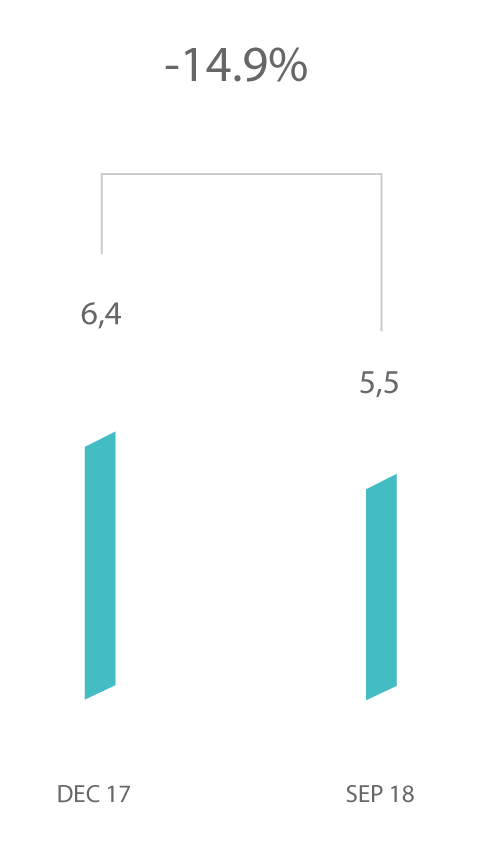
Gross income. Year-on-year changes.
-€11 m
-38.5%
The United States
Highlights
- Lending growth supported by consumer and business financing.
- Good performance of net interest income and provisions.
- Improvement in efficiency.
- Net attributable profit affected by the tax reform at the end of 2017.
The United States
Gross income. Year-on-year changes, at constant exchange rate.
€2,182 m
+9.1%
Mexico
Highlights
- Good performance of the activity.
- Expenses continue to grow below the rate of gross income.
- Double-digit year-on-year growth in net attributable profit.
- Good asset quality indicators.
Mexico
Gross income. Year-on-year changes, at constant exchange rate.
€5,340 m
+8.0%
Turkey
Highlights
- Activity impacted by the evolution of exchange rates.
- Good performance of recurring revenue items.
- Control of operating expenses.
- Risk indicators affected by the update of the macroeconomic scenario and certain negative impacts of the portfolio of wholesale customers.
Turkey
Gross income. Year-on-year changes, at constant exchange rate.
€2,801 m
+28.1%

South America
Highlights
- The operation of the sale of BBVA Chile closed.
- Activity in other countries grows at a good pace.
- Good performance in more recurrent revenue.
- Argentina hyperinflation adjustment.
South America
Gross income. Year-on-year changes At constant exchange rates.
€2,777 m
+3.6%
Rest of Eurasia
Highlights
- Positive trend in lending activity.
- Performance of deposits strongly influenced by the environment of negative interest rates.
- Earnings affected by decrease in revenues.
- Improvement of the NPL and NPL coverage ratios.
Rest of Eurasia
Gross income. Year-on-year changes.
€317 m
-13.8%
This section presents and analyzes the most relevant aspects of the Group's different business areas. Specifically, it shows a summary of the income statement and balance sheet, the business activity figures and the most significant ratios in each of them.
At the closing of the third quarter of 2018 the reporting structure of BBVA Group's business areas remained basically the same even if its composition differs from the one presented during the same period in 2017 due to the sale of BBVA Chile announced last year and which has been closed on July 6. This operation, which has affected the composition of the business area of South America, will be detailed in the following sections as well as the rest of the Group’s business areas:
- Banking activity in Spain includes the Retail Network in Spain, Corporate and Business Banking (CBB), Corporate & Investment Banking (CIB), BBVA Seguros and Asset Management units in Spain. It also includes the new loan production to developers or loans that are no longer in difficulties as well as the portfolios, funding and structural interest-rate positions of the euro balance sheet.
- Non Core Real Estate covers specialist management in Spain of loans to developers in difficulties and real-estate assets mainly coming from foreclosed assets, originated from both, residential mortgages, as well as loans to developers. On November 29, 2017, BBVA Group signed an agreement with Cerberus Capital Management, L.P. (Cerberus) for the creation of a joint venture in which the real-estate business area of BBVA in Spain would be transferred. At a later stage, 80% of this entity would be sold to a subsidiary of Cerberus. On October 10, 2018, the stated operation was closed, even though the effective transfer of some real-estate owned assets (“REOs”) are subject to the fulfillment of certain conditions and in the meanwhile, BBVA will continue to manage those assets. With respect to the explanations of the quarterly report, the figures of Non Core Real Estate are disclosed continuously with prior periods.
- The United States includes the Group's business activity in the country through the BBVA Compass group and the BBVA New York branch.
- Mexico basically includes all the banking and insurance businesses carried out by the Group in the country. Since 2018 it has also included the BBVA Bancomer branch in Houston (in previous years located in the United States). Consequently, the figures from previous years have been reworked to incorporate this change and show comparable series.
- Turkey includes the activity of the Garanti group.
- South America basically includes BBVA's banking and insurance businesses in the region. On July 6, 2018, the sale of BBVA Chile to The Bank of Nova Scotia (Scotiabank) was completed which affects the comparability of the results, the balance sheet, the activity and the most significant ratios of this business area with prior periods.
- The rest of Eurasia includes the Group's retail and wholesale business activity in the rest of Europe and Asia.
In addition to the above, all the areas include a remainder made up basically of other businesses and a supplement that includes deletions and allocations not assigned to the units making up the above areas.
Lastly, the Corporate Center is an aggregate that contains the rest of the items that have not been allocated to the business areas, as it corresponds to the Group's holding function. It includes: the costs of the head offices that have a corporate function; management of structural exchange-rate positions; specific issues of equity instruments to ensure adequate management of the Group’s global solvency; portfolios and their corresponding results, whose management is not linked to customer relations, such as industrial holdings; certain tax assets and liabilities; funds due to commitments with employees; goodwill and other intangibles.
In addition to this geographical breakdown, supplementary information is provided for all the wholesale businesses carried out by BBVA, i.e. Corporate & Investment Banking (CIB), in the geographical areas where it operates. This aggregate business is considered relevant to better understand the Group because of the characteristics of the customers served, the type of products offered and the risks assumed.
Finally, as usual, in the case of the Americas, Turkey and CIB areas, the results of applying constant exchange rates are given in addition to the year-on-year variations at current exchange rates.
The information by areas is based on units at the lowest level and/or companies making up the Group, which are assigned to the different areas according to the main geographical area in which they carry out their activity.
Major income statement items by business area (Millions of Euros)
| Business areas | ||||||||||
|---|---|---|---|---|---|---|---|---|---|---|
| BBVA Group | Banking activity in Spain | Non Core Real Estate | The United States | Mexico | Turkey | South America | Rest of Eurasia | ∑ Business areas | Corporate Center and other | |
| Jan.-Sep. 18 | ||||||||||
| Net interest income | 12,899 | 2,749 | 32 | 1,665 | 4,110 | 2,204 | 2,226 | 124 | 13,109 | (210) |
| Gross income | 17,596 | 4,516 | (11) | 2,182 | 5,340 | 2,801 | 2,777 | 317 | 17,921 | (325) |
| Operating income | 8,875 | 2,061 | (69) | 810 | 3,581 | 1,887 | 1,527 | 99 | 9,896 | (1,022) |
| Profit/(loss) before tax | 6,012 | 1,574 | (75) | 686 | 2,558 | 1,267 | 987 | 94 | 7,089 | (1,077) |
| Net attributable profit | 4,323 | 1,167 | (60) | 541 | 1,851 | 488 | 467 | 57 | 4,510 | (188) |
| Jan.-Sep. 17 | ||||||||||
| Net interest income | 13,202 | 2,792 | 48 | 1,591 | 4,109 | 2,399 | 2,393 | 144 | 13,476 | (274) |
| Gross income | 18,908 | 4,734 | (18) | 2,139 | 5,351 | 3,008 | 3,340 | 367 | 18,920 | (13) |
| Operating income | 9,522 | 2,178 | (92) | 756 | 3,514 | 1,873 | 1,827 | 140 | 10,196 | (674) |
| Profit/(loss) before tax | 6,015 | 1,459 | (349) | 541 | 2,237 | 1,510 | 1,209 | 141 | 6,748 | (733) |
| Net attributable profit | 3,449 | 1,056 | (274) | 402 | 1,636 | 568 | 616 | 101 | 4,105 | (656) |
Gross income (1), operating income (1) and net attributable profit breakdown (1) (Percentage. January-september 2018)
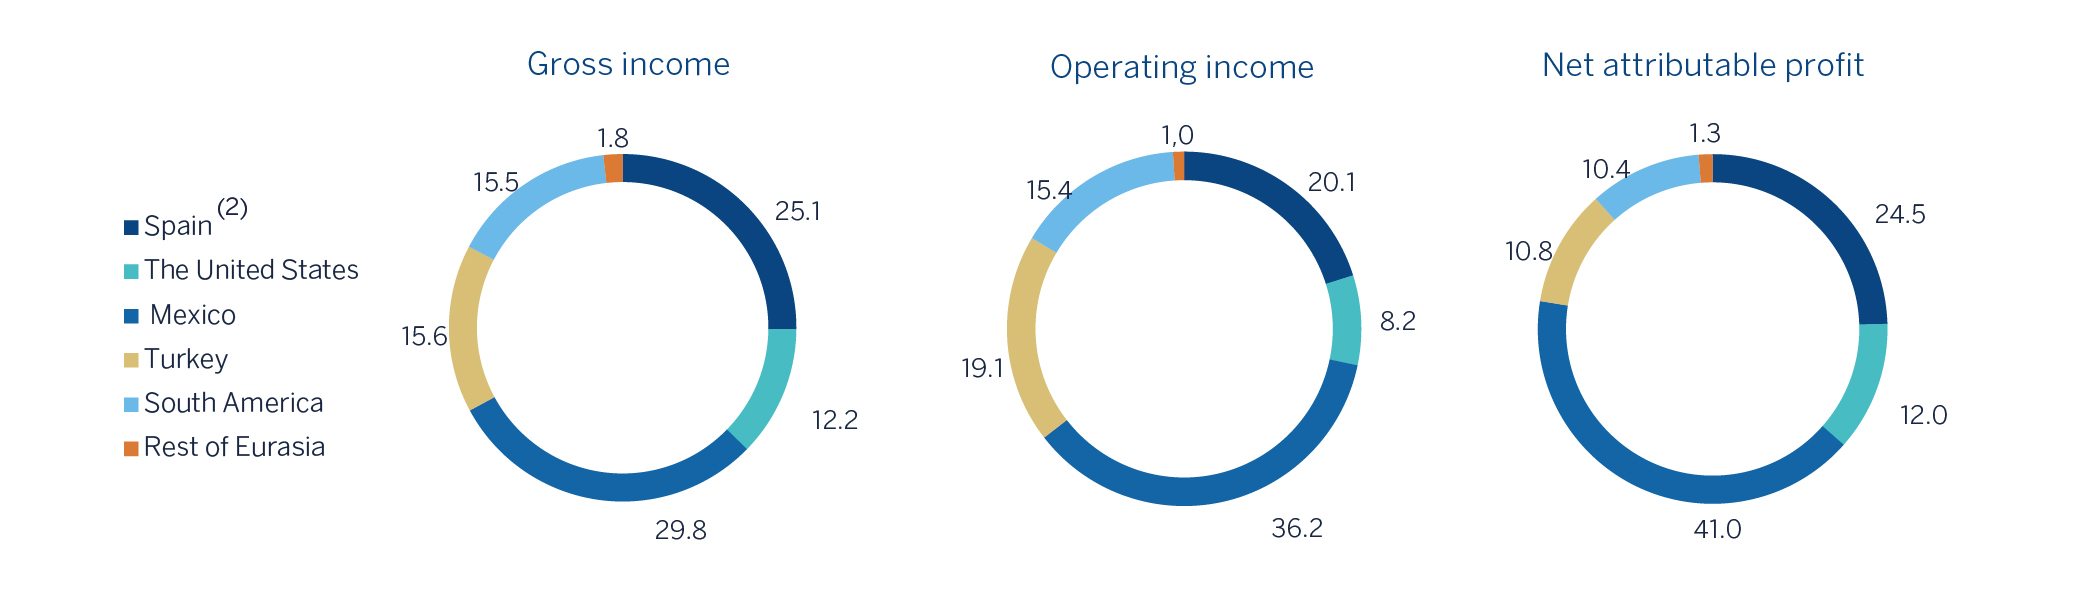
(1) Excludes the Corporate Center.
(2) Includes the areas Banking activity in Spain and Non Core Real Estate.
Major balance-sheet items and risk-weighted assets by business area (Millions of Euros)
| Business areas | |||||||||||
|---|---|---|---|---|---|---|---|---|---|---|---|
| BBVA Group | Banking activity in Spain | Non Core Real Estate | The United States | Mexico | Turkey | South America | Rest of Eurasia | ∑ Business areas | Corp. Center and other | NCA&L variation(1) | |
| 30-09-18 | |||||||||||
| Loans and advances to customers | 370,496 | 167,856 | 743 | 58,608 | 52,039 | 40,833 | 34,795 | 15,622 | 370,496 | - | - |
| Deposits from customers | 365,687 | 173,925 | 77 | 60,917 | 50,327 | 38,841 | 36,405 | 5,196 | 365,687 | - | - |
| Off-balance sheet funds | 100,989 | 64,150 | 2 | - | 22,323 | 2,583 | 11,548 | 383 | 100,989 | - | - |
| Total assets/liabilities and equity | 668,985 | 326,807 | 7,755 | 78,898 | 96,124 | 66,035 | 51,073 | 18,482 | 645,174 | 23,811 | - |
| Risk-weighted assets | 343,051 | 102,020 | 7,475 | 62,728 | 54,391 | 52,822 | 41,544 | 13,889 | 334,870 | 8,182 | - |
| 31-12-17 | |||||||||||
| Loans and advances to customers | 387,621 | 183,172 | 3,521 | 53,718 | 45,768 | 51,378 | 48,272 | 14,864 | 400,693 | - | (13,072) |
| Deposits from customers | 376,379 | 177,763 | 13 | 60,806 | 49,964 | 44,691 | 45,666 | 6,700 | 385,604 | - | (9,225) |
| Off-balance sheet funds | 98,005 | 62,054 | 4 | - | 19,472 | 3,902 | 12,197 | 376 | 98,005 | - | - |
| Total assets/liabilities and equity | 690,059 | 319,417 | 9,714 | 75,775 | 94,061 | 78,694 | 74,636 | 17,265 | 669,562 | 20,497 | - |
| Risk-weighted assets | 361,686 | 108,141 | 9,692 | 58,688 | 44,941 | 62,768 | 55,975 | 15,150 | 355,354 | 6,332 | - |
Interest rates (Quarterly averages. Percentage)
| 2018 | 2017 | ||||||
|---|---|---|---|---|---|---|---|
| 3Q | 2Q | 1Q | 4Q | 3Q | 2Q | 1Q | |
| Official ECB rate | 0.00 | 0.00 | 0.00 | 0.00 | 0.00 | 0.00 | 0.00 |
| Euribor 3 months | (0.32) | (0.33) | (0.33) | (0.33) | (0.33) | (0.33) | (0.33) |
| Euribor 1 year | (0.17) | (0.19) | (0.19) | (0.19) | (0.16) | (0.13) | (0.10) |
| USA Federal rates | 2.01 | 1.81 | 1.58 | 1.30 | 1.25 | 1.05 | 0.80 |
| TIIE (Mexico) | 8.11 | 7.88 | 7.84 | 7.42 | 7.37 | 7.04 | 6.41 |
| CBRT (Turkey) | 19.29 | 14.82 | 12.75 | 12.17 | 11.97 | 11.80 | 10.10 |
Exchange rates (Expressed in currency/euro)
| Year-end exchange rates | Average exchange rates | ||||
|---|---|---|---|---|---|
30-09-18 |
∆% on 30-09-17 |
∆% on 31-12-17 |
Jan.-Sep. 18 |
∆% on Jan.-Sep. 17 |
|
| Mexican peso | 21.7798 | (1.5) | 8.6 | 22.7371 | (7.6) |
| U.S. dollar | 1.1576 | 2.0 | 3.6 | 1.1944 | (6.8) |
| Argentine peso | 45.7373 | (54.7) | (50.6) | 45.7373 | (60.4) |
| Chilean peso | 765.70 | (1.8) | (3.6) | 750.19 | (2.9) |
| Colombian peso | 3,460.21 | 0.3 | 3.6 | 3,448.28 | (4.9) |
| Peruvian sol | 3.8148 | 1.1 | 1.7 | 3.8952 | (6.7) |
| Turkish lira | 6.9650 | (39.7) | (34.7) | 5.5066 | (27.3) |