Annex
Corporate & Investment Banking
Highlights
- Continued environment of pressure on margins and excess liquidity.
- Better year-on-year performance of lending.
- Good performance of net interest income.
- Net attributable profit impacted by higher provisions.
Business activity (1)
(Year-on-year change at constant exchange rates. Data as of 31-12-2018)
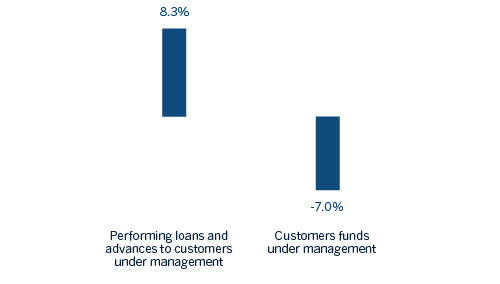
(1) Excluding repos.
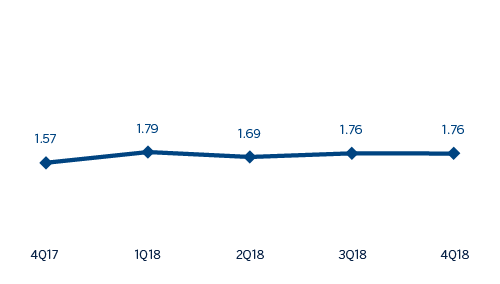
Gross income/ATAs
(Percentage. Constant exchange rates)
Operating income
(Millions of Euros at constant exchange rates)

Net attributable profit
(Millions of Euros at constant exchange rates)

(1) At current exchange rate: -6.1%.
(1) At current exchange rate: -9.8%.
Breakdown of performing loans under management (1)
(31-12-2018)

(1) Excluding repos.
Breakdown of customer funds under management (1)
(31-12-2018)
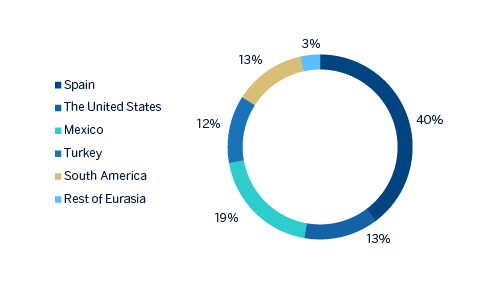
(1) Excluding repos.
Financial statements and relevant business indicators (Millions of Euros and percentage)
| IFRS 9 | IAS 39 | ||||
|---|---|---|---|---|---|
| Income statement | 2018 | ∆% | ∆%(1) | 2017 | |
| Net interest income | 1,441 | 5.0 | 16.2 | 1,372 | |
| Net fees and commissions | 692 | (10.5) | (2.3) | 774 | |
| Net trading income | 849 | (2.5) | 6.4 | 871 | |
| Other operating income and expenses | (40) | n.s. | n.s. | 112 | |
| Gross income | 2,941 | (6.0) | 2.9 | 3,128 | |
| Operating expenses | (1,007) | (5.8) | (0.7) | (1,068) | |
| Personnel expenses | (450) | (11.3) | (7.9) | (508) | |
| Other administrative expenses | (448) | (1.2) | 6.9 | (453) | |
| Depreciation | (109) | 1.1 | 2.6 | (108) | |
| Operating income | 1,935 | (6.1) | 4.8 | 2,060 | |
| Impairment on financial assets not measured at fair value through profit or loss | (340) | 131.6 | 175.0 | (147) | |
| Provisions or reversal of provisions and other results | (36) | (14.7) | (12.2) | (42) | |
| Profit/(loss) before tax | 1,558 | (16.7) | (7.3) | 1,871 | |
| Income tax | (362) | (25.9) | (17.7) | (489) | |
| Profit/(loss) for the year | 1,196 | (13.5) | (3.6) | 1,382 | |
| Non-controlling interests | (180) | (29.4) | (11.0) | (255) | |
| Net attributable profit | 1,016 | (9.8) | (2.1) | 1,127 | |
- (1) Figures at constant exchange rates.
| IFRS 9 | IAS 39 | ||||
|---|---|---|---|---|---|
| Balance sheets | 31-12-18 | ∆% | ∆%(1) | 31-12-17 | |
| Cash, cash balances at central banks and other demand deposits | 5,084 | 21.0 | 15.1 | 4,200 | |
| Financial assets designated at fair value | 92,394 | 26.8 | 26.4 | 72,878 | |
| of which loans and advances | 28,870 | n.s | n.s | 648 | |
| Financial assets at amortized cost | 65,120 | (30.7) | (28.9) | 93,948 | |
| of which loans and advances to customers | 58,718 | (13.0) | (10.4) | 67,529 | |
| Inter-area positions | - | - | - | - | |
| Tangible assets | 29 | (17.3) | (14.0) | 35 | |
| Other assets | 2,119 | (9.5) | (7.3) | 2,342 | |
| Total assets/liabilities and equity | 164,747 | (5.0) | (3.9) | 173,403 | |
| Financial liabilities held for trading and designated at fair value through profit or loss | 81,312 | 65.7 | 65.9 | 49,060 | |
| Deposits from central banks and credit institutions | 14,805 | (67.4) | (67.7) | 45,427 | |
| Deposits from customers | 40,026 | (18.0) | (15.9) | 48,792 | |
| Debt certificates | 1,117 | 113.7 | 112.9 | 523 | |
| Inter-area positions | 20,155 | (7.1) | (2.3) | 21,687 | |
| Other liabilities | 3,915 | 0.2 | (0.5) | 3,908 | |
| Economic capital allocated | 3,416 | (14.7) | (12.8) | 4,007 | |
- (1) Figures at constant exchange rates.
| IFRS 9 | IAS 39 | ||||
|---|---|---|---|---|---|
| Relevant business indicators | 31-12-18 | ∆% | ∆%(1) | 31-12-17 | |
| Performing loans and advances to customers under management (2) | 58,783 | 4.4 | 8.3 | 56,315 | |
| Customer deposits under management (2) | 40,007 | (9.3) | (6.7) | 44,095 | |
| Off-balance sheet funds (3) | 993 | (26.9) | (15.4) | 1,357 | |
| Efficiency ratio (%) | 34.2 | - | - | 34.1 | |
- (1) Figures at constant exchange rates.
- (2) Excluding repos.
- (3) Includes mutual funds, pension funds and other off-balance-sheet funds.
Financial market trends
In the fourth quarter of the year, there was a correction of high risk financial assets. This time, developed countries, in particular the United States, suffered the majority of the adjustment. At first, the downward movement was initiated by a revaluation of the assets at higher interest rates. However, the fear of deceleration of developed economies ended up accentuating the trend. Doubts concerning the disengagement process between the United Kingdom and the European Union, and trade tensions between China and the United States, along with the clash between the European Commission and the Italian government, also contributed to the increasing caution in financial markets. In this environment, the implied volatility in equity and interest rates returned to high levels, close to those reached in the first quarter of 2018. Investors sought refuge in sovereign bonds, which led to a significant decline in debt yields, both in the United States, where they remained at January 2018 levels, as well as in Germany, where they retreated to October 2016 levels.
The central banks continued with their processes of normalization of monetary policies. The Fed raised its benchmark interest rate for the fourth time in the year, to 2.25-2.50%, in December, and maintained the strategy of balance sheet reduction. The ECB, in turn, kept interest rates unchanged, but confirmed the end of the financial assets purchase program in December 2018; however, it will continue to be present in the market through the program for the reinvestment of the principal maturities of its asset portfolio. The economic slowdown and uncertainty caused by Brexit weighed on the euro, which ended the quarter slightly depreciated. The Turkish lira reversed part of the depreciation suffered in the third quarter of 2018. Conversely, the volatility of the Mexican peso remained.
Activity
All the comments below regarding rates of change, for both activity and earnings, will be given at constant exchange rate, unless expressly stated otherwise. These rates, together with changes at the current exchange rate, can be seen in the attached tables of financial statements and relevant business indicators.
The most relevant aspects related to the area’s activity in 2018 were:
- The market conditions remain unchanged, with margins squeezed and excess liquidity. Lending (performing loans under management) grew by 8.3% during the year.
- Positive trend in customer funds which stood in line with the previous quarter (+0.1%), although the year-on-year comparison is negative (-7.0%).
- In the mergers & acquisitions (M&A) business, activity in the Spanish market in 2018 has been positive showing a growth in the number of operations, driven by the rebound of foreign investors. The High liquidity levels, the attractive financing conditions and the economic growth situation in Spain are expected to continue to stimulate the market during 2019.
- In the Equity Capital Markets Unit (ECM), the last quarter of the year has been marked by high levels of volatility that have made it more difficult to complete the operations expected in the primary market. The market for IPOs has suffered especially throughout Europe during 2018, the Spanish market is not an exception to this trend, since significant operations have been canceled or postponed in the last part of the year. Despite the deterioration in the market environment, BBVA has been one of the most active banks measured by the number of primary transactions in the primary Spanish equity market, excluding ABBs and convertibles.
- In 2018, BBVA has consolidated its leadership in the green and sustainable loans, while at the same time it has continued betting on innovation, setting new milestones, particularly with the application of blockchain technology to corporate loans, also using its own platform.
- In the market of the Green Loans, BBVA has been the most active bank globally leading 25 transactions (of the 32 investees) not only in Spain, but also in Mexico, Italy, the United States, Turkey and Peru, highlighting the globalization of this market in strong growth.
- In terms of innovative solutions for its customers, BBVA has been the first entity to apply blockchain technology to the field of corporate financing with 4 formalized operations.
Results
CIB registered a net attributable profit of €1,016m in 2018, a 2.1% less than in 2017. The highlights of the year-on-year changes in the income statement in this aggregate are summarized below:
- Positive performance of net interest income (+16.2% year-on-year), specially in the second half of the year, driven by good performance in the United States, South America and Turkey.
- Net fees and commissions showed a decrease, due to lower activity volume in Corporate Finance.
- Rise in NTI (up 6.4%), that, nevertheless does not offset the lower contribution from other operating income and expenses.
- As a result of the above, the gross income registered an increase of 2.9%, year-on-year.
- Operating expenses closed in line with 2017 (-0.7%), thanks to an adequate management of discretionary costs, which offsets those affected by inflation on emerging economies and by investment in technology.
- Finally, impairment losses on financial assets increased (+175,0%), mainly as a result of higher provision needs, especially in Turkey.