
Income statement
(Million euros at constant exchange rates)
| South America | South America | Growth 12M11/12M10 | |
|---|---|---|---|
| South America | South America | ||
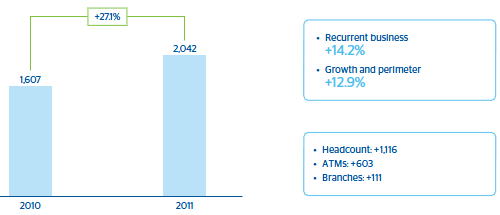
| Net interest income | 3,164 | 760 | 31.6 |
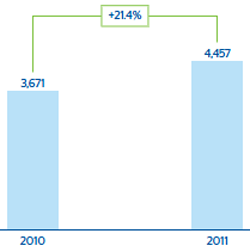
| Gross income | 4,457 | 786 | 21.4 |
| Operating income | 2,415 | 351 | 17.0 |
| Income before tax | 1,877 | 259 | 16.0 |
| Net attributable profit | 1,007 | 141 | 16.2 |
1. Sound business activity in all geographies…
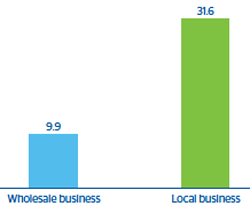
South America. Gross customer lending. Year-on-year change
(As at 31-12-11. Percentage at constant exchange rates)
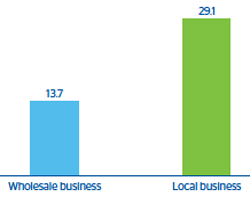
South America. On-balance-sheet customer funds. Year-on-year change
(As at 31-12-11. Percentage at constant exchange rates)
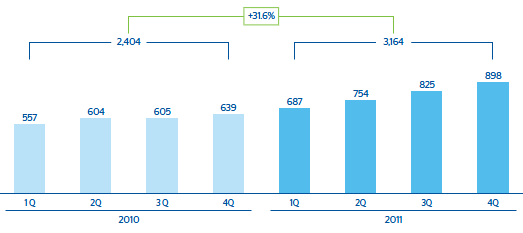
2. …leading to higher revenue. As result, BBVA achieves annual records for net interest income and gross income
South America. Net interest income
(Million euros at constant exchange rates)
South America. Gross income
(Million euros at constant exchange rates)
3. Ambitious growth plans for the region
South America. Operating costs
(Million euros at constant exchange rates)
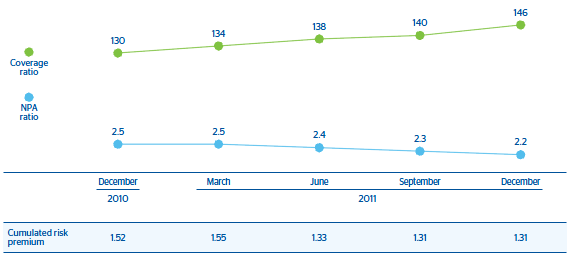
4. The best risk indicators in the Group
NPA and coverage ratios
(Percentage)