
Income statement
(Million euros)
| Spain | 2011 | Growth 12M11/12M10 | |
|---|---|---|---|
| Absolute | Percentage | ||
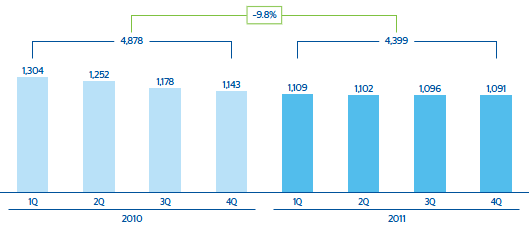
| Net interest income | 4,399 | (478) | (9.8) |
| Gross income | 6,357 | (698) | (9.9) |
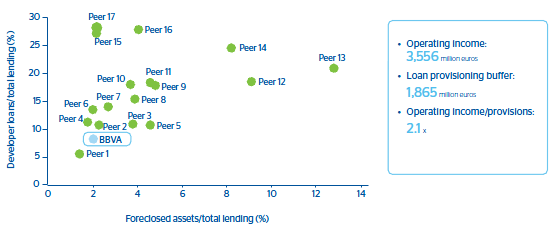
| Operating income | 3,556 | (684) | (16.1) |
| Income before tax | 1,914 | (1,246) | (39.4) |
| Net attributable profit | 1,363 | (892) | (39.5) |
1. Stable net interest income
Spain. Customer spread
(Percentage)

Spain. Net interest income
(Million euros)
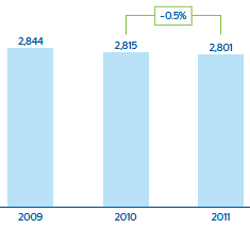
2. Costs: contained since start of crisis
Spain. Operating costs
(Million euros)
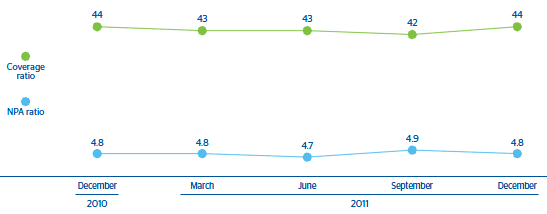
3. Stable risk indicators
Spain. NPA and coverage ratios
(Percentage)
4. Better starting point to meet new regulatory requirements related to developers
Exposure to real estate assets with difficulties. BBVA Spain vs financial sector
(Figures at June 2011)