Increasing shareholder’s distribution significantly
/share(2,3)
attributable
profit(4)
/share
/share
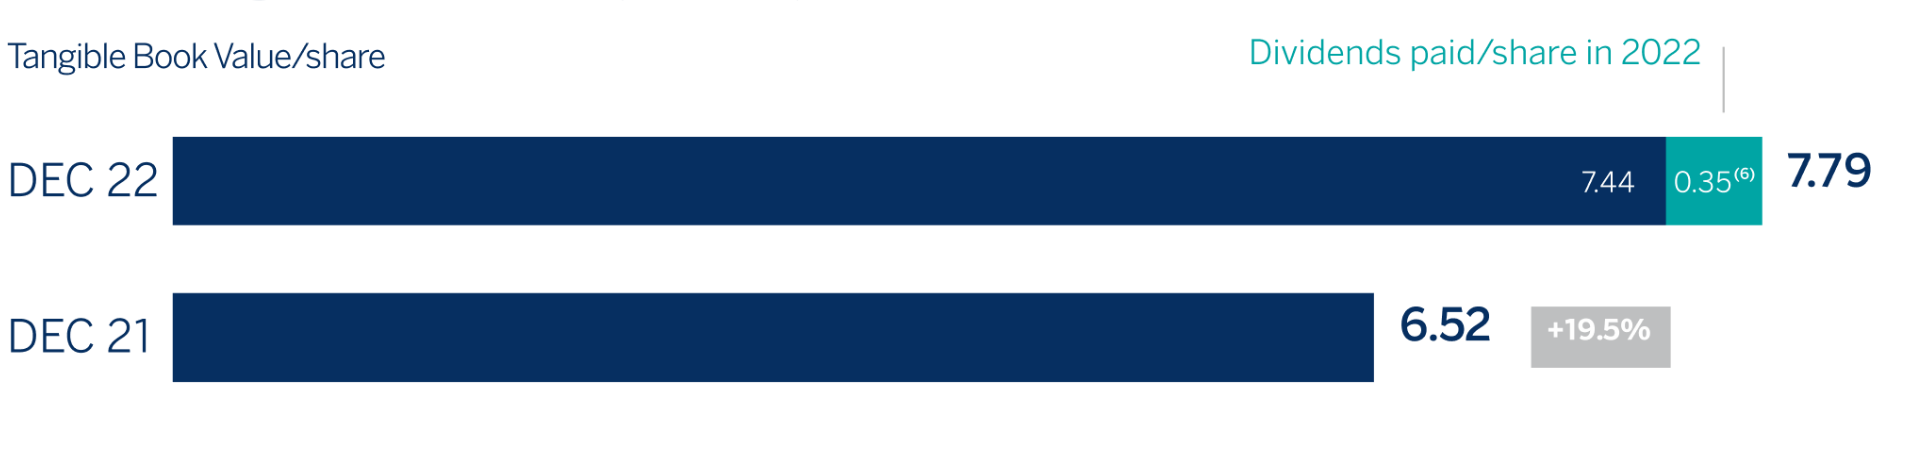
/share
/share
Value creation (€ / share)
(1) Pending approval from the governing bodies, and in the case of the share buy-back program subject to further supervisory approval.
(2) Gross figures.
(3) Includes cash dividend for an amount of €43 cents per share and the share buy-back program for €422M, which is equivalent to €7 cents per share.
(4) This ratio is calculated taking into account the following: (i) 2022 reported results (€6,420M) and (ii) considering outstanding shares cum dividend as of January 31, 2023.
(5) The share buy-back program amount would be equivalent to €7 cents per share.
(6) Includes amounts paid in April and October 2022, which amounted to €0.23 (gross) and €0.12 (gross) per share.
BBVA Group main data
| Consolidated Figures | 31-12-22 | ∆% | 31-12-21 | 31-12-20 |
|---|---|---|---|---|
| Balance sheet (millions of euros) | ||||
| Total assets | 713,140 | 7.6 | 662,885 | 733,797 |
| Loans and advances to customers (gross) (1) | 369,260 | 11.9 | 330,055 | 323,252 |
| Deposits from customers (1) | 393,856 | 12.6 | 349,761 | 342,661 |
| Total customer funds (1) | 544,028 | 9.5 | 496,954 | 471,928 |
| Total equity | 50,615 | 3.8 | 48,760 | 50,020 |
| Income statement (millions of euros) | ||||
| Net interest income | 19,153 | 30.4 | 14,686 | 14,592 |
| Gross income | 24,890 | 18.2 | 21,066 | 20,166 |
| Operating income | 14,130 | 22.5 | 11,536 | 11,079 |
| Net attributable profit (loss) | 6,420 | 38.0 | 4,653 | 1,305 |
| Net attributable profit (loss) excluding non-recurring impacts (2) | 6,621 | 30.6 | 5,069 | 2,729 |
| The BBVA share and share performance ratios | ||||
| Number of shares issued (million) | 6,030 | (9.6) | 6,668 | 6,668 |
| Share price (euros) | 5.63 | 7.3 | 5.25 | 4.04 |
| Earning (loss) per share excluding non-recurring impacts (euros) (2)(3) | 1.05 | 48.1 | 0.71 | 0.35 |
| Earning (loss) per share (euros) (3)(4) | 0.99 | 47.1 | 0.67 | 0.14 |
| Book value per share (euros) (3)(4) | 7.80 | 13.7 | 6.86 | 6.70 |
| Tangible book value per share (euros) (3)(4) | 7.44 | 14.1 | 6.52 | 6.05 |
| Market capitalization (millions of euros) | 33,974 | (3.0) | 35,006 | 26,905 |
| Yield (dividend/price; %) (5) | 6.2 | 2.6 | 4.0 | |
| Significant ratios (%) | ||||
| ROE (net attributable profit (loss) excluding non-recurring impacts / average shareholders' funds +/- average accumulated other comprehensive income (2) | 14.6 | 11.4 | 6.1 | |
| ROTE (net attributable profit (loss) excluding non-recurring impacts / average shareholders' funds excluding average intangible assets +/- average accumulated other comprehensive income) (2) | 15.3 | 12.0 | 6.5 | |
| ROA (Profit (loss) for the period excluding non-recurring impacts / average total assets - ATA) (2) | 1.00 | 0.94 | 0.54 | |
| RORWA (Profit (loss) for the period excluding non-recurring impacts / average risk-weighted assets - RWA) (2) | 2.14 | 2.01 | 1.16 | |
| Efficiency ratio | 43.2 | 45.2 | 45.1 | |
| Cost of risk (6) | 0.91 | 0.93 | 1.55 | |
| NPL ratio (6) | 3.4 | 4.1 | 4.2 | |
| NPL coverage ratio (6) | 81 | 75 | 82 | |
| Capital adequacy ratios (%) | ||||
| CET1 fully-loaded | 12.61 | 12.75 | 11.73 | |
| CET1 phased-in (7) | 12.68 | 12.98 | 12.15 | |
| Total ratio phased-in (7) | 15.98 | 17.24 | 16.46 | |
| Other information | ||||
| Number of clients (million) (1) | 89.3 | 8.6 | 82.2 | 78.8 |
| Number of shareholders | 801,216 | (3.1) | 826,835 | 879,226 |
| Number of employees | 115,675 | 4.7 | 110,432 | 123,174 |
| Number of branches | 6,040 | (0.7) | 6,083 | 7,432 |
| Number of ATMs | 29,807 | 2.3 | 29,148 | 31,000 |
(1) Excludes BBVA USA and the rest of the companies in the United States sold to PNC on June 1, 2021 and BBVA Paraguay for the period 31-12-20.
(2) Non-recurring impacts include: (I) in 2022, the net impact arisen from the purchase of offices in Spain; (II) in 2021, the net costs related to the restructuring process; (III) in 2020, the net capital gain from the bancassurance operation with Allianz; and (IV) in 2021 and 2020, the profit (loss) generated by BBVA USA and the rest of the companies in the United States sold to PNC on June 1, 2021.
(3) For the adjusted earning (loss) per share and earning (loss) per share calculation the additional Tier 1 instrument remuneration is adjusted. As of 31-12-21, 112 million shares acquired within the share buyback program in 2021 were considered.
(4) For the period 31-12-21, the estimated number of shares pending from buyback as of December 31, 2021 of the first tranche approved by the BBVA Board of Directors in October 2021 (€1,500m), in process at the end of the year 2021, was included.
(5) Calculated by dividing shareholder remuneration over the last twelve months by the closing price of the period.
(6) Excluding BBVA USA and the rest of the companies in the United States sold to PNC on June 1, 2021.
(7) Phased-in ratios include the temporary treatment on the impact of IFRS 9, calculated in accordance with Article 473 bis amendments of the Capital Requirements Regulation (CRR), introduced by the Regulation (EU) 2020/873.
The highest results ever
This result was possible, mainly thank to the strong income increase, boosted by the loans double-digit growth (+13.3% in constant euros vs. 2021).
(1) Net interest incorne + Commissions.
Consolidated Income Statement
Millions of euros
| 2022 | ∆% | ∆% at constant exchange rates |
2021 | |
|---|---|---|---|---|
| Net interest income | 19,153 | 30.4 | 35.8 | 14,686 |
| Net fees and commissions | 5,353 | 12.3 | 15.3 | 4,765 |
| Net trading income | 1,938 | 1.5 | 9.4 | 1,910 |
| Other operating income and expenses | (1,555) | n.s. | n.s. | (295) |
| Gross income | 24,890 | 18.2 | 22.9 | 21,066 |
| Operating expenses | (10,760) | 12.9 | 15.5 | (9,530) |
| Operating income | 14,130 | 22.5 | 29.2 | 11,536 |
| Impairment on financial assets | (3,379) | 11.4 | 12.9 | (3,034) |
| Provisions or reversal of provisions and other gains (losses) | (261) | (0.3) | (4.6) | (262) |
| Profit (loss) before tax | 10,490 | 27.3 | 36.7 | 8,240 |
| Income tax | (3,462) | 56.9 | 66.0 | (2,207) |
| Profit (loss) for the year | 7,028 | 16.5 | 25.7 | 6,034 |
| Non-controlling interests | (407) | (57.8) | (30.3) | (965) |
| Net attributable profit (loss) excluding non-recurring impacts | 6,621 | 30.6 | 32.3 | 5,069 |
| Non-recurring impacts (1) | (201) | (51.6) | (47.7) | (416) |
| Net attributable profit (loss) | 6,420 | 38.0 | 39.0 | 4,653 |
(1) Include: (I) the net impact arisen from the purchase of offices in Spain in 2022 for €-201m; (II) the net costs related to the restructuring process in 2021 for €-696m; and (III) the profit (loss) generated by BBVA USA and the rest of the companies in the United States sold to PNC on June 1, 2021 for +280 million euros.
Business areas
Spain

€6,145 Mill.*
+4.3%
Highlights
- Lending growth in the most profitable segments in 2022
- Double-digit operating income growth
- Significant improvement in efficiency in the year
- Solid risk indicators, with a reduction of both the non-performing loans balance and the NPL ratio in 2022
Results
(Millions of euros. Year on year
changes)
Net interest income
3,784Gross income
6,145Operating income
3,226Net attributable profit
1,678Activity (1)
Variation compared to 31-12-21 at constant
exchange rate.
Balances as of 31-12-22.
Performing loans and advances to customers under mangement
+1.8%
Customers funds under management
+2.1%
Risks
NPL coverage ratio
NPL ratio
Cost of risk
(1) Excluding repos.
Mexico
€10,839 Mill.*
+25.9%(1)
Highlights
- Balanced and double-digit growth in both the wholesale and retail portfolio in the year
- Very positive performance of recurring income due to increased activity and improved customer spreads
- Risk indicators improvement and outstanding performance of the efficiency ratio
- Excellent evolution of the operating income
Results
(Millions of euros. Year on year changes at
constant exchange rate)
Net interest income
8,378Gross income
10,839Operating income
7,406Net attributable profit
4,182Activity (1)
Variation compared to 31-12-21 at constant
exchange rate.
Balances as of 31-12-22.
Performing loans and advances to customers under mangement
+16.5%
Customers funds under management
+8.2%
Risks
NPL coverage ratio
NPL ratio
Cost of risk
(1) Excluding repos.
Turkey
3,185 Mill.*
Highlights
- Acceleration of local currency portfolio and reduction of exposure to foreign currency portfolios
- Strength of risk indicators
- Net attributable profit impacted by the hyperinflation accounting, with effect from January 1, 2022, partially offset by the good dynamics of the business
Results
(Millions of euros)
Net interest income
2,631Gross income
3,185Operating income
2,119Net attributable profit
509Activity (1)
Variation compared to 31-12-21 at constant
exchange rate.
Balances as of 31-12-22.
Performing loans and advances to customers under mangement
+59.2%
Customers funds under management
+63.0%
Risks
NPL coverage ratio
NPL ratio
Cost of risk
(1) Excluding repos.
South America
€4,261 Mill.*
+45.1%(2)
Highlights
- Growth in lending activity and customer funds
- NPL and NPL coverage ratio improvement
- Favorable behavior of recurring income
- Improvement of the efficiency ratio
Results
(Millions of euros. Year on year changes at
constant exchange rates)
Net interest income
4,137Gross income
4,261Operating income
2,284Net attributable profit
734Activity (1)
Variation compared to 31-12-21 at constant
exchange rates.
Balances as of 31-12-22.
Performing loans and advances to customers under mangement
+13.7%
Customers funds under management
+14.0%
Risks
NPL coverage ratio
NPL ratio
Cost of risk
(1) Excluding repos.
Rest of Business
€790 Mill.*
-1.1%(2)
Highlights
- Growth in lending activity and in customer funds in 2022
- Strong net interest income, which grows at double-digit
- Risk indicators improvement in the year
- Cost of risk at very low levels
Results
(Millions of euros. Year on year changes at
constant exchange rates)
Net interest income
332Gross income
790Operating income
276Net attributable profit
240Activity (1)
Variation compared to 31-12-21 at constant
exchange rates.
Balances as of 31-12-22.
Performing loans and advances to customers under mangement
+36.5%
Customers funds under management
+47.2%
Risks
NPL coverage ratio
NPL ratio
Cost of risk
(1) Excluding repos.
* Gross income
(1) Year on year changes at constant exchange rate.
(2) Year on year changes at constant exchange rates.
Data at the end of December 2022. Those countries in which BBVA has no legal entity or the volume of activity is not significant, are not included
Data at the end of December 2022.
Geographical diversification (1)
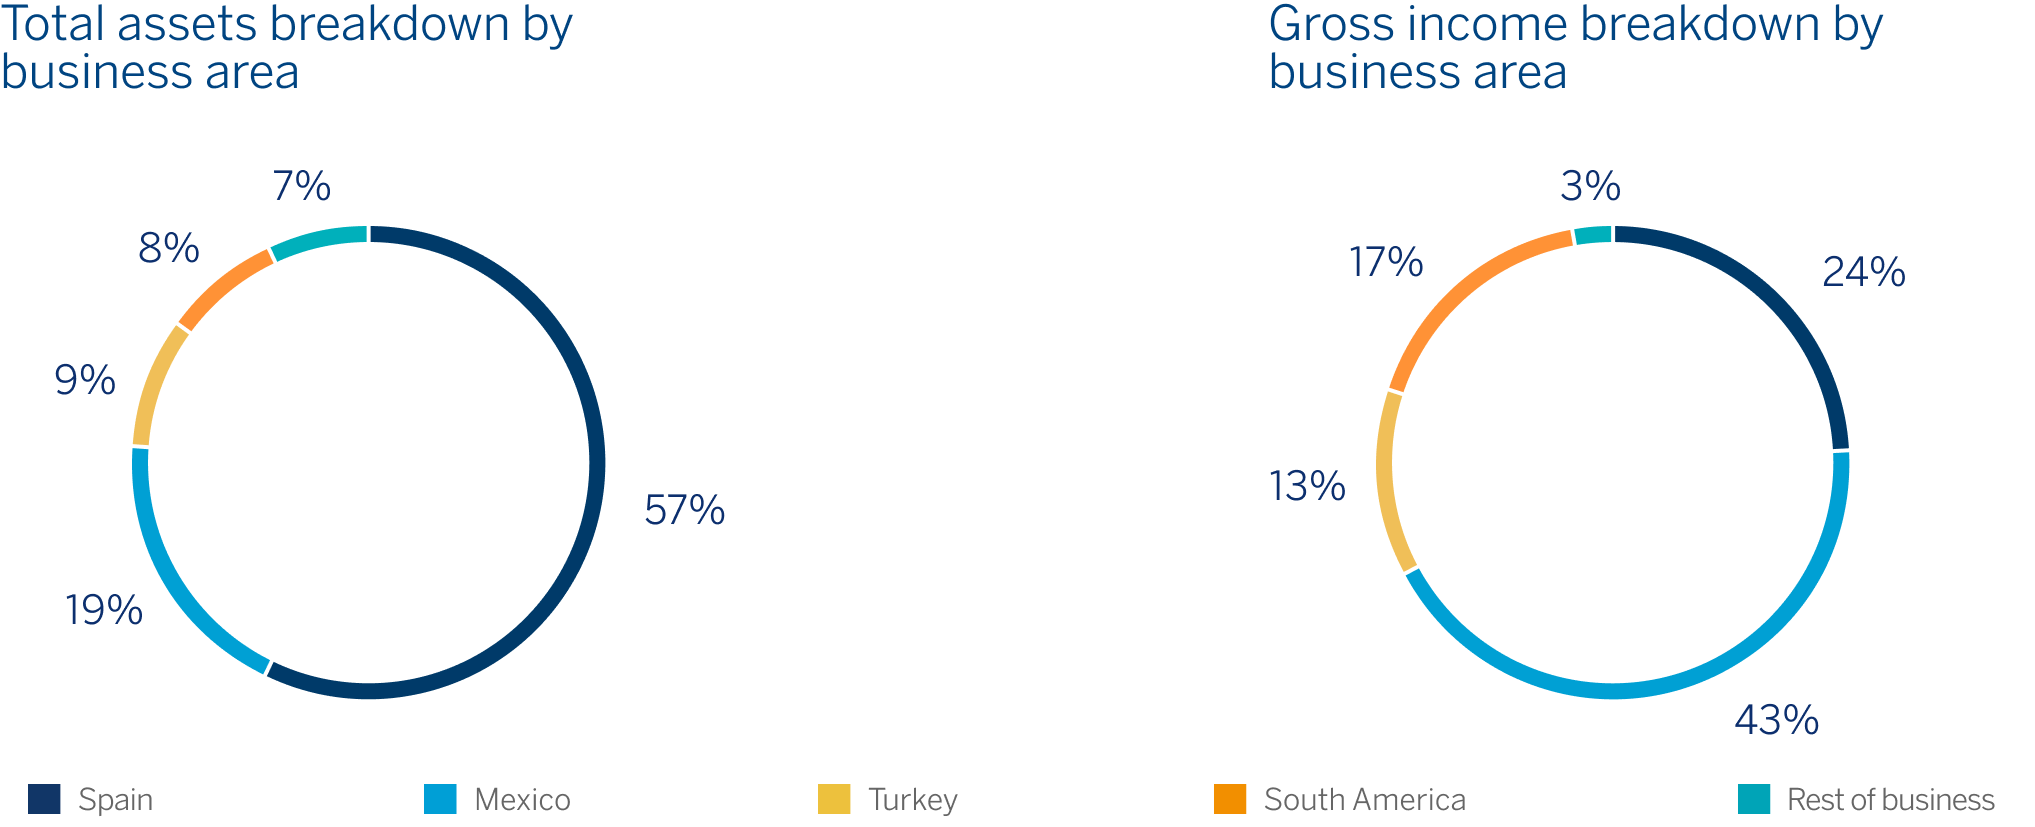
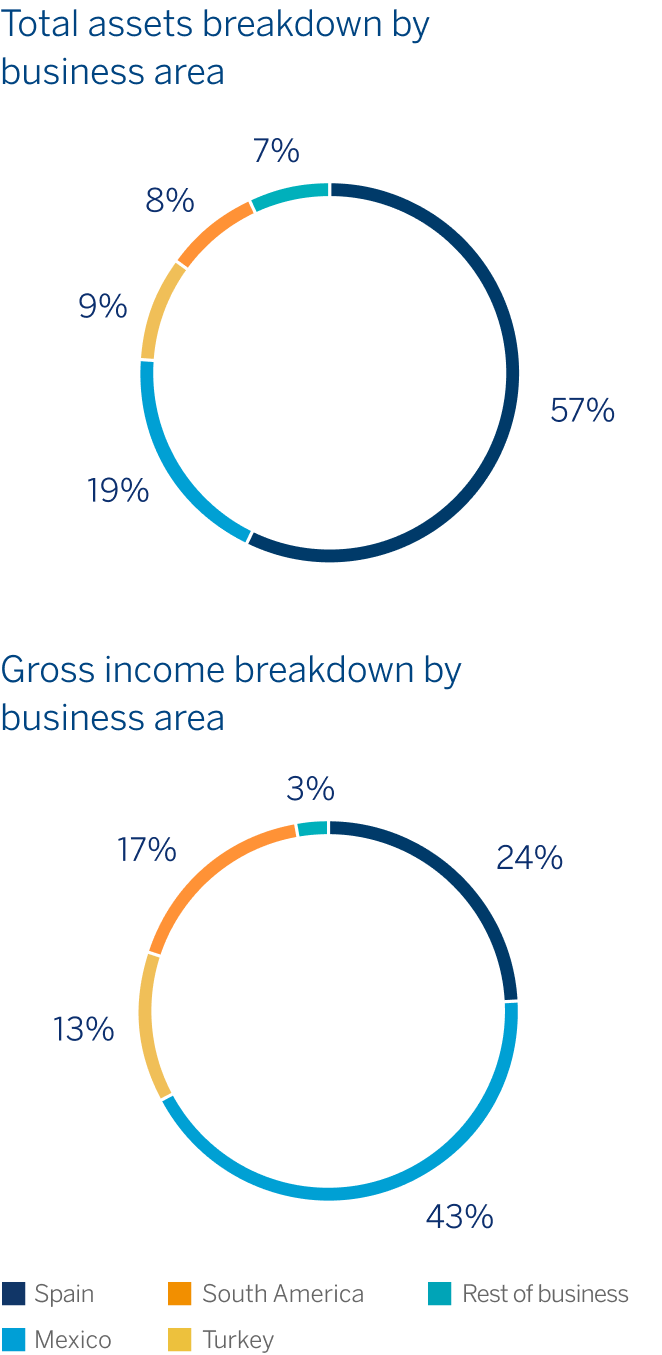
(1) Excludes the Corporate Center.