Business areas
This section presents and analyzes the most relevant aspects of the Group's different business areas. Specifically, it shows a summary of the income statement and balance sheet, the business activity figures and the most significant ratios in each of them.
At the closing of 2018 the reporting structure of BBVA Group's business areas remained basically the same even if its composition differs from the one presented in 2017 due to the sale of BBVA Chile announced on November 28, 2017, and which was closed on July 6, 2018. This operation, which has affected the composition of the business area of South America, will be detailed in the following sections as well as the rest of the Group’s business areas:
- Banking activity in Spain includes the Retail Network in Spain, Corporate and Business Banking (CBB), Corporate & Investment Banking (CIB), BBVA Seguros and Asset Management units in Spain. It also includes the new loan production to developers or loans that are no longer in difficulties as well as the portfolios, funding and structural interest-rate positions of the euro balance sheet.
- Non Core Real Estate covers the specialized management in Spain of loans to developers in difficulties and real-estate assets mainly coming from foreclosed assets, originated from both, residential mortgages, as well as loans to developers. On November 29, 2017, BBVA Group signed an agreement with Cerberus Capital Management, L.P. (Cerberus) for the creation of a joint venture in which the real-estate business area of BBVA in Spain would be transferred. At a later stage, 80% of this entity would be sold to a subsidiary of Cerberus (Divarian). On October 10, 2018, the stated operation was closed and, at the close of 2018, the participation in Divarian which BBVA maintains at 20%, is recorded in the Corporate Center.
- The United States includes the Group's business activity in the country through the BBVA Compass group and the BBVA New York branch.
- Mexico basically includes all the banking and insurance businesses carried out by the Group in the country. Since 2018 it has also included the BBVA Bancomer branch in Houston (in previous years located in the United States). Consequently, the figures from previous years have been reworked to incorporate this change and show comparable series.
- Turkey includes the activity of the Garanti group.
- South America basically includes BBVA's banking and insurance businesses in the region. On July 6, 2018, the sale of BBVA Chile to The Bank of Nova Scotia (Scotiabank) was completed which affects the comparability of the results, the balance sheet, the activity and the most significant ratios of this business area with prior periods.
- The Rest of Eurasia includes the Group's retail and wholesale business activity in the rest of Europe and Asia.
In addition to the above, all the areas include a remainder made up basically of other businesses and a supplement that includes deletions and allocations not assigned to the units making up the above areas.
Lastly, the Corporate Center is an aggregate that contains the rest of the items that have not been allocated to the business areas, as it corresponds to the Group's holding function. It includes: the costs of the head offices that have a corporate function; management of structural exchange-rate positions; specific issues of equity instruments to ensure adequate management of the Group’s global solvency; portfolios and their corresponding results, whose management is not linked to customer relations, such as industrial holdings; certain tax assets and liabilities; funds due to commitments with employees; goodwill and other intangibles. At the close of 2018, the participation in Davarian, which BBVA maintains at 20%, is included in this unit.
Finally, as usual, in the case of the Americas, Turkey and CIB areas, the results of applying constant exchange rates are given in addition to the year-on-year variations at current exchange rates.
The information by areas is based on units at the lowest level and/or companies making up the Group, which are assigned to the different areas according to the main geographical area in which they carry out their activity.
Major income statement items by business area (Millions of Euros)
| Business areas | ||||||||||
|---|---|---|---|---|---|---|---|---|---|---|
| BBVA Group | Banking activity in Spain | Non Core Real Estate | The United States | Mexico | Turkey | South America | Rest of Eurasia | ∑ Business areas | Corporate Center | |
| 2018 | ||||||||||
| Net interest income | 17,591 | 3,672 | 32 | 2,276 | 5,568 | 3,135 | 3,009 | 175 | 17,867 | (276) |
| Gross income | 23,747 | 5,943 | 38 | 2,989 | 7,193 | 3,901 | 3,701 | 415 | 24,179 | (432) |
| Operating income | 12,045 | 2,680 | (28) | 1,127 | 4,825 | 2,658 | 2,011 | 124 | 13,397 | (1,352) |
| Profit/(loss) before tax | 7,580 | 2,017 | (129) | 919 | 3,294 | 1,448 | 1,307 | 144 | 9,000 | (1,420) |
| Net attributable profit | 5,324 | 1,522 | (78) | 735 | 2,384 | 569 | 591 | 93 | 5,818 | (494) |
| 2017 | ||||||||||
| Net interest income | 17,758 | 3,738 | 71 | 2,119 | 5,476 | 3,331 | 3,200 | 180 | 18,115 | (357) |
| Gross income | 25,270 | 6,180 | (17) | 2,876 | 7,122 | 4,115 | 4,451 | 468 | 25,196 | 73 |
| Operating income | 12,770 | 2,790 | (116) | 1,025 | 4,671 | 2,612 | 2,444 | 160 | 13,585 | (815) |
| Profit/(loss) before tax | 6,931 | 1,854 | (656) | 748 | 2,984 | 2,147 | 1,691 | 177 | 8,944 | (2,013) |
| Net attributable profit | 3,519 | 1,374 | (490) | 486 | 2,187 | 826 | 861 | 125 | 5,368 | (1,848) |
Gross income (1), operating income (1) and net attributable profit breakdown (1) (Percentage. 2018)
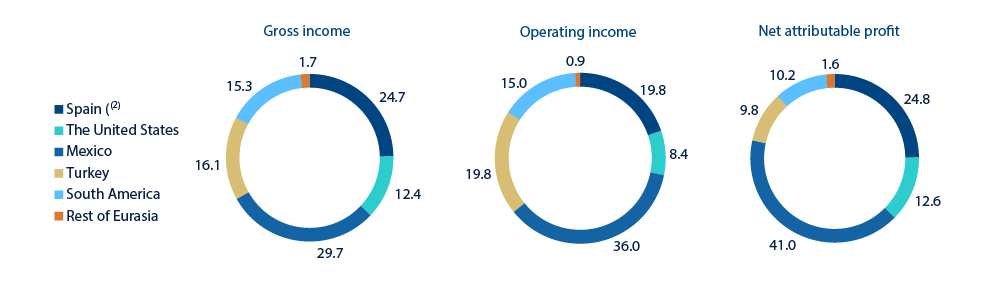
(1) Excludes the Corporate Center.
(2) Includes the areas Banking activity in Spain and Non Core Real Estate.
Major balance-sheet items and risk-weighted assets by business area (Millions of Euros)
| Business areas | |||||||||||
|---|---|---|---|---|---|---|---|---|---|---|---|
| BBVA Group | Banking activity in Spain | Non Core Real Estate | The United States | Mexico | Turkey | South America | Rest of Eurasia | ∑ Business areas | Corporate Center | AyPNCV variation (1) | |
| 31-12-18 | |||||||||||
| Loans and advances to customers | 374,027 | 169,856 | 582 | 60,808 | 51,101 | 41,478 | 34,469 | 15,731 | 374,027 | ||
| Deposits from customers | 375,970 | 180,891 | 36 | 63,891 | 50,530 | 39,905 | 35,842 | 4,876 | 375,970 | ||
| Off-balance sheet funds | 98,150 | 62,557 | 2 | 20,647 | 2,894 | 11,662 | 388 | 98,150 | |||
| Total assets/liabilities and equity | 676,689 | 335,294 | 4,163 | 82,057 | 96,455 | 66,250 | 52,385 | 18,000 | 654,605 | 22,084 | |
| Risk-weighted assets | 348,254 | 100,950 | 3,022 | 64,146 | 53,359 | 56,486 | 42,736 | 15,449 | 336,149 | 12,105 | |
| 31-12-17 | |||||||||||
| Loans and advances to customers | 387,621 | 183,172 | 3,521 | 53,718 | 45,768 | 51,378 | 48,272 | 14,864 | 400,693 | (13,072) | |
| Deposits from customers | 376,379 | 177,763 | 13 | 60,806 | 49,964 | 44,691 | 45,666 | 6,700 | 385,604 | (9,225) | |
| Off-balance sheet funds | 98,005 | 62,054 | 4 | 19,472 | 3,902 | 12,197 | 376 | 98,005 | |||
| Total assets/liabilities and equity | 690,059 | 319,417 | 9,714 | 75,775 | 94,061 | 78,694 | 74,636 | 17,265 | 669,562 | 20,497 | |
| Risk-weighted assets | 361,686 | 108,141 | 9,692 | 58,688 | 44,941 | 62,768 | 55,975 | 15,150 | 355,354 | 6,332 | |
- (1) Includes non-current assets and liabilities held for sale (AyPNCV for its acronym in Spanish) of the BBVA Chile and real estate operations.
Interest rates (Quarterly averages. Percentage)
| 2018 | 2017 | |||||||
|---|---|---|---|---|---|---|---|---|
| 4Q | 3Q | 2Q | 1Q | 4Q | 3Q | 2Q | 1Q | |
| Official ECB rate | 0.00 | 0.00 | 0.00 | 0.00 | 0.00 | 0.00 | 0.00 | 0.00 |
| Euribor 3 months | (0.32) | (0.32) | (0.33) | (0.33) | (0.33) | (0.33) | (0.33) | (0.33) |
| Euribor 1 year | (0.14) | (0.17) | (0.19) | (0.19) | (0.19) | (0.16) | (0.13) | (0.10) |
| USA Federal rates | 2.28 | 2.01 | 1.81 | 1.58 | 1.30 | 1.25 | 1.05 | 0.80 |
| TIIE (Mexico) | 8.26 | 8.11 | 7.88 | 7.84 | 7.42 | 7.37 | 7.04 | 6.41 |
| CBRT (Turkey) | 24.00 | 19.29 | 14.82 | 12.75 | 12.17 | 11.97 | 11.80 | 10.10 |
Exchange rates (Expressed in currency/euro)
| Year-end exchange rates | Average exchange rates | ||||
|---|---|---|---|---|---|
31-12-18 |
∆% on 31-12-17 |
∆% on 30-09-18 |
2018 |
∆% on 2017 |
|
| Mexican peso | 22.4921 | 5.2 | (3.2) | 22.7046 | (6.1) |
| U.S. dollar | 1.1450 | 4.7 | 1.1 | 1.1810 | (4.3) |
| Argentine peso | 43.2900 | (47.8) | 5.7 | 43.2900 | (56.7) |
| Chilean peso | 795.54 | (7.2) | (3.8) | 757.00 | (3.2) |
| Colombian peso | 3,745.32 | (4.3) | (7.6) | 3,484.32 | (4.3) |
| Peruvian sol | 3.8621 | 0.5 | (1.2) | 3.8787 | (5.1) |
| Turkish lira | 6.0588 | (25.0) | 15.0 | 5.7058 | (27.8) |
Banking activity in Spain
Highlights
- Activity growth in high profitable segments.
- Good performance of net fees and commissions.
- Operating expenses decline during all quarters.
- Solid asset-quality indicators: lower impairments and provisions.
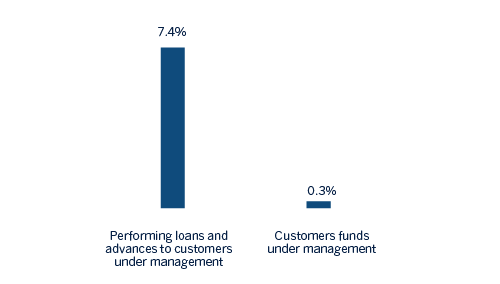
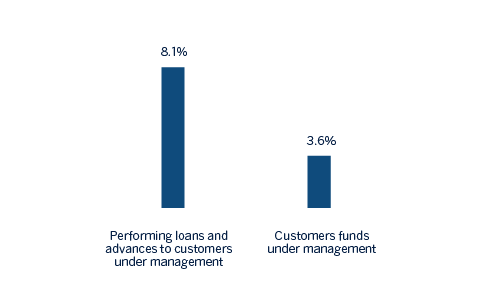
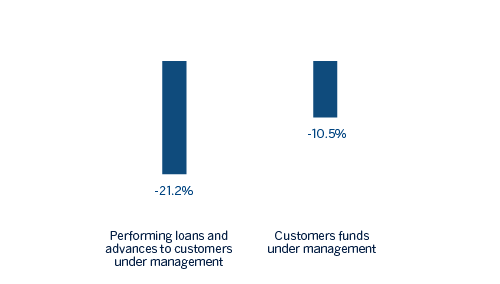
Business activity (1)
(Year-on-year change. Data as of 31-12-18)

(1) Excluding repos.
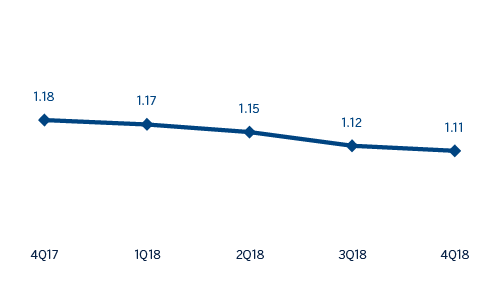
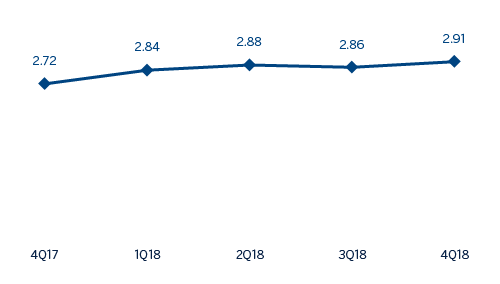
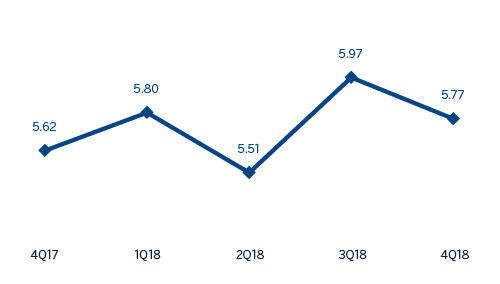
Net interest income/ATAs
(Percentage)
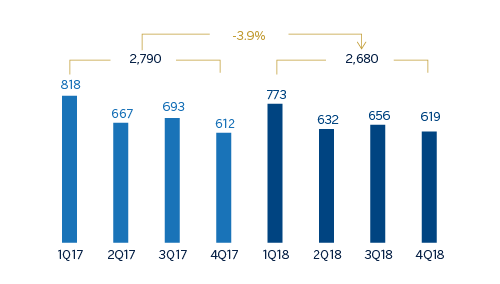
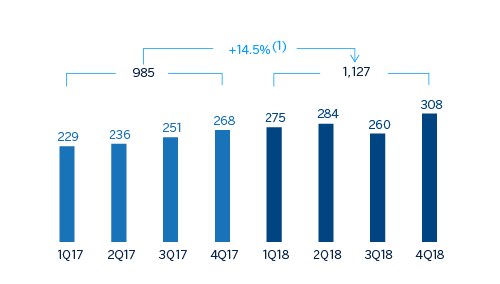
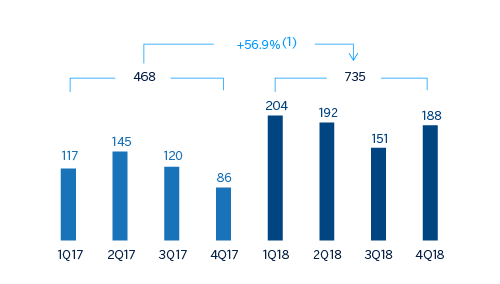
Operating income (Millions of Euros)
Net attributable profit (Millions of Euros)

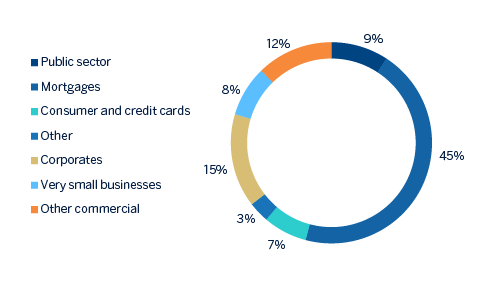
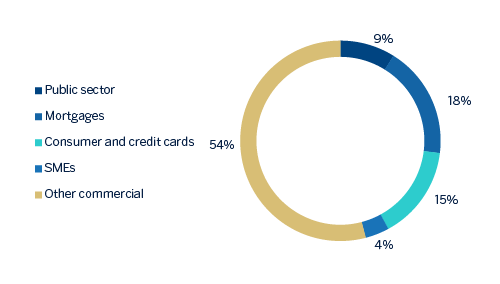
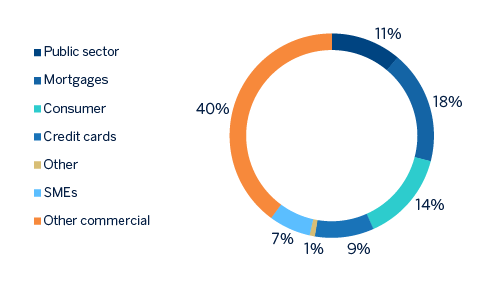
Breakdown of performing loans under management (1)
(31-12-18)
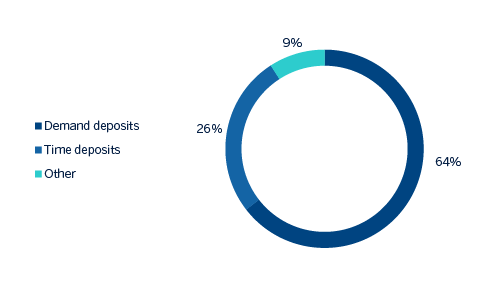
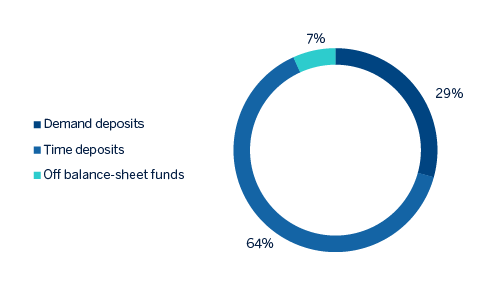
Breakdown of customer funds under management (1)
(31-12-18)
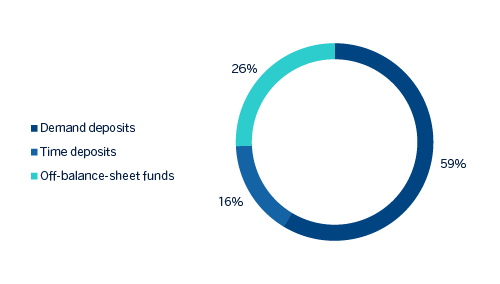
(1) Excluding repos.
(1) Excluding repos.
Financial statements and relevant business indicators (Millions of Euros and percentage)
| Income statement | IFRS 9 | IAS 39 | |
|---|---|---|---|
| 2018 | ∆% | 2017 | |
| Net interest income | 3,672 | (1.8) | 3,738 |
| Net fees and commissions | 1,681 | 7.7 | 1,561 |
| Net trading income | 466 | (16.1) | 555 |
| Other operating income and expenses | 124 | (62.0) | 327 |
| of which Insurance activities (1) | 485 | 12.0 | 433 |
| Gross income | 5,943 | (3.8) | 6,180 |
| Operating expenses | (3,262) | (3.8) | (3,390) |
| Personnel expenses | (1,862) | (2.9) | (1,917) |
| Other administrative expenses | (1,113) | (3.6) | (1,154) |
| Depreciation | (288) | (9.8) | (319) |
| Operating income | 2,680 | (3.9) | 2,790 |
| Impairment on financial assets not measured at fair value through profit or loss | (371) | (34.6) | (567) |
| Provisions or reversal of provisions and other results | (292) | (20.9) | (369) |
| Profit/(loss) before tax | 2,017 | 8.8 | 1,854 |
| Income tax | (492) | 3.1 | (477) |
| Profit/(loss) for the year | 1,525 | 10.8 | 1,377 |
| Non-controlling interests | (3) | 7.1 | (3) |
| Net attributable profit | 1,522 | 10.8 | 1,374 |
- (1) Includes premiums received net of estimated technical insurance reserves.
| Balance sheets | IFRS 9 | IAS 39 | |
|---|---|---|---|
| 31-12-18 | ∆% | 31-12-17 | |
| Cash, cash balances at central banks and other demand deposits | 27,841 | 106.8 | 13,463 |
| Financial assets designated at fair value | 100,094 | 25.9 | 79,501 |
| of which loans and advances | 28,451 | n.s. | 1,312 |
| Financial assets at amortized cost | 193,936 | (12.4) | 221,391 |
| of which loans and advances to customers | 169,856 | (7.3) | 183,172 |
| Inter-area positions | 7,314 | n.s. | 1,806 |
| Tangible assets | 1,263 | 44.1 | 877 |
| Other assets | 4,846 | 103.6 | 2,380 |
| Total assets/liabilities and equity | 335,294 | 5.0 | 319,417 |
| Financial liabilities held for trading and designated at fair value through profit or loss | 66,255 | 80.0 | 36,817 |
| Deposits from central banks and credit institutions | 44,043 | (29,2) | 62.226 |
| Deposits from customers | 180,891 | 1.8 | 177,763 |
| Debt certificates | 30,451 | (8.6) | 33,301 |
| Inter-area positions | |||
| Other liabilities | 5,756 | n.s. | 391 |
| Economic capital allocated | 7,898 | (11.5) | 8,920 |
| Relevant business indicators | 31-12-18 | ∆% | 31-12-17 |
|---|---|---|---|
| Performing loans and advances to customers under management (1) | 166,131 | (0.7) | 167,291 |
| Non-performing loans | 9,101 | (16.0) | 10,833 |
| Customer deposits under management (1) | 181,119 | 3.6 | 174,822 |
| Off-balance sheet funds (2) | 62,557 | 0.8 | 62,054 |
| Risk-weighted assets | 100,950 | (6.6) | 108,141 |
| Efficiency ratio (%) | 54.9 | 54.9 | |
| NPL ratio (%) | 4.6 | 5.5 | |
| NPL coverage ratio (%) | 57 | 50 | |
| Cost of risk (%) | 0.21 | 0.32 |
- (1) Excluding repos.
- (2) Includes mutual funds, pension funds and other off-balance sheet funds.
Macro and industry trends
According to the latest information from the National Institute of Statistics (INE for its acronym in Spanish), the Spanish economy grew 0.6% on a quarterly basis during the the third quarter of 2018, consolidating a solid growth throughout the year but at a more moderate pace than the two previous years. The most recent indicators show that this progress of the GDP has continued in the last quarter of 2018, supported by robust domestic factors related to the improvement of the labor market and favorable financial conditions. Both monetary and fiscal policy continue to support growth, while the depreciation of the euro and demand in the euro zone must continue to support exports. All in all, the economy could have grown around 2.5% in 2018.
Regarding the Spanish banking system and according to October 2018 data from the Bank of Spain (latest published data), the total volume of lending to the private sector (household and corporate) continued to decline year-on-year (down 3.0%). Non-performing loans in the sector decreased significantly (down 28.2% year-on-year as of October 2018) driven by the completion of several transactions of non-performing loans and real-estate assets during 2018. At the end of October, the sector’s NPL ratio was 6.08%, that is 26.0% below the figure registered in the previous year.
Activity
The most relevant aspects related to the area’s activity during 2018 were:
- Lending (performing loans under management) closed in line with the figure at the end of December 2017 (down 0.7% year-on-year), mainly due to the reduction in the mortgage portfolio (down 3.6%) and other commercial portfolios (-11.2%). In contrast, consumer financing and credit cards maintained a very positive performance (during the course of the year up 21.9%), which, together with the good evolution of the SME portfolio (+6.5%), offset the reduction of mortgage loans. In the last three months of 2018 there has been a transfer of outstanding portfolio of performing loans from Non Core Real Estate to Banking Activity in Spain, amounting to €60m, which, in addition to the e one completed in the first semester amounts to a total of €260m in the year.
- In asset quality, the non-performing loans balance showed a downward trend over the year that positively affected the area’s NPL ratio, which reduced to 4.6% from the 5.5% as of 31-December-2017. The NPL coverage ratio closed at 57%, 660 basis points above the closing of 2017.
- Customer deposits under management grew by 3.6% compared to the close of December 2017 (up 3.5% in the last quarter of 2018). By products, there was a decline in time deposits (down 20.4% year-on-date), that has by far offset by the increase in demand deposits (up 12.7%), which as of December represent approximately 80% of total liabilities.
- The off-balance-sheet funds funds showed a slight increase with respect to the figure registered twelve months before (+0.8%), despite of the unfavorable evolution of the markets, especially in the last quarter.
Results
The net attributable profit generated by the Banking Activity in Spain in 2018 reached €1,522m, which represents a year-on-year increase of 10.8%, strongly supported by the favorable performance of commissions, a strict control of operating expenses and provisions. The highlights of the area’s income statement are:
- Net interest income a decline of 1.8% year-on-year although it increased slightly in the fourth quarter of 2018 (+1.2%). The smaller contribution from targeted longer-term refinancing operations (TLTRO) explained most of this evolution.
- Positive performance of net fees and commissions (up 7.7% year-on-year), which offset by far the decline in net interest income. There was a significant contribution from asset management fees and banking commissions.
- Lower contribution from NTI compared to the same period of previous year (down 16.1%), associated with lower ALCO portfolio sales in 2018.
- Reduction in other income/expenses (down 62.0% year-on-year). One of the aspects explaining this is the greater contribution made to the DGF and SRF compared to 2017. Also, net earnings from the insurance business showed an increase of 12.0%.
- Operating expenses declined by 3.8% and the efficiency ratio closed at 54.9%, in line with the figure registered at the close of 2017.
- Decline in impairment losses on financial assets (down 34.6% year-on-year) explained by lower gross additions to NPLs and loan-loss provisions for large customers. As a result, the cumulative cost of risk stood at 0.21% as of December 31, 2018.
- Lastly, provisions (net) and other gains (losses) showed a year-on-year decline of 20.9%, mainly favoured by lower restructuring costs.
Non Core Real Estate
Highlights
- Continued positive trend in the Spanish real-estate market, although with a more moderate growth rate.
- Minimum levels of the net real-estate exposure.
- Closing of the sale agreement of the participation in Testa.
- Significant reduction in net losses in the area.
Industry trends
The Spanish real estate market continues to show a growth trend, somewhat more moderated. The macroeconomic context continues to be favorable for residential demand: interest rates remain at minimum levels and the economy is still generating jobs. However, the uncertainty regarding economic policy could affect the decision of households and entrepreneurs of the sector.
- Investment in housing accelerated its growth in the third quarter of 2018, after the slowdown registered in the previous quarter. According to data from the National Quarterly Accounting Office of the INE investment in housing grew by 1.6% between July and September, an evolution that, once again, exceeded the economy as a whole.
- Between January and November, 526,840 homes were sold in Spain, a year-on-year increase of 8.5%, according to information from the General Council of Spanish Notaries (CIEN).
- Housing prices accelerated in the third quarter of 2018 to 7.2% in year-on-year terms (INE figures), exceeding the figures registered in the two previous quarters.
- The interest rate applied to new loan operations remains at 2.3% and the cost of mortgage financing remains at relatively low levels. As a result, new home loans grew by 17.1% in the first eleven months of the year.
- Finally, the evolution of the construction activity continued to be robust, in response to the increase in residential demand. According to data from the Ministry of Public Works, nearly 84,000 new housing construction permits were approved in the first ten months of the year 2018, 23.2% more than in the same period of 2017.
Activity
The net real-estate exposure amounted to €2,498m as of 31-December-2018, which means a very significant reduction in year-on-year terms (-61.1%).
With regards to the loans to developers, in the last three months of 2018 outstanding performing loans to developers for an amount of €60m were transferred from Non Core Real Estate to Banking Activity in Spain, that together with the transfer already made during the first half of 2018 stood at €260m in the year. In addition, the agreement with the Canada Pension Plan Investment Board (CPPIB) for the sale of non-performing and written-off loans to developers for a gross amount of approximately €1 billion was closed in July.
Having received the regulatory authorizations, BBVA closed on October 10, 2018 the operation of the transfer of its real-estate business in Spain to Cerberus Capital Management, L.P. (Cerberus). The closing of this operation implies the sale of 80% of the share capital of Divarian, the joint venture to which the real-estate business had been transferred, however the effective transfer of some real estate owned assets (“REOs”) is subject to the fulfillment of certain conditions and in the meanwhile, BBVA will continue to manage those assets. As of December 31, 43,900 assets with a value 2,828 million euros would have been transferred to Divarian. 17,485 assets with a value of approximately €900m are pending transfer, subject to specific authorizations in process of obtaining them.
As of December 31, 2018 the participation in Divarian which BBVA maintains at 20%, is recorded in Corporate Center.
In addition, on December 21, 2018 BBVA reached an agreement with Blackstone for the sale of its participation of its 25.24% stake in Testa for €478m.
Evolution of Net exposure to real estate (Millions of Euros)

- (1) Compared to Bank of Spain's Transparency scope (Circular 5/2011 dated November 30), real-estate developer loans do not include €2.1Bn (December 2018) mainly related performing loans to developers transferred to the Banking Activity in Spain area.
- (2) Other real-estate assets not originated from foreclosures.
Coverage of real-estate exposure (Millions of Euros as of 31-12-18)
| Gross Value | Provisions | Net exposure | % Coverage | |
|---|---|---|---|---|
| Real-estate developer loans (1) | 1,006 | 465 | 541 | 46% |
| Performing | 174 | 23 | 150 | 13% |
| Finished properties | 145 | 18 | 127 | 13% |
| Construction in progress | 14 | 3 | 11 | 23% |
| Land | 14 | 1 | 13 | 8% |
| Without collateral and other | 1 | 46% | ||
| NPL | 832 | 442 | 390 | 53% |
| Finished properties | 361 | 160 | 201 | 44% |
| Construction in progress | 23 | 11 | 13 | 45% |
| Land | 392 | 237 | 156 | 60% |
| Without collateral and other | 55 | 35 | 21 | 62% |
| Foreclosed assets | 4,310 | 2,376 | 1,934 | 55% |
| Finished properties | 3,037 | 1,501 | 1,536 | 49% |
| Construction in progress | 209 | 131 | 78 | 63% |
| Land | 1,064 | 744 | 320 | 70% |
| Other real-estate assets (2) | 25 | 3 | 22 | 11% |
| Real-estate exposure | 5,341 | 2,843 | 2,498 | 53% |
- (1) Compared to Bank of Spain's Transparency scope (Circular 5/2011 dated November 30), real-estate developer loans do not include €2.1 Bn (December 2018) mainly related performing loans to developers transferred to the Banking activity in Spain area.
- (2) Other real-estate assets not originated from foreclosures.
Total real-estate exposure, including loans to developers, foreclosures and other assets, had a coverage ratio of 53% at the close of December 2018. The coverage ratio of foreclosed assets stood at 55%.
Non-performing loan balances showed a downward trend along the year, thanks to lower NPL entries and the recovery of activity over the quarter. The NPL coverage ratio was maintained at 53%.
Results
At the close of December 2018 this business area posted a cumulative loss in 2018 of €78m, which represents a positive evolution compared to a loss of €490m in the same period the previous year.
Financial statements (Millions of Euros)
| Income statement | IFRS 9 | IAS 39 | |
|---|---|---|---|
| 2018 | ∆% | 2017 | |
| Net interest income | 32 | (55.8) | 71 |
| Net fees and commissions | 1 | (56.7) | 3 |
| Net trading income | 64 | n.s. | 0 |
| Other operating income and expenses | (59) | (35.7) | (91) |
| Gross income | 38 | n.s. | (17) |
| Operating expenses | (65) | (33.9) | (99) |
| Personnel expenses | (39) | (23.3) | (51) |
| Other administrative expenses | (22) | (28.1) | (30) |
| Depreciation | (5) | (73.3) | (18) |
| Operating income | (28) | (76.1) | (116) |
| Impairment on financial assets not measured at fair value through profit or loss | (12) | (91.0) | (138) |
| Provisions or reversal of provisions and other results | (89) | (77.8) | (403) |
| Profit/(loss) before tax | (129) | (80.3) | (656) |
| Income tax | 52 | (68.8) | 166 |
| Profit/(loss) for the year | (78) | (84.2) | (491) |
| Non-controlling interests | (0) | n.s. | 1 |
| Net attributable profit | (78) | (84.2) | (490) |
| Balance sheets | IFRS 9 | IAS 39 | |
|---|---|---|---|
| 31-12-18 | ∆% | 31-12-17 | |
| Cash, cash balances at central banks and other demand deposits | 14 | 19.8 | 12 |
| Financial assets designated at fair value | 1,358 | n.s. | 9 |
| of which loans and advances | 1,368 | n.s. | |
| Financial assets at amortized cost | 582 | (83.5) | 3,521 |
| of which loans and advances | 582 | (83.5) | 3,521 |
| Inter-area positions | |||
| Tangible assets | 30 | n.s. | 0 |
| Other assets | 2,179 | (64.7) | 6,172 |
| Total assets/liabilities and equity | 4,163 | (57.1) | 9,714 |
| Financial liabilities held for trading and designated at fair value through profit or loss | |||
| Deposits from central banks and credit institutions | 36 | n.s. | 0 |
| Deposits from customers | 36 | 187.5 | 13 |
| Debt certificates | 239 | (69.6) | 785 |
| Inter-area positions | 2,691 | (53.4) | 5,775 |
| Other liabilities | 205 | n.s. | |
| Economic capital allocated | 956 | (69.6) | 3,141 |
| Memorandum item: | |||
| Risk-weighted assets | 3,022 | (68.8) | 9,692 |
The United States
Highlights
- Lending growth supported by business financing and retail segments.
- Good performance of net interest income and provisions.
- Improvement in efficiency.
- Net attributable profit positively affected by the tax reform at the end of 2017.
Business activity (1)
(Year-on-year change at constant exchange rate. Data as of 31-12-18)
(1) Excluding repos.
Net interest income/ATAs
(Percentage. Constant exchange rate)
Operating income
(Millions of Euros at constant exchange rate)
(1) At current exchange rate: +10.0%.
Net attributable profit
(Millions of Euros at constant exchange rate)
(1) At current exchange rate: +51.3%.
Breakdown of performing loans under management (1)
(31-12-18)
Breakdown of customer funds under management (1)
(31-12-18)
(1) Excluding repos.
(1) Excluding repos.
Financial statements and relevant business indicators (Millions of Euros and percentage)
| Income statement | IFRS 9 | IAS 39 | ||
|---|---|---|---|---|
| 2018 | ∆% | ∆%(1) | 2017 | |
| Net interest income | 2,276 | 7.4 | 12.1 | 2,119 |
| Net fees and commissions | 596 | (7.5) | (3.8) | 644 |
| Net trading income | 109 | (1.9) | 0.9 | 111 |
| Other operating income and expenses | 9 | n.s. | 256.4 | 2 |
| Gross income | 2,989 | 3.9 | 8.3 | 2,876 |
| Operating expenses | (1,862) | 0.6 | 4.9 | (1,851) |
| Personnel expenses | (1,051) | (1.6) | 2.7 | (1,067) |
| Other administrative expenses | (633) | 6.0 | 10.5 | (598) |
| Depreciation | (178) | (4.6) | (0.4) | (187) |
| Operating income | 1,127 | 10.0 | 14.5 | 1,025 |
| Impairment on financial assets not measured at fair value through profit or loss | (225) | (6.8) | (2.6) | (241) |
| Provisions or reversal of provisions and other results | 16 | n.s. | n.s. | (36) |
| Profit/(loss) before tax | 919 | 22.9 | 27.6 | 748 |
| Income tax | (184) | (29.8) | (26.9) | (262) |
| Profit/(loss) for the year | 735 | 51.3 | 56.9 | 486 |
| Non-controlling interests | ||||
| Net attributable profit | 735 | 51.3 | 56.9 | 486 |
| Balance sheets | IFRS 9 | IAS 39 | ||
|---|---|---|---|---|
| 31-12-18 | ∆% | ∆%(1) | 31-12-17 | |
| Cash, cash balances at central banks and other demand deposits | 4,835 | (32.3) | (35.3) | 7,138 |
| Financial assets designated at fair value | 10,481 | (5.3) | (9.6) | 11,068 |
| of which loans and advances | 156 | 179.2 | n.s. | 56 |
| Financial assets at amortized cost | 63,539 | 16.1 | 10.9 | 54,705 |
| of which loans and advances to customers | 60,808 | 13.2 | 8.1 | 53,718 |
| Inter-area positions | ||||
| Tangible assets | 668 | 1.5 | (3.1) | 658 |
| Other assets | 2,534 | 14.8 | 9.6 | 2,207 |
| Total assets/liabilities and equity | 82,057 | 8.3 | 3.4 | 75,775 |
| Financial liabilities held for trading and designated at fair value through profit or loss | 234 | 68.2 | 60.6 | 139 |
| Deposits from central banks and credit institutions | 3,370 | (5.9) | (10.1) | 3,580 |
| Deposits from customers | 63,891 | 5.1 | 0.3 | 60,806 |
| Debt certificates | 3,599 | 78.4 | 70.3 | 2,017 |
| Inter-area positions | 2,528 | 127.8 | 117.5 | 1,110 |
| Other liabilities | 5,395 | (0.7) | (5.2) | 5,431 |
| Economic capital allocated | 3,040 | 12.9 | 7.8 | 2,693 |
| Relevant business indicators | 31-12-18 | ∆% | ∆%(1) | 31-12-17 |
|---|---|---|---|---|
| Performing loans and advances to customers under management (2) | 60,784 | 12.5 | 7.4 | 54,036 |
| Non-performing loans | 802 | 15.1 | 9.9 | 696 |
| Customer deposits under management (2) | 63,888 | 5.1 | 0.3 | 60,806 |
| Off-balance sheet funds (3) | ||||
| Risk-weighted assets | 64,146 | 9.3 | 4.4 | 58,688 |
| Efficiency ratio (%) | 62.3 | 64.4 | ||
| NPL ratio (%) | 1.3 | 1.2 | ||
| NPL coverage ratio (%) | 85 | 104 | ||
| Cost of risk (%) | 0.39 | 0.43 |
- (1) Figures at constant exchange rate.
- (2) Excluding repos.
- (3) Includes mutual funds, pension funds and other off-balance sheet funds.
Macro and industry trends
According to the latest available information from the Bureau of Economic Analysis (BEA), in the third quarter of 2018, annualized US GDP growth moderated from 4.2% to 3.4% as a result of the moderation of non-residential investment and the drop in exports after the strong rebound in the previous quarter. Furthermore, private consumption remains robust, supported by the dynamism of the labor market and the growth in wages, as well as public spending, driven by a more expansive fiscal policy. According to the most recent indicators growth could reach approximately 2.9% during 2018. Despite the strength of domestic demand and an unemployment rate below 4% last year, core inflation (PCE) remained relatively stable at approximately 2% in 2018, while the fall of prices of energy products was reflected in a strong moderation of headline inflation to 1.9% in November from rates close to 3% in the middle of the year. The Fed continued with the normalization process, with four increases of 25 basis points each in 2018 (up to the 2.25%-2.50% range).
The persistence of the expansive cycle in the country, together with the resurgence of uncertainty and financial volatility, associated with a combination of factors (among them, the fear of an escalating protectionism and a greater perception of risk on the vulnerability of emerging markets) have substantially revalued the dollar since the second quarter of 2018, which appreciated by around 7% during the year, with December closing data of the effective exchange rate weighted by the importance of its main trading partners.
The general situation of the country's banking system continued to be favorable. According to the latest available data from the Fed through November 2018, the total volume of bank credit in the system increased by 5.0% over the same month of the previous year, with a particularly positive performance in commercial loans (up 17.0% year-on-year), while real estate loans (including the mortgage loans) stayed flattish in the last twelve months. On the other hand, deposits remained basically at the same level as the prior year (down 0.6%). Lastly, non-performing loans continued their downward trend, with an NPL ratio of 1.58% at the end of the third quarter of 2018.
Activity
Unless expressly stated otherwise, all the comments below on rates of change, for both activity and earnings, will be given at constant exchange rate. These rates, together with changes at current exchange rate, can be seen in the attached tables of financial statements and relevant business indicators.
The most relevant aspects related to the area’s activity in 2018 were:
- Lending activity in the area (performing loans under management) showed an increase by 7.4% year-on-year.
- By portfolio, higher interest rates continued affecting negatively the mortgages and loans to developers (construction real estate). By contrast, the consumer and credit card loans, which have higher margins and are therefore more profitable, increased by 28.2% year-on-year. Both other commercial (up 7.0%) and corporates also performed well (up 12.3%).
- Regarding the risk indicators, slight rebound of the NPL ratio in the quarter, which stood at 1.3% from 1.1% registered as of 30-September-2018, due to the deterioration of certain singular clients. On the other hand, the NPL coverage ratio closed at 85%.
- Customer deposits under management closed in line with the figure of December 2017 (+0.3%), affected by the deposit-gathering campaigns, with an increase the time deposits (+2.2%) and a decrease in the demand deposits (-4.0%).
Results
The United States generated a cumulative net attributable profit of €735m during 2018, 56.9% higher than the one registered twelve months earlier, due mainly to the increase in net interest income, lower provisions and lower tax expenses. Also worth noting are the following:
- Net interest income continued to perform positively, with the cumulative figure up by 12.1% year-on-year and 2.9% over the last quarter of 2018. This was due partly to the Fed's interest-rate hikes, but also the measures adopted by BBVA Compass to improve loan yields and contain the increase in the cost of deposits (improved deposit mix and wholesale funding).
- Net fees and commissions declined by 3.8% year-on-year, due to a lower contribution from markets, investment banking and money transfers.
- Operating expenses grew by 4.9% year-on-year, mainly due to greater activity related to the growth of consumer loans. This increase is lower than that shown by the gross margin (+8.3%), as a result, the efficiency ratio improved.
- Impairment losses on financial assets fell by 2.6% in the last twelve months, due to the lower provisioning requirements in those portfolios affected by the 2017 hurricanes. As a result, the cumulative cost of risk through 31-December-2018 declined to 0.39%.
- Lastly, income tax declined as a result of a reduction in the effective tax rate following the tax reform approved at the end of 2017, which in addition generated a one-off charge in the amount of €78m due to the valuation of deferred tax assets.
Mexico
Highlights
- Good performance of the activity, with growth in all segments.
- Expenses continue to grow below the rate of gross income.
- Double-digit year-on-year growth in net attributable profit.
- Good asset quality indicators.
Business activity (1)
(Year-on-year change at constant exchange rate. Data as of 31-12-18)
(1) Excluding repos.
Net interest income/ATAs
(Percentage. Constant exchange rate)
Operating income
(Millions of Euros at constant exchange rate)

Net attributable profit
(Millions of Euros at constant exchange rate)

(1) At current exchange rate: +3.3%.
(1) At current exchange rate: +9.0%.
Breakdown of performing loans under management (1)
(31-12-18)
Breakdown of customer funds under management (1)
(31-12-18)

(1) Excluding repos.
(1) Excluding repos.
Financial statements and relevant business indicators (Millions of Euros and percentage)
| Income statement | IFRS 9 | IAS 39 | ||
|---|---|---|---|---|
| 2018 | ∆% | ∆%(1) | 2017 | |
| Net interest income | 5,568 | 1.7 | 8.2 | 5,476 |
| Net fees and commissions | 1,205 | (1.2) | 5.1 | 1,219 |
| Net trading income | 223 | (10.4) | (4.6) | 249 |
| Other operating income and expenses | 197 | 11.2 | 18.3 | 177 |
| Gross income | 7,193 | 1.0 | 7.5 | 7,122 |
| Operating expenses | (2,368) | (3.4) | 2.8 | (2,452) |
| Personnel expenses | (1,024) | (2.6) | 3.7 | (1,051) |
| Other administrative expenses | (1,091) | (4.7) | 1.5 | (1,145) |
| Depreciation | (253) | (1.3) | 5.1 | (256) |
| Operating income | 4,825 | 3.3 | 10.0 | 4,671 |
| Impairment on financial assets not measured at fair value through profit or loss | (1,555) | (5.8) | 0.2 | (1,651) |
| Provisions or reversal of provisions and other results | 24 | n.s. | n.s. | (35) |
| Profit/(loss) before tax | 3,294 | 10.4 | 17.5 | 2,984 |
| Income tax | (909) | 14.0 | 21.4 | (797) |
| Profit/(loss) for the year | 2,385 | 9.0 | 16.1 | 2,187 |
| Non-controlling interests | (0) | 9.1 | 16.1 | (0) |
| Net attributable profit | 2,384 | 9.0 | 16.1 | 2,187 |
| Balance sheets | IFRS 9 | IAS 39 | ||
|---|---|---|---|---|
| 31-12-18 | ∆% | ∆%(1) | 31-12-17 | |
| Cash, cash balances at central banks and other demand deposits | 8,274 | (6.3) | (11.0) | 8,833 |
| Financial assets designated at fair value | 26,022 | (9.1) | (13.6) | 28,627 |
| of which loans and advances | 72 | (95.4) | (95.6) | 1.558 |
| Financial assets at amortized cost | 57,709 | 21.0 | 15.0 | 47,691 |
| of which loans and advances to customers | 51,101 | 11.7 | 6.1 | 45,768 |
| Tangible assets | 1,788 | 2.2 | (2.8) | 1,749 |
| Other assets | 2,663 | (62.8) | (64.7) | 7,160 |
| Total assets/liabilities and equity | 96,455 | 2.5 | (2.5) | 94,061 |
| Financial liabilities held for trading and designated at fair value through profit or loss | 18,028 | 91.7 | 82.2 | 9,405 |
| Deposits from central banks and credit institutions | 683 | (88.3) | (88.9) | 5.853 |
| Deposits from customers | 50,530 | 1.1 | (3.9) | 49,964 |
| Debt certificates | 8,566 | 17.1 | 11.4 | 7,312 |
| Other liabilities | 14,508 | (17.7) | (21.8) | 17,627 |
| Economic capital allocated | 4,140 | 6.2 | 0.9 | 3,901 |
| Relevant business indicators | 31-12-18 | ∆% | ∆%(1) | 31-12-17 |
|---|---|---|---|---|
| Performing loans and advances to customers under management (2) | 51,387 | 13.7 | 8.1 | 45,196 |
| Non-performing loans | 1,138 | 1.3 | (3.7) | 1,124 |
| Customer deposits under management (2) | 49,740 | 10.3 | 4.9 | 45,093 |
| Off-balance sheet funds (3) | 20,647 | 6.0 | 0.8 | 19,472 |
| Risk-weighted assets | 53,359 | 18.7 | 12.9 | 44,941 |
| Efficiency ratio (%) | 32.9 | 34.4 | ||
| NPL ratio (%) | 2.1 | 2.3 | ||
| NPL coverage ratio (%) | 154 | 123 | ||
| Cost of risk (%) | 3.07 | 3.24 |
(1) Figures at constant exchange rate.
(2) Excluding repos.
(3) Includes mutual funds, pension funds and other off-balance sheet funds.
Macro and industry trends
The quarterly GDP growth in Mexico was 0.8% in the third quarter of 2018, measured in figures adjusted by seasonality. This expansion, after a growth by 1.1% in the first quarter and a slight contraction of 0.1% in the second quarter, is mainly explained by the expansion of services and the manufacturing sector. On the demand side, the main contribution to growth in the third quarter has been from consumption. While private investment has shown new signs of weakness. The trade agreement reached by Mexico, the United States and Canada, as well as the reduction in uncertainty regarding the economic policy of the administration of Andrés Manuel López Obrador, who assumed the presidency of the country on December 1, could help to maintain in the following periods the dynamism observed in the third quarter.
With respect to inflation, the increase observed in recent months seems to be transitory, since it is mainly due to the increase in energy prices, while core inflation remains relatively stable. This, together with contained inflation pressures, suggests that additional interest rate hikes by Banxico might not be necessary for the remainder of the year.
For yet another quarter, the Mexican banking system showed excellent levels of solvency and asset quality. According to the latest available information from the Mexican National Banking and Securities Commission (CNBV) in November 2018, activity remained as strong as in previous quarters, with year-on-year growth in the volume of lending and deposits (demand and time deposits) at 10.6% and 8.4%, respectively. Both the NPL ratio (2.2%) and NPL coverage ratio (150%) were stable. Finally, solvency in the system is at a comfortable level, with a capital adequacy ratio of 15.65% as of the end of October 2018.
Activity
Unless expressly stated otherwise, all the comments below on rates of change, for both activity and earnings, will be given at constant exchange rate. These rates, together with changes at current exchange rate, can be seen in the attached tables of financial statements and relevant business indicators.
The most relevant aspects related to the area’s activity year in 2018 were:
- Year-on-year increase in lending (performing loans and advances to customers under management) of 8.1%. BBVA maintains its leading position in the country, with a market share of 22.6% in outstanding performing loans, according to local figures from the CNBV at the end of November 2018.
- By portfolio: the wholesale portfolio, which represents 51.8% of total lending, increased by 9.4% in year-on-year terms, driven mainly by medium-sized companies and the corporates segment. As for the retail portfolio, it increased by 6.7% (including SMEs), which was heavily supported by consumer loans (payroll, personal and auto), which rose by 8.7%.
- With respect to the asset quality indicators, the NPL ratio closed at 2.1% from the 2.3% registered twelve months earlier. The NPL coverage ratio closed at 154%.
- Total customer funds customer deposits under management, mutual funds and other off-balance sheet funds) showed a year-on-year increase of 3.6%, with remarkable growth in demand deposits (+7.6%), in time deposits (+4.0%) and mutual funds (+2.6%).
- A profitable funding mix: low-cost accounts represent 77% of total customer deposits under management.
Results
BBVA in Mexico posted a net attributable profit of €2,384m, a year-on-year increase of 16.1%. The main highlights in the evolution of income statement in Mexico is summarized below:
- Positive performance of net interest income, which showed a year-on-year growth of +8.2%, highly aligned with lending activity (+8.1%).
- Good performance of net fees and commissions, which showed an increase of 5.1% as a result of increased activity in mutual funds, as well as a higher volume of transactions with on-line banking and credit card customers.
- NTI registered a decrease (-4.6%) due to the unfavorable performance of the Global Markets unit during 2018.
- The other income/expenses line registered year-on-year growth of 18.3%, mainly due to the positive performance of the insurance activity.
- Operating expenses continued to grow at a very controlled pace (up +2.8% year-on-year) and below the area's gross income growth (+7.5%). As a result, the efficiency ratio has continued to improve and stood at 32.9% as of December 31, 2018.
- Adequate risk management has been reflected in the change in the impairment losses on financial assets line item, which remains at the same level as 2017 (+0.2% year-on-year), despite the loan growth during the year, mainly explained by a change in the mix of the loan portfolio. As a result, the cumulative cost of risk in the area closed at 3.07% versus 3.24% as of December 2017.
- The positive evolution in the other gains (losses) line, that included the extraordinary income from the sale of BBVA Bancomer's stake in a real-estate development and the capital gain from the sale of a corporate building by Bancomer.
Turkey
Highlights
- Activity impacted by the evolution of exchange rates.
- Good performance of recurring revenue items, as a result of the inflation-linked bonds performance.
- Operating expenses growth below inflation.
- Risk indicators affected by the update of the macroeconomic scenario and certain negative impacts of the portfolio of wholesale customers.
Business activity (1)
(Year-on-year change at constant exchange rate. Data as of 31-12-18)

(1) Excluding repos.
Net interest income/ATAs
(Percentage. Constant exchange rate)

Operating income
(Millions of Euros at constant exchange rate)

(1) At current exchange rate: +1.8%.
Net attributable profit
(Millions of Euros at constant exchange rate)

(1) At current exchange rate: -31.0%.
Breakdown of performing loans under management (1)
(31-12-18)

(1) Excluding repos.
Breakdown of customer funds under management (1)
(31-12-18)
(1) Excluding repos.
Financial statements and relevant business indicators (Millions of Euros and percentage)
| Income statement | IFRS 9 | IAS 39 | ||
|---|---|---|---|---|
| 2018 | ∆% | ∆%(1) | 2017 | |
| Net interest income | 3,135 | (5.9) | 30.3 | 3,331 |
| Net fees and commissions | 686 | (2.4) | 35.1 | 703 |
| Net trading income | 11 | (24.2) | 5.0 | 14 |
| Other operating income and expenses | 70 | 3.4 | 43.1 | 67 |
| Gross income | 3,901 | (5.2) | 31.3 | 4,115 |
| Operating expenses | (1,243) | (17.3) | 14.5 | (1,503) |
| Personnel expenses | (656) | (17.9) | 13.6 | (799) |
| Other administrative expenses | (449) | (14.6) | 18.2 | (526) |
| Depreciation | (138) | (22.4) | 7.5 | (178) |
| Operating income | 2,658 | 1.8 | 40.9 | 2,612 |
| Impairment on financial assets not measured at fair value through profit or loss | (1.202) | 165.3 | 267.4 | (453) |
| Provisions or reversal of provisions and other results | (8) | (33.7) | (8.2) | (12) |
| Profit/(loss) before tax | 1,448 | (32.5) | (6.6) | 2,147 |
| Income tax | (294) | (31.0) | (4.5) | (426) |
| Profit/(loss) for the year | 1,154 | (32.9) | (7.1) | 1,720 |
| Non-controlling interests | (585) | (34.6) | (9.5) | (895) |
| Net attributable profit | 569 | (31.0) | (4.5) | 826 |
| Balance sheets | IFRS 9 | IAS 39 | ||
|---|---|---|---|---|
| 31-12-18 | ∆% | ∆%(1) | 31-12-17 | |
| Cash, cash balances at central banks and other demand deposits | 7,853 | 94.6 | 159.3 | 4,036 |
| Financial assets designated at fair value | 5,506 | (14.2) | 14.3 | 6,419 |
| of which loans and advances | 410 | n.s. | n.s. | |
| Financial assets at amortized cost | 50,315 | (22.7) | 3.0 | 65,083 |
| of which loans and advances to customers | 41,478 | (19.3) | 7.6 | 51,378 |
| Tangible assets | 1,059 | (21.2) | 5.1 | 1,344 |
| Other assets | 1,517 | (16.3) | 11.6 | 1,811 |
| Total assets/liabilities and equity | 66,250 | (15.8) | 12.2 | 78,694 |
| Financial liabilities held for trading and designated at fair value through profit or loss | 1,852 | 185.9 | 281.0 | 648 |
| Deposits from central banks and credit institutions | 6,734 | (39.8) | (19.8) | 11,195 |
| Deposits from customers | 39,905 | (10.7) | 19.0 | 44,691 |
| Debt certificates | 5,964 | (28.5) | (4.8) | 8,346 |
| Other liabilities | 9,267 | (18.1) | 9.1 | 11,321 |
| Economic capital allocated | 2,529 | 1.4 | 35.2 | 2,493 |
| Relevant business indicators | 31-12-18 | ∆% | ∆%(1) | 31-12-17 |
|---|---|---|---|---|
| Performing loans and advances to customers under management (2) | 40,996 | (20.3) | 6.2 | 51,438 |
| Non-performing loans | 2,876 | 12.7 | 50.1 | 2,553 |
| Customer deposits under management (2) | 39,897 | (10.4) | 19.4 | 44,539 |
| Off-balance sheet funds (3) | 2,894 | (25.8) | (1.2) | 3,902 |
| Risk-weighted assets | 56,486 | (10.0) | 19.9 | 62,768 |
| Efficiency ratio (%) | 31.9 | 36.5 | ||
| NPL ratio (%) | 5.3 | 3.9 | ||
| NPL coverage ratio (%) | 81 | 85 | ||
| Cost of risk (%) | 2.44 | 0.82 |
(1) Figures at constant exchange rate.
(2) Excluding repos.
(3) Includes mutual funds, pension funds and other off-balance-sheet funds.
Macro and industry trends
According to the most recent figures from the Turkish Statistical Institute, Turkey’s year-on-year economic growth was 1.6% in the third quarter of 2018, supported by the considerable positive external demand contribution, while domestic demand, including inventories, hindered growth.
Interannual inflation experienced a rapid correction as it declined from 24.5% in September to 20.3% in December, as a result of tax reductions in certain items, price discount campaigns, the contraction in oil prices and the appreciation of the Turkish lira by around 20% in the last four months of 2018.
Throughout the year, the Central Bank (CBRT) increased its funding interest rate by 1.125 basis points. However, in its December meeting the CBRT decided to keep it at 24.0%. With this decision, the CBRT strengthened its message against the easing expectations of the market, saying that risks on price stability continue to prevail despite the recent improvement in inflation outlook due to the developments in import prices and domestic demand conditions. Regarding fiscal policy stance, the government’s budget targets were met at the end of 2018 with the support of one-off revenues.
Regarding the evolution of the Turkish financial sector, year-on-year credit growth has continued to decelerate during the last quarter of 2018, mainly due to business lending. By the last week of December 2018, the year-on-year total lending growth rate (adjusted for the depreciation of the lira effect) fell to 3.1%. On the other hand, customer deposits have also shown sign of a slowdown. The year-on-year total deposits growth rate fell to 6.2% (adjusted for the depreciation of the lira effect). Turkish-lira deposits grew by 10.6% and foreign-currency deposits (mainly in U.S. dollars) contracted by 7.6%. Lastly, the NPL ratio closed at 3.66% for December 28th (an increase of 59 basis points in the last quarter).
Activity
Unless expressly stated and communicated otherwise, rates of changes explained ahead, both for activity and for income will be presented at constant exchange rates. These rates, together with changes at current exchange rates, can be observed in the attached tables of the financial statements and relevant business indicators.
The most relevant aspects related to the area’s activity year-to-date as of December 31, 2018 have been:
- Lending activity (performing loans under management) grew by 6.2% in the year driven by the evolution of exchange rates (down 11.2% in the quarter). On the one hand, Garanti Bank continued to reduce its exposure in foreign-currency loans (in U.S. dollars) in all quarters of 2018 in line with its corporate strategy; while on the other hand, Turkish-lira loan growth decelerated in the third quarter and decreased significantly in the last quarter of 2018.
- By segments, contraction has accelerated in the fourth quarter in all types of loans except auto loans and credit cards, which grew above the sector. On the contrary, the contraction in consumer and mortgage loans accelerated in the quarter in line with the sector and there was a contraction in Turkish-lira business banking loans which is in line with the private banks.
- In terms of asset quality, the NPL ratio increased to 5.3% due to the macroeconomic conditions and the inflow of certain doubtful clients. The NPL coverage ratio stood at 81%.
- Customer deposits (60% of total liabilities in the area as of December 31, 2018) remained the main source of funding for the Turkish´s balance sheet and grew by 19.4% in 2018 mainly supported by the growth of Garanti Bank Turkish-lira deposits. On the other hand, shrinkage in foreign-currency customer deposits (in U.S. dollars) continued due to higher interest rates in Turkish-lira deposits.
- All funding and liquidity ratios remained within comfort levels, and Garanti maintained its solvency levels well above requirements.
Results
In 2018, Turkey generated a cumulative attributable profit of €569m, a year-on-year decline of 4.5%. The most significant aspects of the year-on-year evolution in the income statement were as follows:
- Positive performance of net interest income (up to 30.3%) despite the pressure on customer spreads, mainly due to the significant income from inflation-linked bonds, whose contribution, compared to previous year, is more than double.
- Income from net fees and commissions grew by 35.1%. This significant increase was mainly driven by the positive performance in payment systems, advances, money transfers and other commissions.
- Increase in NTI (by 5.0%) where the high performance of global markets, asset and liabilities management and derivatives offsets the Turkish lira depreciation.
- Gross income was up 31.3% in 2018 compared to 2017, thanks to the increase in core banking activities and the aforementioned higher inflation-linked bonds contribution.
- Operating expenses increased by 14.5%, below the average inflation rate (16.2%) and well below the year-on-year growth rate in gross income. As a result of strict cost-control discipline, the efficiency ratio declined to 31.9%.
- Impairment on financial assets increased in year-on-year terms by 267.4%, mainly denominated by big ticket provisions coming from the wholesale-customer portfolio and also the macroeconomic scenario update. As a result, the cumulative cost of risk of the area increased to 2.44%.
South America
Highlights
- Activity affected by the sale of BBVA Chile.
- In other countries, the activity evolves at a good pace.
- Argentina hyperinflation adjustment impacts in every item of the income statement.
Business activity (1)
(Year-on-year change at constant exchange rates. Data as of 31-12-18)
(1) Excluding repos.
Net interest income/ATAs
(Percentage. Constant exchange rates)

Breakdown of performing loans under management (1)
(31-12-18)
(1) Excluding repos.
Breakdown of customer funds under management (1)
(31-12-18)

(1) Excluding repos.
Financial statements and relevant business indicators (Millions of euros and percentage)
| Income statement | IFRS 9 | IAS 39 | ||
|---|---|---|---|---|
| 2018 | ∆% | ∆% (1) | 2017 | |
| Net interest income | 3,009 | (6.0) | 12.8 | 3,200 |
| Net fees and commissions | 631 | (11.4) | 10.9 | 713 |
| Net trading income | 405 | (15.7) | 5.2 | 480 |
| Other operating income and expenses | (344) | n.s. | n.s. | 59 |
| Gross income | 3,701 | (16.9) | 1.9 | 4,451 |
| Operating expenses | (1,690) | (15.8) | 7.7 | (2,008) |
| Personnel expenses | (846) | (18.3) | 5.9 | (1,035) |
| Other administrative expenses | (719) | (15.5) | 7.4 | (851) |
| Depreciation | (125) | 3.2 | 24.7 | (121) |
| Operating income | 2,011 | (17.7) | (2.5) | 2,444 |
| Impairment on financial assets not measured at fair value through profit or loss | (638) | (1.9) | 5.2 | (650) |
| Provisions or reversal of provisions and other results | (65) | (36.3) | (15.5) | (103) |
| Profit/(loss) before tax | 1,307 | (22.7) | (5.1) | 1,691 |
| Income tax | (475) | (2.2) | 23.9 | (486) |
| Profit/(loss) for the year | 833 | (30.9) | (16.3) | 1,205 |
| Non-controlling interests | (241) | (29.9) | (15.9) | (345) |
| Net attributable profit | 591 | (31.3) | (16.5) | 861 |
| Balance sheets | IFRS 9 | IAS 39 | ||
|---|---|---|---|---|
| 31-12-18 | ∆% | ∆% (1) | 31-12-17 | |
| Cash, cash balances at central banks and other demand deposits | 8,987 | (0.6) | 11.0 | 9,039 |
| Financial assets designated at fair value | 5,634 | (51.5) | (47.0) | 11,627 |
| of which loans and advances | 129 | n.s. | n.s. | 3 |
| Financial assets at amortized cost | 36,649 | (28.4) | (21.3) | 51,207 |
| of which loans and advances to customers | 34,469 | (28.6) | (21.6) | 48,272 |
| Tangible assets | 813 | 12.1 | 33.3 | 725 |
| Other assets | 302 | (85.2) | (83.9) | 2,038 |
| Total assets/liabilities and equity | 52,385 | (29.8) | (22.7) | 74,636 |
| Financial liabilities held for trading and designated at fair value through profit or loss | 1,357 | (51.9) | (48.4) | 2,823 |
| Deposits from central banks and credit institutions | 3,076 | (59.3) | (57.9) | 7,552 |
| Deposits from customers | 35,842 | (21.5) | (13.0) | 45,666 |
| Debt certificates | 3,206 | (55.5) | (53.0) | 7,209 |
| Other liabilities | 6,551 | (23.0) | (10.4) | 8,505 |
| Economic capital allocated | 2,355 | (18.3) | (7.5) | 2,881 |
| Relevant business indicators | 31-12-18 | ∆% | ∆%(1) | 31-12-17 |
|---|---|---|---|---|
| Performing loans and advances to customers under management (2) | 34,518 | (28.2) | (21.2) | 48,068 |
| Non-performing loans | 1,747 | (7.3) | (3.2) | 1,884 |
| Customer deposits under management (3) | 35,984 | (21.7) | (13.2) | 45,970 |
| Off-balance sheet funds (4) | 11,662 | (4.4) | (1.1) | 12,197 |
| Risk-weighted assets | 42,736 | (23.7) | (14.4) | 55,975 |
| Efficiency ratio (%) | 45.7 | 45.1 | ||
| NPL ratio (%) | 4.3 | 3.4 | ||
| NPL coverage ratio (%) | 97 | 89 | ||
| Cost of risk (%) | 1.44 | 1.32 |
- (1) Figures at constant exchange rates.
- (2) Excluding repos.
- (3) Excluding repos and including specific marketable debt securities.
- (4) Includes mutual funds, pension funds and other off-balance sheet funds.
South America. Data per country (Millions of euros)
| IFRS 9 | IAS 39 | IFRS 9 | IAS 39 | |||||
|---|---|---|---|---|---|---|---|---|
| Operating income | Net attributable profit | |||||||
| Country | 2018 | ∆% | ∆% (1) | 2017 | 2018 | ∆% | ∆% (1) | 2017 |
| Argentina | 179 | (65.7) | (20.6) | 522 | (29) | n.s. | n.s. | 219 |
| Chile | 289 | (31.2) | (28.9) | 421 | 137 | (27.1) | (24.7) | 188 |
| Colombia | 645 | 0.3 | 4.8 | 644 | 229 | 11.6 | 16.6 | 206 |
| Peru | 736 | 1.3 | 6.7 | 726 | 195 | 8.4 | 14.3 | 180 |
| Other countries (2) | 161 | 23.0 | 29.7 | 131 | 59 | (13.6) | (8.2) | 68 |
| Total | 2,011 | (17.7) | (2.5) | 2,444 | 591 | (31.3) | (16.5) | 861 |
- (1) Figures at constant exchange rates.
- (2) Venezuela, Paraguay, Uruguay and Bolivia. Additionally, it includes eliminations and other charges.
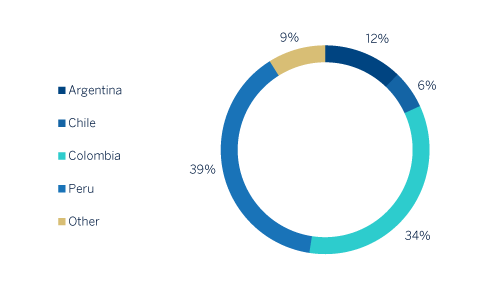
South America. Relevant business indicators per country (Millions of euros)
| Argentina | Chile | Colombia | Peru | |||||
|---|---|---|---|---|---|---|---|---|
| 31-12-18 | 31-12-17 | 31-12-18 | 31-12-17 | 31-12-18 | 31-12-17 | 31-12-18 | 31-12-17 | |
| Performing loans and advances to customers under management (1)(2) | 4,221 | 2,982 | 2,045 | 13,542 | 11,835 | 11,385 | 13,351 | 13,021 |
| Non-performing loans and guarantees given (1) | 87 | 24 | 58 | 390 | 768 | 643 | 709 | 648 |
| Customer deposits under management (1)(3) | 5,986 | 3,531 | 10 | 8,975 | 12,543 | 11,702 | 12,843 | 12,263 |
| Off-balance sheet funds (1)(4) | 783 | 654 | 1,201 | 1,287 | 1,070 | 1,666 | 1,589 | |
| Risk-weighted assets | 8,036 | 9,364 | 2,243 | 14,398 | 12,672 | 12,299 | 15,760 | 14,879 |
| Efficiency ratio (%) | 73.0 | 56.1 | 42.1 | 45.2 | 36.3 | 36.0 | 35.4 | 35.6 |
| NPL ratio (%) | 2.0 | 0.8 | 2.8 | 2.6 | 6.0 | 5.3 | 4.0 | 3.8 |
| NPL coverage ratio (%) | 111 | 198 | 93 | 60 | 100 | 88 | 93 | 100 |
| Cost of risk (%) | 1.60 | 0.61 | 0.81 | 0.76 | 2.16 | 2.59 | 0.98 | 1.14 |
- (1) Figures at constant exchange rates.
- (2) Excluding repos.
- (3) Excluding repos and including specific marketable debt securities.
- (4) Includes mutual funds, pension funds and other off-balance-sheet funds.
Macro and industry trends
The activity of the South American economies has exhibited, in general, a positive performance in the third quarter of 2018, mainly in the Andean countries, supported by a relatively expansive monetary policy. In contrast, economic activity in Argentina contracted once again, although significantly less than in the second quarter, in an environment in which stabilization signs are beginning to appear after the financial tensions that were previously present, and in which restrictive economic policies continue to be maintained. In the rest of the countries in the region, consumption continues to recover, supported by relatively low levels of inflation, and also investment, driven by the increase in domestic demand and the recovery of confidence.
Inflation in the region remains generally under control, at levels close to the objectives of the respective central banks. In this sense, an end to the lax monetary policy phase could be coming, and gradual increases in interest rates by the monetary authorities could begin in the coming months. As with the case of economic activity, the situation in Argentina contrasts with that of the other countries in the region. Despite recent signs of moderation, inflation remains high, in a context in which the restrictive tone of monetary policy is implemented through the nominal stability of monetary aggregates.
Regarding the banking systems within BBVA's regional footprint, the macroeconomic backdrop and low levels of banking penetration in these countries in aggregate terms (obviously with differences between countries) led to strong results in the main indicators of profitability and solvency, while non-performing loans remained under control. In addition, there has been sustained growth in lending and deposits.
Activity
On 6-July-2018, after obtaining all required authorizations, BBVA completed the sale to The Bank of Nova Scotia of its direct and indirect stake in Banco Bilbao Vizcaya Argentaria, Chile (BBVA Chile) as well as in other companies of its group in Chile whose operations are complementary to the banking business (particularly, BBVA Seguros Vida, S.A.). The impacts of this transaction were reflected in the financial statements of the BBVA Group for the third quarter of 2018. In addition, as it was announced to the market through relevant event on December 19, 2018 BBVA has decided to initiate a strategic review of alternatives for its automobile financing business in Chile mainly carried out by the company Forum Servicios Financieros, S.A. (“Forum”). Despite Forum being a highly attractive business, BBVA´s sale of its banking business in Chile, advises the initiation of this review process.
Unless expressly stated otherwise, all the comments below on rates of change, for both activity and earnings, will be provided at constant exchange rates, and will be impacted by the divestment in BBVA Chile. These rates, together with changes at current exchange rates, can be found in the attached tables of financial statements and relevant business indicators.
The most relevant aspects related to the area’s activity in 2018 were:
- Lending (performing loans under management) in South America was 21.2% below the same period the previous year. Excluding BBVA Chile from the comparison, loans to customers grew by 8.6% since 31-12-2017. By country, the most significant increase was in Argentina (up 41.6% year-on-year) together with the improvement in lending in Colombia and Peru. By portfolios, excluding BBVA Chile from the comparison, performance was especially positive in the mortgage, consumer and business banking segments.
- Regarding asset quality of the portfolio, the NPL ratio, as of 31-December-2018 stood at 4.3%, in line with the previous quarter, while the NPL coverage ratio decreased to 97% (101% as of 30-September-2018).
- Customer funds decreased by 13.2%, although on a comparable basis, i.e. excluding BBVA Chile from the comparison, they grew by 10.7%. Off-balance-sheet funds, on a comparable basis, increased by 10.1% year-on-year. By country there was a positive trend in Argentina, Colombia and to a lesser extent in Peru, with a total customer funds increase of +61.8, +8.3 and +4.7%, respectively.
Results
South America generated a net attributable profit of €591m, which represents year-on-year variation of -16.5% (-31.3% at current exchange rates). This evolution is affected by the negative impact of accounting for hyperinflation in Argentina in the net attributable profit of the area (€-266m) as well as by the change in the perimeter originated from the sale of BBVA Chile. Excluding these two impacts, the most recurrent income (net interest income and commissions) and NTI increased by 11.7% in year-on-year terms, which offsets the increase of the impairment losses on financial assets (up 5.2% compared to the close of 2017). As a result, the cumulative cost of risk at the close of December stood at 1.44%.
By country, the trends in 2018 were as follows:
- In Argentina, there was year-on-year growth in gross income of 29.2%. This increase was based both on the performance of recurring revenue (boosted by higher volumes of business) and the positive performance of NTI (mainly due to exchange rates). The aforementioned in combination with the increase in impairment losses on financial assets and the negative effect of hyperinflation adjustment posted a net attributable profit of -€29m.
- In Colombia, the increase in earnings was based on the good performance of net interest income (due to a positive performance in activity and customer spreads) and higher net fees and commissions, which boosted gross income (up 5.3%). The aforementioned, together with the reduction of impairment losses on financial assets, this led to a year-on-year increase of 16.6% in the net attributable profit.
- In Peru, net attributable profit increased by 14.3% year-on-year, leveraged by the good performance of net interest income (increase in lending), higher net fees and commissions and a good performance of the impairment losses on financial assets.
Rest of Eurasia
Highlights
- Positive trend in lending activity.
- Performance of deposits strongly influenced by the environment of negative interest rates.
- Despite the control costs, earnings affected by decrease in revenues.
- Improvement of the NPL and NPL coverage ratios.
Financial statements and relevant business indicators (Millions of euros and percentage)
| Income statement | IFRS 9 | IAS 39 | |
|---|---|---|---|
| 2018 | ∆% | 2017 | |
| Net interest income | 175 | (2.5) | 180 |
| Net fees and commissions | 138 | (15.9) | 164 |
| Net trading income | 101 | (17.3) | 123 |
| Other operating income and expenses | (0) | n.s. | 1 |
| Gross income | 415 | (11.4) | 468 |
| Operating expenses | (291) | (5.6) | (308) |
| Personnel expenses | (136) | (12.8) | (156) |
| Other administrative expenses | (149) | 5.4 | (141) |
| Depreciation | (6) | (44.2) | (11) |
| Operating income | 124 | (22.5) | 160 |
| Impairment on financial assets not measured at fair value through profit or loss | 24 | 4.0 | 23 |
| Provisions or reversal of provisions and other results | (3) | (40.4) | (6) |
| Profit/(loss) before tax | 144 | (18.5) | 177 |
| Income tax | (51) | (2.6) | (52) |
| Profit/(loss) for the year | 93 | (25.2) | 125 |
| Non-controlling interests | |||
| Net attributable profit | 93 | (25.2) | 125 |
| Balance sheets | IFRS 9 | IAS 39 | |
|---|---|---|---|
| 31-12-18 | ∆% | 31-12-17 | |
| Cash, cash balances at central banks and other demand deposits | 273 | (68.9) | 877 |
| Financial assets designated at fair value | 504 | (49.1) | 991 |
| of which loans and advances | |||
| Financial assets at amortized cost | 16,930 | 12.8 | 15,009 |
| of which loans and advances to customers | 15,731 | 5.8 | 14,864 |
| Inter-area positions | |||
| Tangible assets | 39 | 10.4 | 36 |
| Other assets | 254 | (27.8) | 352 |
| Total assets/liabilities and equity | 18,000 | 4.3 | 17,265 |
| Financial liabilities held for trading and designated at fair value through profit or loss | 42 | (6.3) | 45 |
| Deposits from central banks and credit institutions | 1,316 | (44.3) | 2,364 |
| Deposits from customers | 4,876 | (27.2) | 6,700 |
| Debt certificates | 213 | (39.9) | 354 |
| Inter-area positions | 9,977 | 76.8 | 5,643 |
| Other liabilities | 819 | (34.2) | 1,246 |
| Economic capital allocated | 757 | (17.1) | 913 |
| Relevant business indicators | 31-12-18 | ∆% | 31-12-17 |
|---|---|---|---|
| Performing loans and advances to customers under management (1) | 16,553 | 7.7 | 15,362 |
| Non-performing loans | 430 | (22.7) | 556 |
| Customer deposits under management (1) | 4,876 | (27.2) | 6,700 |
| Off-balance sheet funds (2) | 388 | 3.2 | 376 |
| Risk-weighted assets | 15,449 | (0.3) | 15,150 |
| Efficiency ratio (%) | 70.2 | 65.9 | |
| NPL ratio (%) | 1.7 | 2.4 | |
| NPL coverage ratio (%) | 83 | 74 | |
| Cost of risk (%) | (0.11) | (0.16) |
- (1) Excluding repos.
- (2) Includes mutual funds, pension funds and other off-balance sheet funds.
Macroeconomic environment
Growth in the Eurozone moderated in the third quarter of 2018 to 0.2% quarterly from 0.4% in the second quarter, according to the latest Eurostat information. This performance is mainly explained by a worse exports evolution, while the contribution of domestic demand remained stable despite the lower growth of private consumption. Domestic fundamentals remain solid, with an improvement in the labor market which, together with the moderation in prices, continues to support the growth of private spending, while favorable financial conditions and the absorption of the economy's idle capacity will continue to sustain the recovery of investment. For its part, the depreciation of the euro from the second quarter of 2018 will continue to support the competitiveness of exports. As a result, GDP growth could have been somewhat below 2% in 2018, after a total of 2.5% in 2017.
Headline inflation moderated to 1.6% in December after the strong rebound since mid-year due to the significant deceleration in the prices of energy products, while core inflation remained relatively stable at low levels (1.1%). In this context, the ECB announced the completion of asset purchases in December of 2018, although it will continue to reinvest in those that reach their maturity term and will maintain interest rates at low levels until, at least, the summer of 2019. The recent increase in downside risks to growth will keep the ECB cautious.
Activity and results
This business area basically includes the Group's retail and wholesale business in Europe (excluding Spain) and Asia.
The key aspects of the activity and results as of 31-December-2018 in this area were:
- Lending (performing loans under management) showed a year-on-year change of 7.7%.
- Credit risk indicators improved in the last twelve months: the NPL ratio closed at 1.7% (2.4% as of the close of 2017) and the NPL coverage ratio closed at 83% (74% as of 31-December-2017).
- Customer deposits under management were still strongly influenced by the negative interest rate environment in the region and showed a decline of 27.2%.
- Regarding results, gross income declined (-11.4% year-on-year): Europe (excluding Spain) fell by 13.6% and Asia grew by 11.0%. On the other hand, operating expenses continued to fall (down 5.6%), due to tight control of personnel costs. Impairments on financial assets recorded a release of provisions that were 4.0% higher than the previous year, as a result of lower loan-loss provisions in Europe. As a result, the cumulative net attributable profit of 2018 stood at €93 million (down 25.2% year-on-year).
Corporate Center
The Corporate Center basically includes the costs of the head offices that have a corporate function; management of structural exchange-rate positions; certain issuances of equity instruments to ensure adequate management of the Group's global solvency; portfolios and their corresponding earnings, whose management is not linked to customer relationships, such as industrial holdings; certain tax assets and liabilities; funds due to commitments with employees; goodwill and other intangibles. As of the end of 2018, the area includes the 20% participation that BBVA maintains in Divarian.
Financial statements (Millions of Euros and percentage)
| Income statement | IFRS 9 | IAS 39 | |
|---|---|---|---|
| 2018 | ∆% | 2017 | |
| Net interest income | (276) | (22.8) | (357) |
| Net fees and commissions | (59) | (32.1) | (86) |
| Net trading income | (155) | n.s. | 436 |
| Other operating income and expenses | 57 | (29.2) | 80 |
| Gross income | (432) | n.s. | 73 |
| Operating expenses | (920) | 3.6 | (888) |
| Personnel expenses | (507) | 2.4 | (496) |
| Other administrative expenses | (199) | 106.3 | (96) |
| Depreciation | (214) | (27.8) | (297) |
| Operating income | (1,352) | 65.9 | (815) |
| Impairment on financial assets not measured at fair value through profit or loss | (2) | (99.8) | (1,125) |
| Provisions or reversal of provisions and other results | (65) | (10.8) | (73) |
| Profit/(loss) before tax | (1,420) | (29.5) | (2,013) |
| Income tax | 290 | 75.0 | 166 |
| Profit/(loss) after tax from ongoing operations | (1,130) | (38.8) | (1,847) |
| Results from corporate operations (1) | 633 | ||
| Profit/(loss) for the year | (497) | (73.1) | (1,847) |
| Non-controlling interests | 3 | n.s. | (1) |
| Net attributable profit | (494) | (73.3) | (1,848) |
| Net attributable profit excluding results from corporate operations | (1,127) | (39.0) | (1,848) |
- (1) Includes net capital gains from the sale of BBVA Chile.
| Balance sheets | IFRS 9 | IAS 39 | |
|---|---|---|---|
| 31-12-18 | ∆% | 31-12-17 | |
| Cash, cash balances at central banks and other demand deposits | 119 | n.s. | 5 |
| Financial assets designated at fair value | 3,304 | 31.5 | 2,514 |
| of which loans and advances | |||
| Financial assets at amortized cost | |||
| of which loans and advances to customers | |||
| Inter-area positions | (7,314) | n.s. | (1,501) |
| Tangible assets | 1,567 | (17.2) | 1,893 |
| Other assets | 24,406 | 38.8 | 17,585 |
| Total assets/liabilities and equity | 22,084 | 7.7 | 20,497 |
| Financial liabilities held for trading and designated at fair value through profit or loss | |||
| Deposits from central banks and credit institutions | |||
| Deposits from customers | |||
| Debt certificates | 8,874 | 1.2 | 8,772 |
| Inter-area positions | (15,195) | (7.3) | (16,384) |
| Other liabilities | 153 | (65.5) | 443 |
| Economic capital allocated | (21,674) | (13.1) | (24,941) |
| Shareholders' funds | 49,927 | (5.1) | 52,606 |
The Corporate Center registered a net attributable loss of €494m during 2018, which positively compares with a loss of €1,848m in 2017. By entries, the most relevant are the following:
- Negative contribution from NTI, compared to the capital gains recorded, in the amount of €436m before taxes as of the end of 2017, from the market sales of the stakes in CNCB (€204m in the first quarter, for the sale of 1.7%, and €24m in the third quarter for the sale of the remaining 0.34%).
- Lower impairment on financial assets, as in 2017 this line registered the recognition of impairment losses of €1,123m from BBVA’s stake in Telefónica, S.A.
- The result of corporate operations includes the capital gains (net of taxes) originated by the sale of BBVA Chile, which amounts to €633m. Excluding this effect, the attributable profit without corporate operations, amounted to -€1,127m, representing a loss 39.0% lower than the amount registered twelve months earlier.