Group information
BBVA Group highlights
BBVA Group highlights (Consolidated figures)
| IFRS 9 | IAS 39 | |||
|---|---|---|---|---|
| 31-12-18 | ∆% | 31-12-17 | 31-12-16 | |
| Balance sheet (millions of euros) | ||||
| Total assets | 676,689 | (1.9) | 690,059 | 731,856 |
| Loans and advances to customers (gross) | 386,225 | (3.5) | 400,369 | 430,474 |
| Deposits from customers | 375,970 | (0.1) | 376,379 | 401,465 |
| Other customer funds | 128,103 | (5.0) | 134,906 | 132,092 |
| Total customer funds | 504,073 | (1.4) | 511,285 | 533,557 |
| Total equity | 52,874 | (0.8) | 53,323 | 55,428 |
| Income statement (millions of euros) | ||||
| Net interest income | 17,591 | (0.9) | 17,758 | 17,059 |
| Gross income | 23,747 | (6.0) | 25,270 | 24,653 |
| Operating income | 12,045 | (5.7) | 12,770 | 11,862 |
| Profit/(loss) before tax | 7,580 | 9.4 | 6,931 | 6,392 |
| Net attributable profit | 5,324 | 51.3 | 3,519 | 3,475 |
| The BBVA share and share performance ratios | ||||
| Number of shares (million) | 6,668 | - | 6,668 | 6,567 |
| Share price (euros) | 4.64 | (34.8) | 7.11 | 6.41 |
| Earning per share (euros) (1) | 0.76 | 55.9 | 0.48 | 0.49 |
| Book value per share (euros) | 7.12 | 2.2 | 6.96 | 7.22 |
| Tangible book value per share (euros) | 5.86 | 2.9 | 5.69 | 5.73 |
| Market capitalization (millions of euros) | 30,909 | (34.8) | 47,422 | 42,118 |
| Yield (dividend/price; %) | 5.4 | 4.2 | 5.8 | |
| Significant ratios (%) | ||||
| ROE (net attributable profit/average shareholders' funds +/- average accumulated other comprehensive income) (2) |
11.6 | 7.4 | 7.3 | |
| ROTE (net attributable profit/average shareholders' funds excluding intangible assets +/- average accumulated other comprehensive income) (2) |
14.1 | 9.1 | 9.2 | |
| ROA (profit or loss for the year/average total assets) | 0.91 | 0.68 | 0.64 | |
| RORWA (profit or loss for the year/average risk-weighted assets - RWA) | 1.74 | 1.27 | 1.19 | |
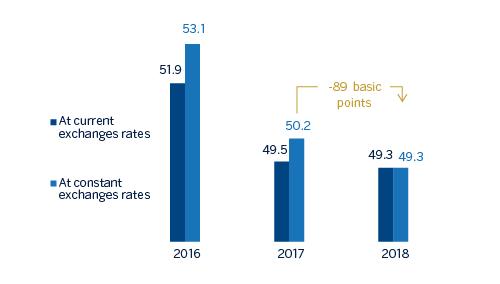
| Efficiency ratio | 49.3 | 49.5 | 51.9 | |
| Cost of risk | 1.01 | 0.89 | 0.85 | |
| NPL ratio | 3.9 | 4.6 | 5.0 | |
| NPL coverage ratio | 73 | 65 | 70 | |
| Capital adequacy ratios (%) | ||||
| CET1 fully-loaded | 11.3 | 11.1 | 10.9 | |
| CET1 phased-in (3) | 11.6 | 11.7 | 12.2 | |
| Tier 1 phased-in (3) | 13.2 | 13.0 | 12.9 | |
| Total ratio phased-in (3) | 15.7 | 15.5 | 15.1 | |
| Other information | ||||
| Number of shareholders | 902,708 | 1.3 | 891,453 | 935,284 |
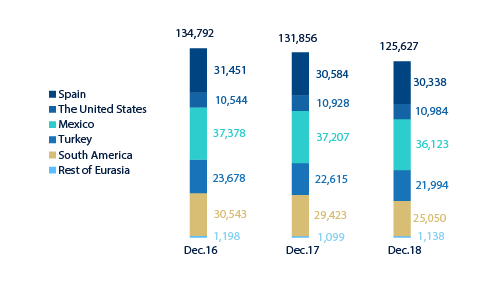
| Number of employees | 125,627 | (4.7) | 131,856 | 134,792 |
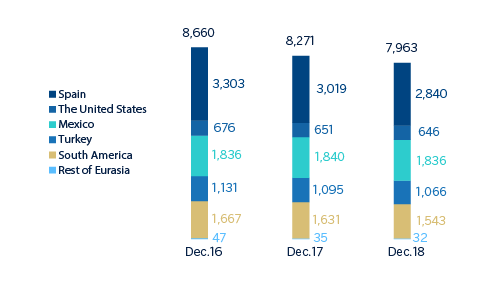
| Number of branches | 7,963 | (3.7) | 8,271 | 8,660 |
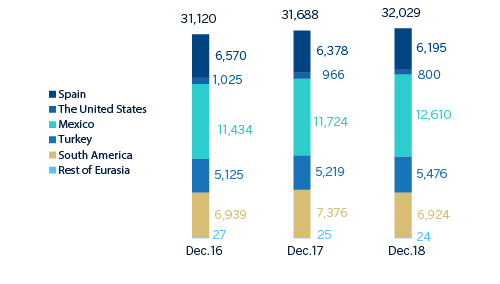
| Number of ATMs | 32,029 | 1.1 | 31,688 | 31,120 |
- General note: data as of 31-12-17 and 31-12-16 are presented for comparison purposes only.
- (1) Adjusted by additional Tier 1 instrument remuneration.
- (2) The ROE and ROTE ratios include, in the denominator, the Group’s average shareholders’ funds and take into account the item called “Accumulated other comprehensive income”, which forms part of the equity. Excluding this item, the ROE would stand at 10.1%, in 2018; 6.7%, in 2017; and 6.9%, in 2016; and the ROTE at 12.0%, 8.0% and 8.6%, respectively.
- (3) As of December,31 2018 phased-in ratios include the temporary treatment on the impact of IFRS 9, calculated in accordance with Article 473 bis of Capital Requirements Regulation (CRR). The capital ratios are calculated under CRD IV from Basel III regulation, in which a phase-in of 80% is applied for 2017 and a phase-in of 60% for 2016.
Relevant events
Results
- Generalized growth in the more recurring revenue items for almost all business areas.
- Containment trend in operating expenses, whose performance is affected by exchange rates trends.
- Lower amount of impairment on financial assets not measured at fair value through profit or loss (hereinafter, "impairment on financial assets") affected by the negative impact of the recognition in the fourth quarter of 2017 of impairment losses, amounting €1,123m from BBVA’s stake in Telefónica, S.A.
- The financial statements of the Group for 2018 include, on one hand, the negative impact derived from the accounting for hyperinflation in Argentina (-€266m) in the net attributable profit, and on the other hand, the positive impact on equity of €129m.
- The result of corporate operations amounted to €633m and includes the capital gains (net of taxes) arising from the sale of BBVA's equity stake in BBVA Chile.
- The net attributable profit was €5,324m, 51.3% higher than in 2017.
- Net attributable profit excluding results from corporate operations stood at €4,691m, up 33.3% higher than the result reached in 2017.
Net attributable profit (Millions of Euros)

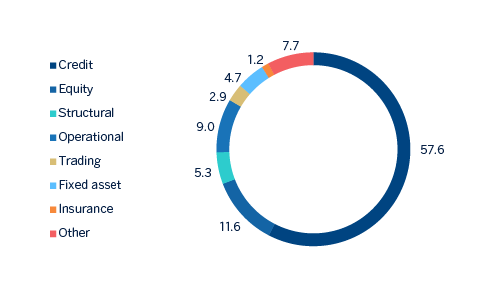
Net attributable profit breakdown (1) (Percentage. 2018)
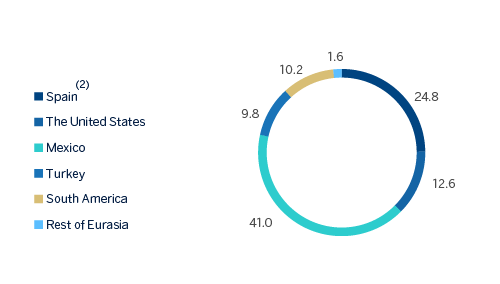
(1) Excludes the Corporate Center.
(2) Includes the areas Banking activity in Spain and Non Core Real Estate.
Balance sheet and business activity
- Lower volume of loans and advances to customers (gross); however, by business areas, in the United States, Mexico, South America (excluding BBVA Chile) and Rest of Eurasia volumes increased.
- Non-performing loans continue to reduce in 2018.
- Within off-balance-sheet funds, mutual funds continue to perform positively.
Solvency
- The capital position is above regulatory requirements.
- BBVA has once again excelled in EU-wide bank stress tests thanks to its resilience in the face of potential economic shocks. According to the exercise results, under the adverse scenario, BBVA is the second bank among its European peers with lower negative impact in CET1 fully-loaded capital ratio and one of the few banks with the ability to generate an accumulated profit in the three-year period under analysis (2018, 2019, and 2020), under this scenario.
Capital and leverage ratios (Percentage as of 31-12-18)

Risk management
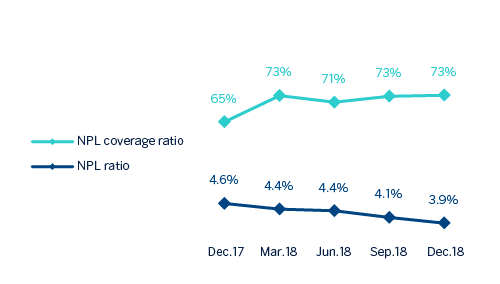
- Solid indicators of the main credit-risk metrics: as of 31-December-2018, the NPL ratio closed at 3.9%, the NPL coverage ratio at 73% and the cumulative cost of risk at 1.01%.
NPL and NPL coverage ratios (Percentage)
Transformation
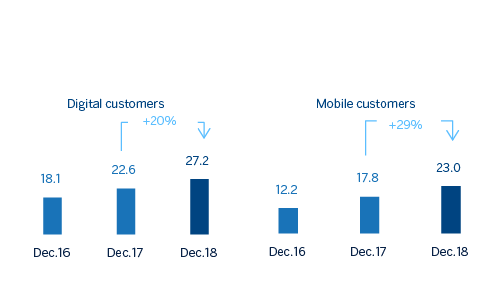
- The Group's digital and mobile customer base and digital sales continue to increase in all the geographic areas where BBVA operates with a positive impact in efficiency.
Digital and mobile customers (Million)
Appointments
- BBVA’s Board of Directors, in its meeting held on December 20, 2018, approved the succession plans for the Group Executive Chairman and for the Chief Executive Officer and appointed Carlos Torres Vila as Executive Chairman of BBVA, replacing Francisco González Rodríguez and Onur Genç as member of the Board of Directors and as Chief Executive Officer of BBVA. The Board of Directors also approved organisational changes, which involve changes at the senior management level of BBVA Group. On December, 21st, BBVA received the required administrative authorisations to give full effect to the resolutions approved.
Other matters of interest
- On December, 26th, BBVA reached an agreement with Voyager Investing UK Limited Partnership, an entity managed by Canada Pension Plan Investment Board (“CPPIB”) for the transfer of a credit portfolio mainly composed by non-performing and defaulted mortgage loans. The closing of the Transaction will be completed as soon as the relevant conditions are fulfilled, which is expected to occur within the second quarter of 2019. In addition, it is expected that the impact in the Group’s attributable profit, which is currently expected to be positive by €150m, net of taxes and other adjustments, and the impact in the Common Equity Tier 1 (fully-loaded), which is expected to be slightly positive.
- Impact of the initial implementation of IFRS 9: The figures corresponding to 2018 are prepared under International Financial Reporting Standard 9 (IFRS 9), which entered into force on January 1, 2018. This new accounting standard did not require the restatement of comparative information from prior periods, so the comparative figures shown for the year 2017 have been prepared in accordance with the IAS 39 (International Accounting Standard 39) regulation applicable at that time. The impacts derived from the first application of IFRS 9, as of January 1, 2018, were registered with a charge to reserves of approximately €900m (net of fiscal effect) mainly due to the allocation of provisions based on expected losses, compared to the model of losses incurred under the previous IAS 39.
In capital, the impact derived from the first application of IFRS 9 has been a reduction of 31 basis points with respect to the fully-loaded CET1 ratio of December 2017. - IFRS 16 came into effect on January 1, 2019, a standard on leases introduces a single lessee accounting model and will require lessees to recognize assets and liabilities of all lease contracts. The main impact in the Group is the recognition of the right-of-use assets and lease liabilities in an approximate amount of €3,600m mainly coming from the Group’s activity in Spain and lease of premises of its branch network. The estimated impact in terms of capital for the Group amounts to approximately -12 basis points in terms of CET1.
- Banco Bilbao Vizcaya Argentaria, S.A. (“BBVA, S.A.”) stand-alone financial statements: BBVA has estimated that, mainly due to the depreciation of the Turkish lira, there is an impairment of its participation in Garanti Bank that only affects the stand-alone financial statements of BBVA, S.A. For this reason, a negative adjustment for a net amount of €1,517m has been registered in the income statement of BBVA, S.A. for the year 2018. Total equity for BBVA, S.A. as of December 31, 2018 has decreased by this same amount. The impact on the fully-loaded CET1 capital ratio of BBVA, S.A. is approximately -10 basis points.
It is important to note that the recognition of this accounting impact in the stand-alone financial statements of BBVA, S.A. does not generate any impact on the Consolidated Group (neither on the attributed profit, total equity or capital ratios), it does not generate any additional cash outflow and will not affect the proposal of a dividend distribution to shareholders.
Results
BBVA generated a net attributable profit of €5,324m in 2018, which represents a year-on-year increase of 51.3% (+78.2% at constant exchange rates) that includes the results from corporate operations originated by the capital gains (net of taxes) from the sale of BBVA Chile. Moreover, at constant exchange rates, it is worth mentioning the good performance of recurring revenue, lower loan-loss impairments (affected by the negative impact of the recognition in the fourth quarter of 2017 of impairment losses, amounting €1,123m from BBVA stake in Telefónica, S.A.) and provisions, which offsets the lower contribution from net trading income (NTI) compared to the same period the previous year.
Consolidated income statement (Millions of Euros)
| IFRS 9 | IAS 39 | |||
|---|---|---|---|---|
| 2018 | ∆% | ∆% at constant exchange rates |
2017 | |
| Net interest income | 17,591 | (0.9) | 10.8 | 17,758 |
| Net fees and commissions | 4,879 | (0.8) | 8.9 | 4,921 |
| Net trading income | 1,223 | (37.8) | (33.9) | 1,968 |
| Dividend income | 157 | (52.9) | (52.0) | 334 |
| Share of profit or loss of entities accounted for using the equity method | (7) | n.s. | n.s. | 4 |
| Other operating income and expenses | (96) | n.s. | n.s. | 285 |
| Gross income | 23,747 | (6.0) | 4.3 | 25,270 |
| Operating expenses | (11,702) | (6.4) | 2.5 | (12,500) |
| Personnel expenses | (6,120) | (6.9) | 2.0 | (6,571) |
| Other administrative expenses | (4,374) | (3.7) | 6.1 | (4,541) |
| Depreciation | (1,208) | (12.9) | (6.5) | (1,387) |
| Operating income | 12,045 | (5.7) | 6.2 | 12,770 |
| Impairment on financial assets not measured at fair value through profit or loss | (3,981) | (17.1) | (12.0) | (4,803) |
| Provisions or reversal of provisions | (373) | (49.9) | (47.1) | (745) |
| Other gains (losses) | (110) | (62.1) | (63.0) | (292) |
| Profit/(loss) before tax | 7,580 | 9.4 | 30.4 | 6,931 |
| Income tax | (2,062) | (4.9) | 9.2 | (2,169) |
| Profit/(loss) after tax from ongoing operations | 5,518 | 15.9 | 40.6 | 4,762 |
| Results from corporate operations (1) | 633 | - | - | - |
| Profit/(loss) for the year | 6,151 | 29.2 | 56.7 | 4,762 |
| Non-controlling interests | (827) | (33.5) | (11.7) | (1,243) |
| Net attributable profit | 5,324 | 51.3 | 78.2 | 3,519 |
| Net attributable profit excluding results from corporate operations | 4,691 | 33.3 | 57.0 | 3,519 |
| Earning per share (euros) (2) | 0.76 | - | - | 0.48 |
- (1) Includes net capital gains from the sale of BBVA Chile.
- (2) Adjusted by additional Tier 1 instrument remuneration.
Unless expressly indicated otherwise, to better understand the changes in the main headings of the Group's income statement, the year-on-year percentage changes provided below refer to constant exchange rates.
Gross income
Gross income accumulated in the period grew by 4.3% year-on-year, supported by the positive performance of the more recurring items.
Net interest income grew by 10.8% year-on-year, leveraged mainly by higher contribution from inflation-linked bonds in Turkey. The other business areas, with the exception of Spain and Rest of Eurasia, also registered positive year-on-year changes, with Mexico, South America and the United States standing out, in this order, for its contribution.
On the other hand, cumulative net fees and commissions (up 8.9% year-on-year) also registered a favorable evolution highly driven by their diversification.
As a result, the more recurring revenue items (net interest income plus net fees and commissions) increased by 10.4% year-on-year.
NTI in 2018 moderated in comparison with the previous year, when it was exceptionally high, largely due to the registration of the capital gains of €228m before taxes, from market sales of the stake in China Citic Bank (CNCB): €204m in the first quarter, from the sale of 1.7% stake, and €24m in the third quarter from the sale of the remaining 0.34%. There have also been lower sales of ALCO portfolios in Spain in the first nine months of 2018 compared to the same period of the previous year. By business areas, NTI had a good performance in South America and Turkey.
Other operating income and expenses closed at -€96m in 2018 compared to €285m in 2017, mainly due to negative impact of the hyperinflation in Argentina which meant -€323m in this line of the income statement. The change is also explained by the higher contribution, amounting to €44m, to the Single Resolution Fund (SRF) and Deposit Guarantee Fund (DGF) in Spain. The net contribution of the insurance business grew by 8.7% in cumulative terms.
Operating income
Operating expenses in 2018 registered an increase of 2.5%, year-on-year, well below the inflation rate recorded in the main countries where BBVA is present (down 6.4% at current exchange rates). Cost discipline has been maintained in all the Group's areas through various efficiency plans. By business area the biggest year-on-year reductions were in Banking activity in Spain and Non Core Real Estate. In the United States, Mexico and Turkey the growth of operating expenses was lower than the growth of gross income.
Breakdown of operating expenses and efficiency calculation (Millions of Euros)
| 2018 | ∆% | 2017 | |
|---|---|---|---|
| Personnel expenses | 6,120 | (6.9) | 6,571 |
| Wages and salaries | 4,786 | (7.3) | 5,163 |
| Employee welfare expenses | 869 | (4.6) | 911 |
| Training expenses and other | 465 | (6.4) | 497 |
| Other administrative expenses | 4,374 | (3.7) | 4,541 |
| Property, fixtures and materials | 982 | (5.0) | 1.033 |
| IT | 1,133 | 11.2 | 1,018 |
| Communications | 235 | (12.7) | 269 |
| Advertising and publicity | 336 | (4.5) | 352 |
| Corporate expenses | 109 | (0.8) | 110 |
| Other expenses | 1,162 | (10.7) | 1,301 |
| Levies and taxes | 417 | (8.6) | 456 |
| Administration costs | 10,494 | (5.6) | 11,112 |
| Depreciation | 1,208 | (12.9) | 1,387 |
| Operating expenses | 11,702 | (6.4) | 12,500 |
| Gross income | 23,747 | (6.0) | 25,270 |
| Efficiency ratio (operating expenses/gross income; %) | 49.3 | 49.5 |
Number of employees
Number of branches
Number of ATMs
As a consequence of this evolution of operating expenses, the efficiency ratio stood at 49.3% and the operating income posted a year-on-year growth of 6.2% (+9.4% in the last quarter of 2018).
Efficiency ratio (Percentage)
Provisions and other
Impairment on financial assets in 2018 decreased by 12.0% in comparison with the figure for 2017, affected by the negative impact of the recognition in 2017 of impairment losses, amounting €1,123m from BBVA stake in Telefónica, S.A. as a result of the evolution of the price of the latter and in compliance with the requirements of the accounting standard IAS 39 which was in force at that point in time. By business area, they continued to fall in Spain, due to lower loan-loss provisioning requirements for large customers. In contrast, they increased, especially in Turkey, due to the deterioration of the macroeconomic scenario and some wholesale-customers and to a lesser extent in South America. On the other hand, Mexico stood in line with 2017.
The heading provisions or reversal of provisions (hereinafter, provisions) was 47.1% lower than the figure of 2017, as a result of lower restructuring costs in 2018. The line other gains (losses) showed a negative balance, due mainly to certain operations with an unfavorable effect from the Non Core Real Estate area, recorded in the last quarter.
The heading results from corporate operations amounted to €633m and registered the capital gains (net of taxes) originated by the sale of BBVA’S equity stake in BBVA Chile.
Results
As a result of the above, the Group's net attributable profit accumulated in 2018 reached an amount of €5,324m and continued to show a very positive year-on-year evolution (up 78.2% at constant exchange rates, up 51.3% at current exchange rates). The net attributable profit, excluding results from corporate operations, stood at €4,691m, or 33.3% higher than the amount recorded for the previous year, when operations of this kind were not carried out (up 57.0% at constant exchange rates).
By business area, Banking activity in Spain generated a profit of €1,522m, Non Core Real Estate a loss of €78m, the United States contributed a profit of €735m, Mexico registered €2,384m, Turkey contributed a profit of €569m, South America €591m and the Rest of Eurasia €93m.
ROE and ROTE (1) (Percentage)
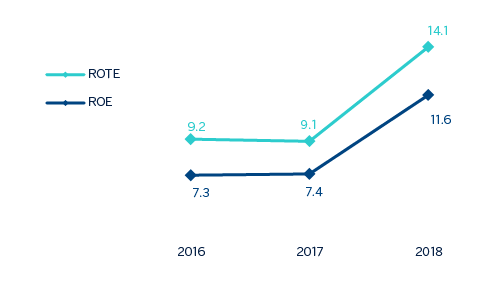
(1) The ROE and ROTE ratios include, in the denominator, the Group’s average shareholders’ funds and take into account the item called “Accumulated other comprehensive income”, which forms part of the equity. Excluding this item, the ROE would stand at 6.9% in 2016, 6.7% in 2017 and 10.1% in 2018; and the ROTE on 8.6%, 8.0% and 12.0%, respectively.
ROA and RORWA (Percentage)

Balance sheet and business activity
The year-on-year comparison of the Group's balance sheet and business activity has been affected by the sale of BBVA Chile, completed in July 2018 and therefore as of December 31, 2018, was not included within BBVA’s perimeter.
The evolution of the Group's balance sheet and activity are presented below, from the opening balance sheet after the first implementation of IFRS 9 until the end of December 2018. These figures include the new categories comprised in the aforementioned standard.
Regarding the Group's activity, the most significant aspects during this period are summarized below:
- Lower volume of loans and advances to customers (gross); however, by business area, in the United States, Mexico, South America (excluding BBVA Chile) and Rest of Eurasia volumes increased.
- Non-performing loans fell mainly due to a favorable trend in Spain and, to a lesser extent, in South America and Rest of Eurasia.
- The headings of other assets and other liabilities are affected by the sale of BBVA Chile completed in July 2018. Until then, these items included BBVA Chile's balance sheet reclassified in the category of non-current assets and liabilities held for sale.
- In deposits from customers, time deposits showed a decrease, offset by an increase in demand deposits, particularly in Spain.
- In off-balance-sheet funds, mutual funds continued to perform well.
Consolidated balance sheet (Millions of euros)
| 31-12-18 | ∆% | 01-01-18 | ||
|---|---|---|---|---|
| Cash, cash balances at central banks and other demand deposits | 58,196 | 36.4 | 42,680 | |
| Financial assets held for trading | 90,117 | (1.9) | 91,854 | |
| Non-trading financial assets mandatorily at fair value through profit or loss | 5,135 | 15.4 | 4,451 | |
| Financial assets designated at fair value through profit or loss | 1,313 | 28.9 | 1,019 | |
| Financial assets at fair value through accumulated other comprehensive income | 56,337 | (9.3) | 62,115 | |
| Financial assets at amortized cost | 419,660 | (0.5) | 421,685 | |
| Loans and advances to central banks and credit institutions | 13,103 | (26.0) | 17,716 | |
| Loans and advances to customers | 374,027 | 0.0 | 374,009 | |
| Debt securities | 32,530 | 8.6 | 29,959 | |
| Investments in subsidiaries. joint ventures and associates | 1,578 | (0.7) | 1,589 | |
| Tangible assets | 7,229 | 0.5 | 7,191 | |
| Intangible assets | 8,314 | (1.8) | 8,464 | |
| Other assets | 28,809 | (40.4) | 48,368 | |
| Total assets | 676,689 | (1.8) | 689,414 | |
| Financial liabilities held for trading | 80,774 | (0.0) | 80,783 | |
| Other financial liabilities designated at fair value through profit or loss | 6,993 | 27.3 | 5,495 | |
| Financial liabilities at amortized cost | 509,185 | 0.6 | 506,118 | |
| Deposits from central banks and credit institutions | 59,259 | (14.0) | 68,928 | |
| Deposits from customers | 375,970 | 3.4 | 363,689 | |
| Debt certificates | 61,112 | (0.9) | 61,649 | |
| Other financial liabilities | 12,844 | 8.4 | 11,851 | |
| Liabilities under insurance and reinsurance contracts | 9,834 | 6.6 | 9,223 | |
| Other liabilities | 17,029 | (51.9) | 35,392 | |
| Total liabilities | 623,814 | (2.1) | 637,010 | |
| Non-controlling interests | 5,764 | (17.7) | 7,008 | |
| Accumulated other comprehensive income | (7,215) | 2.6 | (7,036) | |
| Shareholders’ funds | 54,326 | 3.6 | 52,432 | |
| Total equity | 52,874 | 0.9 | 52,404 | |
| Total liabilities and equity | 676,689 | (1.8) | 689,414 | |
| Memorandum item: | ||||
| Guarantees given | 47,574 | 5.2 | 47,668 |
Loans and advances to customers (Millions of euros)
| IFRS 9 | IAS 39 | |||
|---|---|---|---|---|
| 31-12-18 | ∆% | 31-12-17 | ||
| Public sector | 28,504 | (4.7) | 29,921 | |
| Individuals | 170,501 | 3.6 | 164,578 | |
| Mortgages | 111,527 | (0.7) | 112,274 | |
| Consumer | 33,063 | 3.0 | 32,092 | |
| Credit cards | 13,507 | (0.9) | 13,630 | |
| Other loans | 12,404 | 88.5 | 6,581 | |
| Business | 170,872 | (8.4) | 186,479 | |
| Non-performing loans | 16,348 | (15.7) | 19,390 | |
| Loans and advances to customers (gross) | 386,225 | (3.5) | 400,369 | |
| Loan-loss provisions | (12,199) | (4.3) | (12.748) | |
| Loans and advances to customers | 374,027 | (3.5) | 387,621 | |
Loans and advances to customers (gross)
(Billions of Euros)

(1) At constant exchange rates: -0.2%.
Customer funds (Billions of Euros)

(1) At constant exchange rates: +0.6%.
Customer funds (Millions of Euros)
| IFRS 9 | IAS 39 | |||||
|---|---|---|---|---|---|---|
| 31-12-18 | ∆% | 31-12-17 | ||||
| Deposits from customers | 375,970 | (0.1) | 376,379 | |||
| Of which current accounts | 260,573 | 8.2 | 240,750 | |||
| Of which time deposits | 108,313 | (6.4) | 115,761 | |||
| Other customer funds | 128,103 | (5.0) | 134,906 | |||
| Mutual funds and investment companies | 61,393 | 0.7 | 60,939 | |||
| Pension funds | 33,807 | (0.5) | 33,985 | |||
| Other off-balance sheet funds | 2,949 | (4.3) | 3,081 | |||
| Customer portfolios | 29,953 | (18.8) | 36,901 | |||
| Total customer funds | 504,073 | (1.4) | 511,285 | |||
Solvency
Capital base
The fully-loaded CET1 ratio stood at 11.3% for the period ended December 31, 2018. In the third quarter of 2018, the sale of the stake in BBVA Chile generated a positive impact on the fully-loaded CET1 ratio of 50 basis points. Additionally, the transfer of BBVA’s real estate business in Spain to Cerberus had a positive impact on the ratio, although it was not material. It is noted that this ratio includes the impact of -31 basis points for first application of IFRS 9, which came into force January 1, 2018. In this context, the Parliament and the European Commission have established transitional arrangements that are voluntary for the institutions, adapting the impact of IFRS 9 on capital adequacy ratios. The Group has informed the supervisory body of its adherence to these arrangements.
Risk-weighted assets (RWA) have decreased in the year, mainly due to the sale of BBVA Chile and the depreciations of currencies against the euro. During 2018, the Group carried out three securitizations whose impact, through the release of risk weighted assets, was a positive in the amount of €971m. In addition, BBVA received European Central Bank (ECB) authorization to update the RWA calculation by structural exchange rate risk under the standard model.
Capital base (Millions of euros)
| CRD IV phased-in | CRD IV fully-loaded | |||
|---|---|---|---|---|
| 31-12-18 (1) | 31-12-17 | 31-12-18 (1) | 31-12-17 | |
| Common Equity Tier 1 (CET 1) | 40,311 | 42,341 | 39,569 | 40,061 |
| Tier 1 | 45,945 | 46,980 | 45,044 | 46,316 |
| Tier 2 | 8,754 | 9,134 | 8,859 | 8,891 |
| Total Capital (Tier 1 + Tier 2) | 54,699 | 56,114 | 53,903 | 55,207 |
| Risk-weighted assets | 348,254 | 361,686 | 348,795 | 361,686 |
| CET1 (%) | 11.6 | 11.7 | 11.3 | 11.1 |
| Tier 1 (%) | 13.2 | 13.0 | 12.9 | 12.8 |
| Tier 2 (%) | 2.5 | 2.5 | 2.5 | 2.5 |
| Total capital ratio (%) | 15.7 | 15.5 | 15.5 | 15.3 |
- General note: as of December 31 of 2018, the main difference between the phased-in and fully loaded ratios arises from the temporary treatment of the impact of IFRS 9, to which the BBVA Group has adhered voluntarily (in accordance with Article 473bis of the CRR).
- (1) Preliminary data. Excludes the February 2014 issuance of 1,500 million euros from AT1 and which will be amortized in advance in February 2019.
Regarding capital issues, during the first part of the year, the Group computed a new issuance in the amount of US$1,000m, carried out in November 2017, of contingent convertible bonds that may be converted into ordinary shares (CoCos) as an AT1 instrument. In May, another AT1 instrument for US$1,500m issued in 2013 was redeemed early. During the second part of the year, in September, the Group carried out a new issuance of contingent convertible bonds for €1,000m and more recently, in January 2019, announced that it would exercise the early redemption option for the AT1 instrument for €1,500m issued in February 2014.
The Group has continued with its program to meet the MREL requirements, published in May 2018, by closing two public issuances of non-preferred senior debt for a total of €2,500m. The Group estimates that it is currently in line with this MREL requirement.
Regarding shareholder remuneration, on October, 10th BBVA paid a cash dividend with a gross amount of €0.10 per share against the 2018 fiscal year account. In addition, on April 10, 2018, BBVA paid a final dividend against the 2017 fiscal year account for an amount of €0.15 gross per share, also in cash. Both distributions are consistent with the Group’s shareholder remuneration policy, which consists of maintaining a pay-out ratio of 35-40% of recurring profit.
As of December 31, 2018, the phased-in CET1 ratio stood at 11.6%, taking into account the impact of the initial implementation of IFRS 9. Tier 1 capital stood at 13.2% and Tier 2 at 2.5% resulting in a total capital ratio of 15.7%. These levels are above the requirements established by the regulator in its SREP letter and the systemic buffers applicable in 2018 for BBVA Group. Since January 1, 2018, the requirement has been established at 8.438% for the phased-in CET1 ratio and 11.938% for the total capital ratio. The change with respect to 2017 is due to the steady implementation of the capital conservation buffers and the capital buffer applicable to other systemically important banks. The regulatory requirement for 2018 in fully-loaded terms remained unchanged (CET1 of 9.25% and total ratio of 12.75%) compared with the previous year.
Finally, the Group's leverage ratio maintained a solid position, at 6.4% fully-loaded (6.5% phased-in), which is still the highest of its peer group.
Ratings
During the first half of the year 2018, Moody's, S&P and DBRS upgraded one notch BBVA's rating to A3, A- and A (high), respectively. During the second half of 2018, the three leading agencies Moody´s, S&P and Fitch reaffirmed the rating given to BBVA (A3, A- and A-, respectively), although both S&P and Fitch placed its perspective in negative due to the evolution of the economy in Turkey (both agencies) and Mexico (Fitch). At present, all agencies assign to BBVA a category “A” rating, which did not occur since mid-2012, thus recognizing the strength and robustness of BBVA’s business model.
Ratings
| Rating agency | Long term | Short term | Outlook |
|---|---|---|---|
| DBRS | A (high) | R-1 (middle) | Stable |
| Fitch | A- | F-2 | Negative |
| Moody’s (1) | A3 | P-2 | Stable |
| Scope Ratings | A+ | S-1+ | Stable |
| Standard & Poor’s | A- | A-2 | Negative |
- (1) Additionally, Moody’s assigns an A2 rating to BBVA’s long term deposits.
Risk management
Credit risk
BBVA Group's risk metrics continued to perform well along 2018:
- Credit risk decreased by 3.6% throughout 2018 or -0.4% isolating the impact of the sale of BBVA Chile (-1.8% and +1.3%, respectively, at constant exchange rates), mainly due to lower activity in Non Core Real Estate and contraction in Turkey and South America due to the exchange rates evolution. During the fourth quarter credit risk increased by +1.3% (+0.6% at constant exchange rates).
- The balance of non-performing loans decreased throughout 2018 by -16.6% (-11.1% in constant terms), highlighting the good performance of the Banking activity in Spain and Non Core Real Estate. Wholesale customers in Turkey and the United States deteriorated, having a negative impact in its balance of non-performing loans. In the last quarter of 2018 there was a decrease of 3.4% at current exchange rates (-0.5% at constant exchange rates).
- The NPL ratio stood at 3.9% as of December 31, 2018, a reduction of 19 basis points with respect to September 30, 2018 and of 61 basis points throughout the year.
- Loan-loss provisions decreased by 6.2% during the last 12 months (-0.3% at constant exchange rates) whereas the decrease over the quarter amounted to 3.1% (-2.5% at constant exchange rates).
- NPL coverage ratio closed at 73% with an improvement of 812 basis points over the year and 26 basis points in the last 3 months.
- The cumulative cost of risk (1) through December 2018 was 1.01%, +13 basis points higher than the figure for 2017.
Non-performing loans and provisions (Millions of Euros)

(1) The cumulative cost of risk, including provisions for real estate assets stood at 0.93% in 2016, 0.97% in 2017 and 1.03% in 2018.
Credit risk (1) (Millions of Euros)
| 31-12-18 | 30-09-18 | 30-06-18 (2) | 31-03-18 (2) | 31-12-17 (2) | |
|---|---|---|---|---|---|
| Credit risk | 433,799 | 428,318 | 451,587 | 442,446 | 450,045 |
| Non-performing loans | 17,087 | 17,693 | 19,654 | 19,516 | 20,492 |
| Provisions | 12,493 | 12,890 | 13,954 | 14,180 | 13,319 |
| NPL ratio (%) | 3.9 | 4.1 | 4.4 | 4.4 | 4.6 |
| NPL coverage ratio (%) | 73 | 73 | 71 | 73 | 65 |
- (1) Include gross loans and advances to customers plus guarantees given.
- (2) Figures without considering the classification of non-current assets held for sale.
Non-performing loans evolution (Millions of euros)
| 4Q 18 (1) | 3Q 18 | 2Q 18 (2) | 1Q 18 (2) | 4Q 17 (2) | |
|---|---|---|---|---|---|
| Beginning balance | 17,693 | 19,654 | 19,516 | 20,492 | 20,932 |
| Entries | 3,005 | 2,168 | 2,596 | 2,065 | 3,757 |
| Recoveries | (1,548) | (1,946) | (1,655) | (1,748) | (2,142) |
| Net variation | 1,456 | 222 | 942 | 317 | 1,616 |
| Write-offs | (1,681) | (1,606) | (863) | (913) | (1,980) |
| Exchange rate differences and other | (382) | (576) | 59 | (380) | (75) |
| Period-end balance | 17,087 | 17,693 | 19,654 | 19,516 | 20,492 |
| Memorandum item: | |||||
| Non-performing loans | 16,348 | 17,045 | 18,627 | 18,569 | 19,753 |
| Non performing guarantees given | 739 | 649 | 1,027 | 947 | 739 |
- (1) Preliminary data.
- (2) Figures without considering the reclassification of non-current assets held for sale.
Structural risks
Liquidity and funding
Management of liquidity and funding in BBVA aims to finance the recurring growth of the banking business at suitable maturities and costs, using a wide range of instruments that provide access to a large number of alternative sources of financing, always in compliance with current regulatory requirements.
Due to its subsidiary-based management model, BBVA Group is one of the few large European banks that follows the MPE resolution strategy ("Multiple Point of Entry"): the parent company sets the liquidity and risk policies, but the subsidiaries are self-sufficient and responsible for the managing their liquidity (taking deposits or accessing the market with their own rating), without funds transfer or financing occurring between either the parent company and the subsidiaries or between different subsidiaries. This principle limits the spread of a liquidity crisis among the Group's different areas and ensures that the cost of liquidity and funding is correctly reflected in the price formation process.
The financial soundness of the Group's banks continues to be based on the funding of lending activity, fundamentally through the use of stable customer funds. During 2018, liquidity conditions remained comfortable across BBVA Group's global footprint:
- In the Eurozone, the liquidity situation is still comfortable, reducing the credit gap and growth in customer deposits.
- In the United States, the liquidity situation is adequate. The credit gap increased during the year due to the dynamism of consumer and commercial credit as well as to the cost-containment strategy for deposits, in an environment of competition in prices and rising rates.
- In Mexico, the liquidity position is sound as the environment has improved after the electoral process and the new commercial agreement with the United States. The credit gap has widened year-to-date due to deposits growing less than lending.
- The liquidity situation in Turkey is stable, showing a reduction in the credit gap as a result of deposits growing faster than lending.
- In South America, the liquidity situation remains comfortable in all geographies. In Argentina, despite the volatility of the markets which has been reducing at the end of the year, the liquidity situation is adequate.
The wholesale funding markets in the geographic areas where the Group operates continued to be stable, with the exception of Turkey where the volatility increased during the third quarter, having stabilized in the fourth quarter with the renewal of the maturities of syndicated loans of different entities.
The main operations carried out by the entities that form part of the BBVA Group during 2018 were:
- BBVA, S.A. completed three operations: an issuance of senior non-preferred debt for €1.5 billion, with a floating coupon at 3-month Euribor plus 60 basis points and a maturity of five years. It also carried out the largest issuance made by a financial institution in the Eurozone of the so-called “green bonds" (€1 billion). It was a 7-year senior non-preferred debt issuance, which made BBVA the first Spanish bank to carry out this type of issuance. The high demand allowed the price to be lowered to mid-swap plus 80 basis points. Finally, BBVA carried out an issuance of preferred securities contingently convertible into newly issued ordinary shares of BBVA (CoCos). This transaction was, for the first time, available to Spanish institutional investors and it was registered with the CNMV for an amount of €1 billion, an annual coupon of 5.875% for the first five years and amortization option from the fifth year. Additionally, it closed a private issuance of Tier 2 subordinated debt for US$300m, with a maturity of 15 years, with a coupon of 5.25%.
- In the United States, BBVA Compass issued in June a senior debt bond for US$1.15 billion in two tranches, both at three years: US$700m at a fixed rate with a reoffer yield of 3.605%, and US$450m at a floating rate of 3-month Libor plus 73 basis points.
- In Mexico, BBVA Bancomer completed an international issuance of subordinated Tier 2 debt of US$1 billion. The instrument was issued at a price equivalent to Treasury bonds plus 265 basis points at a maturity of 15 years, with a ten-year call (BBVA Bancomer 15NC10). In addition, two new Banking Securities Certificates were issued for 7 billion Mexican pesos in two tranches, one of them being the first green bond issued by a private bank in Mexico (3.5 billion Mexican pesos at three years at TIIE28 + 10 basis points).
- In Turkey, Garanti issued the first private bond in emerging markets for US$75m over six years, to support women's entrepreneurship, and renewed the financing of two syndicated loans.
- On the other hand, in South America, in Chile, Forum issued senior debt on the local market for an amount equivalent to €108m and BBVA Peru issued a three-year senior debt in the local market for an aggregate amount of €53m.
As of December 31, 2018, the liquidity coverage ratio (LCR) in BBVA Group remained comfortably above 100% in the period and stood at 127%. For the calculation of the ratio it is assumed that there is no transfer of liquidity among subsidiaries; i.e. no kind of excess liquidity levels in the subsidiaries abroad are considered in the calculation of the consolidated ratio. When considering this excess liquidity levels, the ratio would stand at 154% (27 percentage points above 127%). All the subsidiaries remained comfortably above 100% (Eurozone, 145%; Mexico, 154%; Turkey, 209%; and the United States, 143%).
Foreign exchange
Foreign-exchange risk management of BBVA’s long-term investments, basically stemming from its franchises abroad, aims to preserve the Group's capital adequacy ratios and ensure the stability of its income statement.
The year 2018 was notable for the depreciation against the euro of the Turkish lira (down 25.0%) and the Argentine peso (down 47.8%), while the Mexican peso (+5.2%) and the U.S. Dollar (+4.7%) appreciated. BBVA has maintained its policy of actively hedging its main investments in emerging countries, covering on average between 30% and 50% of the earnings for the year and around 70% of the excess of CET1 capital ratio. In accordance with this policy, the sensitivity of the CET1 ratio to a depreciation of 10% of the main emerging currencies (Mexican peso or Turkish lira) against the euro remains at around a negative two basis points for each of these currencies. In the case of the dollar, the sensitivity is approximately a positive eleven basis points to a depreciation of 10% of the dollar against the euro, as a result of RWAs denominated in U.S. Dollar outside the United States. The coverage level of the expected earnings for 2019, at the closing of January, 2019 is, 85% for Mexico and 30% for Turkey.
Interest rates
The aim of managing interest-rate risk is to maintain a sustained growth of net interest income in the short and medium-term, irrespective of interest-rate fluctuations, while controlling the impact on capital through the valuation of the portfolio of financial assets at fair value with changes reflected in other accumulated comprehensive income.
The Group's banks have fixed-income portfolios to manage their balance-sheet structure. During 2018, the results of this management were satisfactory, with limited risk strategies in all the Group's banks. Their capacity of resilience to market events has allowed them to face the cases of Italy and Turkey.
After the formation of the new government in Italy, the reaction of the market to the budget negotiation process has contributed to the sustained pressure on the Italian debt, however without significant impact on the capital ratio.
In Turkey, an excessive economic growth have given rise to inflationary tensions that, together with the level of current account deficits, have weakened the Turkish Lira. In this context, the Central Bank of Turkey (CBRT) has raised rates to contain the depreciation of the currency. Risk management and bond portfolio with a high component of inflation-linked bonds have stabilized the net interest income and limited impact on the capital ratio.
Finally, it is worth noting the following monetary policies pursued by the different central banks in the main geographical areas where BBVA operates:
- No relevant changes in the Eurozone, where interest rates remain at 0% and the deposit facility rate at -0.40%.
- In the United States the upward trend in interest rates continues. The increases of 25 basis points each in March, June, September and December, left the rate at 2.50%.
- In Mexico, after making two increases in the first half of the year, Banxico raised them again twice in the fourth quarter from 7.75% to 8.25%
- In Turkey, after the increases in the first three quarters of the year, the central bank maintained the average interest rate at 24.00% in the fourth quarter.
- In South America, the monetary authorities of Colombia and Peru have maintained their reference rates flat throughout the quarter, considering in its decision the behavior of inflation next to the established goals, as well as the dynamics of domestic demand. In Argentina, the adopted measures at the beginning of the quarter in terms of monetary policy (increase in reserve requirements and the reference rate) in order not to increase the monetary base and curb inflation which have delivered their results, with a certain deceleration in inflation.
Economic capital
Consumption of economic risk capital (ERC) at the close of December 2018, in consolidated terms, was €31,177m, equivalent to a decline of 0.8% compared to September 2018. Variation within exact time period and at constant exchange rates was down 2.1%, which is mainly explained by structural risk associated with the transfer of the real estate assets of BBVA in Spain to Cerberus Capital Management, L.P. (Cerberus). There were also less relevant decreases in credit risk and equity (goodwill).
Consolidated economic risk capital breakdown
(Percentage as of December 2018)
The BBVA share
Global economic growth maintained a robust growth of approximately 3.6% in 2018, although slowed more than expected during the second half of 2018, due to both the poorer performance seen by retailers and the industrial sector along with a strong increase in financial tensions, especially in the developed economies, as a result of higher uncertainty. Poorer economic figures in Europe and China was accompanied by downwards trends in Asian countries and a cyclical deterioration in the United States. In this context, both the Federal Reserve (Fed) and the ECB have been more cautious and patient in the path towards monetary policy normalization and their decisions going forward will depend on the performance of the economy. The main short-term risk continues to be protectionism, not only because of the direct impact of the commercial channel, but also because its indirect effect on confidence and on financial volatility. Additionally, there are concerns about the intensity of the adjustment on economic activity during the following quarters, both in the United States and in China.
Most stock-market indices showed a downward trend during 2018. In Europe, the Stoxx 50 and the Euro Stoxx 50 fell by 13.1% and 14.3%, respectively. On the other hand, in Spain, the Ibex 35 lost 15.0% over the same period. Finally, in the United States the S&P 500 index fell 6.2% in the last twelve months, mainly due to the decline in the last quarter (down 14.0%).
In particular, the banking sector indices were notably more negative during 2018 than these general indices. The European Stoxx Banks index, which includes British banks, lost 28.0%, and the Eurozone bank index, the Euro Stoxx Banks, was down 33.3%, while in the United States the S&P Regional Banks index declined 20.5% in comparison at the close of 2017.
The BBVA share closed 2018 at €4.64, a fall of 34.8% for this year.
BBVA share evolution compared with European indices (Base indice 100=31-12-17)

The BBVA share and share performance ratios
| 31-12-18 | 31-12-17 | |
|---|---|---|
| Number of shareholders | 902,708 | 891,453 |
| Number of shares issued | 6,667,886,580 | 6,667,886,580 |
| Daily average number of shares traded | 35,909,997 | 35,820,623 |
| Daily average trading (million euros) | 213 | 252 |
| Maximum price (euros) | 7.73 | 7.93 |
| Minimum price (euros) | 4.48 | 5.92 |
| Closing price (euros) | 4.64 | 7.11 |
| Book value per share (euros) | 7.12 | 6.96 |
| Tangible book value per share (euros) | 5.86 | 5.69 |
| Market capitalization (million euros) | 30,909 | 47,422 |
| Yield (dividend/price; %) (1) | 5.4 | 4.2 |
- (1) Calculated by dividing shareholder remuneration over the last twelve months by the closing price of the period.
Regarding shareholder remuneration, on October 10, BBVA paid in cash a gross amount of €0.10 per share on account of the 2018 fiscal year. This payment is consistent with the shareholder remuneration policy announced by Relevant Event of February 1, 2017, that envisages, subject to the pertinent approvals by the corresponding corporate bodies, the payment of two dividends in cash, foreseeably on October and April of each year. It is expected to be proposed for the consideration of the competent governing bodies a cash payment in a gross amount of euro 0.16 per share to be paid in April 2019 as final dividend for 2018.
Shareholder remuneration (Gross euros/share)

As of December 31, 2018, the number of BBVA shares remained at 6,668 million, and the number of shareholders was 902,708. By type of investor, residents in Spain held 44.82% of the share capital, while the remaining 55.18% was owned by non-resident shareholders.
Shareholder structure (31-12-2018)
| Numbers of shares | Shareholders | Shares | ||
|---|---|---|---|---|
| Number | % | Number | % | |
| Up to 150 | 179,213 | 19.9 | 12,701,058 | 0.2 |
| 151 to 450 | 179,572 | 19.9 | 49,210,098 | 0.7 |
| 451 to 1,800 | 284,225 | 31.5 | 278,003,301 | 4.2 |
| 1,801 to 4,500 | 136,369 | 15.1 | 388,215,619 | 5.8 |
| 4,501 to 9,000 | 63,647 | 7.1 | 401.194.972 | 6.0 |
| 9,001 to 45,000 | 53,104 | 5.9 | 921,740,895 | 13.8 |
| More than 45,001 | 6,578 | 0.7 | 4,616,820,637 | 69.2 |
| Total | 902,708 | 100.0 | 6,667,886,580 | 100.0 |
BBVA shares are included on the main stock-market indices, including the Ibex 35, Euro Stoxx 50 and Stoxx 50, with a weighting of 7.0%, 1.4% and 0.9% respectively. They also form part of several sector indices, including the Euro Stoxx Banks, with a weighting of 8.3%, and the Stoxx Banks, with a weighting of 3.8%.
Finally, BBVA maintains a significant presence on a number of international sustainability indices or ESG (environmental, social and governance) indices, which evaluate the performance of companies in this area. In September 2018, BBVA joined the Dow Jones Sustainability Index (DJSI), benchmark in the market, which measures the performance of nearly 3,400 listed companies in environmental, social and corporate governance matters. Among the aspects most valued in BBVA's analysis are the fiscal strategy, the information security and cybersecurity policies, the management of environmental risks and opportunities, financial inclusion and, above all, Pledge 2025 announced this year (see responsible banking section).
Main sustainability indices on which BBVA is listed as of 31-12-2018
AAA Rating
Listed on the FTSE4Good Global Index Series
Listed on the Euronext Vigeo Eurozone 120 and Europe 120
Listed on the Ethibel Sustainability Excellence Europe and Eithebel Sustainability Excellence Global indices
In 2018, BBVA obtained a “B” rating
(1) The inclusion of BBVA in any MSCI index, and the use of MSCI logos, trademarks, service marks or index names herein, do not constitute a sponsorship, endorsement or promotion of BBVA by MSCI or any of its affiliates. The MSCI indices are the exclusive property of MSCI. MSCI and the MSCI index names and logos are trademarks or service marks of MSCI or its affiliates.