

3.2.1. Scope and nature of the credit risk measurement and reporting systems
Credit risk arises from the probability that one party to a financial instrument will fail to meet its contractual obligations for reasons of insolvency or inability to pay and cause a financial loss for the other party. This includes management of counterparty risk, issuer credit risk, liquidation risk and country risk.
For managing risks and capital, BBVA quantifies its credit risk using two main metrics: expected loss (EL) and economic capital (EC). The expected loss reflects the average value of losses and is considered a business cost. Economic capital is the amount of capital considered necessary to cover unexpected losses if actual losses are greater than expected losses.
These risk metrics are combined with information on profitability in value-based management, thus building the profitability- risk binomial into decision-making, from the definition of business strategy to approval of individual loans, price setting, assessment of non-performing portfolios, incentives to areas in the Group, etc.
There are three essential parameters in the process of calculating the EL and EC measurements: the probability of default (PD), loss given default (LGD) and exposure at default (EAD). These are generally estimated using historical information available in the systems. They are assigned to operations and customers according to their characteristics.
In this context, the credit rating tools (ratings and scorings) assess the risk in each transaction/customer according to their credit quality by assigning them a score. transaction seasoning, loan to value ratio, customer segment, etc.
Section 3 of this document details the definitions, methods and data used by the Group to determine the capital requirements for estimating and validating the parameters of probability of default (PD), loss given default (LGD) and exposure at default (EAD).
The credit risk for the BBVA Group’s global portfolio is measured through a Portfolio Model that includes the effects of concentration and diversification. The aim is to study the loan book as a whole, and to analyze and capture the effect of the interrelations between the different portfolios.
In addition to enabling a more comprehensive calculation of economic capital needs, this model is a key tool for credit risk management, as it establishes loan limits based on the contribution of each unit to total risk in a global, diversified setting.
The Portfolio Model considers that risk comes from various sources (it is a multi- factor model). This feature implies that economic capital is sensitive to geographic diversification, a crucial aspect in a global entity like BBVA.
These effects have been made more apparent against the current backdrop in which, despite the stress undergone by some economies, the BBVA Group’s presence in different geographical areas, subject to different shocks and different moments in the cycle, have contributed to bolster the bank’s solvency. In addition, the tool is sensitive to concentration in certain credit exposures of the entity’s large clients.
Lastly, the results of the Portfolio Model are integrated into management within the framework of the Asset Allocation project, where business concentrations are analyzed in order to establish the entity’s risk profile.
The analysis of the entity’s RWA structure shows that 88% corresponds to Credit Risk (including the surcharge for CVA).
3.2.2. Definitions and accounting methodologies
3.2.2.1. Definitions of non-performing assets and impaired positions
The classification of financial assets impaired for reasons of customer default is done in an objective way and on an individual basis according to the following criterion:
- The total amount of debt instruments, irrespective of the holder and the guarantee involved, with an amount past due for more than ninety days for principal, interest or contractually agreed expenses, unless they should be classified directly as write-offs.
- Contingent liabilities in which the guaranteed party has incurred default. Debt instruments classified as impaired through the accumulation of balances in default for an amount exceeding 25% of the overall amounts pending collection.
Classification of financial assets impaired for reasons other than customer default is done individually for all risks whose individual amount is significant and for which there is a reasonable doubt about their total reimbursement under the terms and conditions agreed by contract, since they show objective evidence of impairment that negatively affects the cash flows expected from a financial instrument. Objective evidence of impairment of a financial asset or group of financial assets includes observable data about the following aspects:
- Significant financial difficulties on the part of the obligor.
- Continued delays in payment of interest or principal.
- Refinancing for the counterparty’s lending conditions.
- Bankruptcy and other types of reorganization/winding-up is likely.
- Disappearance of a financial asset from an active market due to financial difficulties.
- Observable data that suggest a reduction in future flows since the initial recognition, such as:
a. Adverse changes in the counterparty’s payment status (delays in payments, drawdowns on credit cards up to the limit, etc.).
b. Domestic or local economic conditions correlated with default (unemployment, fall in property prices, etc.).
Write-off risks are those debt instruments whose recovery is deemed remote and should be classified as final write-offs.
3.2.2.2. Methods for determining value adjustments for impairment of assets and provisions
The impairment on financial assets is calculated by type of instrument and other circumstances that may affect it, taking into account the guarantees received by the holders of the instruments to assure (fully or partially) the performance of the transactions. The BBVA Group recognizes impairment charges directly against the impaired asset when the likelihood of recovery is deemed remote, and uses an offsetting or allowance account when it records provisions made to cover estimated losses on their full value.
The amount of the deterioration of debt instruments valued at their amortized cost is calculated by whether the impairment losses are determined individually or collectively.
3.2.2.2.1. Impairment losses determined individually
The amount of impairment losses recorded by these instruments coincides with the positive difference between their respective book values and the present values of future cash flows. These cash flows are discounted at the instrument’s original effective interest rate. If a financial instrument has a variable interest rate, the discount rate for measuring any impairment loss is the current effective rate determined under the contract.
As an exception to the rule described above, the market value of quoted debt instruments is deemed to be a fair estimate of the present value of their future cash flows. The estimation of future cash flows for debt instruments considers the following:
- All sums expected to be recovered during the remaining life of the instrument, including those that may arise from collateral and credit enhancements, if any (once deduction has been made of the costs required for their foreclosure and subsequent sale). Impairment losses include an estimate of the possibility of collecting of the accrued, past-due and uncollected interest.
- The various types of risk to which each instrument is subject.
- The circumstances under which the collections will foreseeably take place.
With respect to impairment losses resulting from the materialization of insolvency risk of the obligors (credit risk), a debt instrument is impaired when:
- There is evidence of a reduction in the obligor’s capacity to pay, whether manifestly by default or for other reasons; and/or.
- Country-risk materializes, understood as the common risk among debtors who are resident in a particular country as a result of factors other than normal commercial risk, such as sovereign risk, transfer risk or risks derived from international financial activity.
The BBVA Group has developed policies, methods and procedures to calculate the losses that it may incur as a result of its credit risks, whether attributable to the insolvency of counterparties or to country risk. These policies, methods and procedures are applied to the arrangement, study and documentation of debt instruments, risks and contingent commitments, as well as the detection of their deterioration and in the calculation of the amounts needed to cover the estimated losses.
3.2.2.2.2. Impairment losses determined collectively
The collectively determined losses are deemed to be equivalent to the portion of losses incurred on the date that the accompanying consolidated financial statements are prepared that has yet to be allocated to specific transactions.
Through statistical procedures using its historical experience and other specific information, the Group calculates the losses that, having occurred on the date of preparation of the accompanying consolidated financial statements, will become clear individually after the date the information is presented.
Quantification of losses incurred takes into account three basic factors: exposure at default, probability of default and loss given default.
- Exposure at default (EAD) is the amount of risk exposure at the date of default by the counterparty.
- Probability of default (PD) is the probability of the counterparty failing to meet its principal and/or interest payment obligations.
- Loss given default (LGD) is the estimate of the loss arising in the event of default. It depends mainly on the characteristics of the counterparty and the valuation of the guarantees or collateral associated with the operation.
To calculate the LGD at each date in the balance sheet, the cash flows from the sale of collateral are estimated by calculating its sale price (in the case of real-estate collateral, the reduction it may have suffered in value is taken into account) and its cost. In the event of default, the property right is acquired contractually at the end of the foreclosure process or when the assets of borrowers in difficulty are purchased, and this right is recognized in the financial statements. After the initial recognition, these assets classified as “Non-current assets held for sale” or “Inventory” (see Notes 2.2.4 and 2.2.6 to the Group’s Annual Consolidated Financial Statements) are valued by the fair value corrected for the estimated cost of their sale or their book value, whichever is lower.
3.2.2.2.3. Methods used for provisioning for contingent exposures and commitments
Non-performing contingent exposures and commitments, except for letters of credit and other guarantees, are to be provisioned for an amount equal to the estimation of the sums expected to be disbursed that are deemed to be non-recoverable, applying criteria of valuation prudence. When calculating the provisions, criteria similar to those established for non-performing assets for reasons other than customer default are applied.
In any event, letters of credit and other guarantees provided which are classified as non-performing will be covered by applying similar criteria to those set out in the preceding section on value adjustments for impairment of assets.
Likewise, the inherent loss associated with letters of credit and other guarantees provided that are in force and not impaired is covered by applying similar criteria to those set out in the preceding section on impairment losses determined collectively.
3.2.2.3. Criteria for removing or maintaining assets subject to securitization on the balance sheet
The accounting procedure for the transfer of financial assets depends on the manner in which the risks and benefits associated with securitized assets are transferred to third parties.
Financial assets are only removed from the consolidated balance sheet when the cash flows they generate have dried up or when their implicit risks and benefits have been substantially transferred out to third parties.
Group is considered to substantially transfer the risks and benefits when these account for the majority of the overall risks and benefits of the securitized assets.
When the risks and benefits of transferred assets are substantially conveyed to third parties, the financial asset transferred is removed from the consolidated balance sheet, and any right or obligation retained or created as a result of the transfer is simultaneously recognized.
In many situations, it is clear whether the entity has substantially transferred all the risks and benefits associated with the transfer of an asset or not. However, when it is not sufficiently clear if the transfer took place or not, the entity evaluates its exposure before and after the transfer by comparing the variation in the amounts and the calendar of the net cash flows of the transferred asset. Therefore, if the exposure to the variation in the current value of the net cash flows of the financial asset does not significantly change as a result of the transfer, it is understood that the entity has not substantially transferred all the risks and benefits associated with the ownership of the asset.
When the risks and/or benefits associated with the financial asset transferred are substantially retained, the asset transferred is not removed from the consolidated balance sheet and continues to be valued according to the same criteria applied prior to the transfer.
In the specific case of securitization funds to which Group institutions transfer their loan- books, existing contractual rights other than voting rights are to be considered with a view to analyzing their possible consolidation. It is also necessary to consider the design and purpose of each fund, as well as the following factors, among others:
- Evidence of the practical ability to direct the relevant activities of the funds according to the specific needs of the business (including the decisions that may arise in particular circumstances only).
- Possible existence of special relationships with the funds.
- The Group’s implicit or explicit commitments to back the funds.
Whether the Group has the capacity to use its power over the funds to influence the amount of the returns to which it is exposed.
Thus, there are cases where the Group is highly exposed to the existing variable returns and retains decision-making powers over the institution, either directly or through an agent. In these cases, the securitization funds are consolidated with the Group.
3.2.2.4. Criteria for the recognition of earnings in the event of the removal of assets from the balance sheet
In order for the Group to recognize the result generated on the sale of financial instruments, the sale has to involve the corresponding removal from the accounts, which requires the fulfillment of the requirements governing the substantial transfer of risks and benefits as described in the preceding point.
The result will be reflected on the income statement, being calculated as the difference between the book value and the net value received including any new additional assets obtained minus any liabilities assumed.
When the amount of the financial asset transferred matches the total amount of the original financial asset, the new financial assets, financial liabilities and liabilities for the provision of services, as appropriate, that are generated as a result of the transfer will be recorded according to their fair value.
3.2.2.5. Key hypothesis for valuing risks and benefits retained on securitized assets
The Group considers that a substantial withholding is made of the risks and benefits of securitizations when the subordinated bonds of issues are kept and/or it grants subordinated finance to the securitization funds that mean substantially retaining the credit losses expected from the loans transferred.
The Group currently has traditional securitizations only, and no synthetic securitizations.
3.2.3. Information on credit risks
3.2.3.1. Exposure to credit risk
Pursuant to Article 5 of the Solvency Regulations, with respect to the capital requirements for credit risk, exposure is understood to be any asset item and all items included in the Group’s memorandum accounts involving credit risk and not deducted from the Group’s eligible capital. Accordingly, inclusion is made mainly of customer lending items, with their corresponding undrawn balances, letters of credit and guarantees, debt securities and capital instruments, cash and deposits in central banks and credit institutions, assets purchased or sold under a repurchase agreement (asset and liability repos), financial derivatives (nominal) and fixed assets.
Below is a presentation of the balance of the original exposure and the allowances under the advanced measurement and standardized approaches as of December 31, 2015 and 2014. In accordance with Article 444 e) of the Solvency Regulations, only the exposure net of allowances is presented for those exposures calculated under the standardized approach.
Table 8. Exposure to credit risk
2015
(Million euros)
|
|
|
|
|
Exposure after applying conversion factors | |||||
|---|---|---|---|---|---|---|---|---|---|
| Category of exposure | Original exposure (1) | Provisions | Exposure Net of provisions (2) | On-balance-sheet exposure after mitigation techniques (3a) | Off-balance-sheet exposure after mitigation techniques (3b) | Fully Adjusted Value of the exposure (4) | EAD (5)(6) | RWA (7) | RWA Density |
| Central governments or central banks | 139,910 | (17) | 139,894 | 137,534 | 3,530 | 141,063 | 138,669 | 35,174 | 25% |
| Regional governments or local authorities | 7,050 | (7) | 7,043 | 6,589 | 387 | 6,977 | 6,807 | 2,996 | 44% |
| Public sector entities | 5,211 | (15) | 5,195 | 2,474 | 613 | 3,087 | 2,616 | 1,349 | 52% |
| Multilateral Development banks | 39 | () | 39 | 38 | 0 | 39 | 38 | 25 | 67% |
| International organizations | 9 | () | 9 | 9 | 0 | 9 | 9 | - | 0% |
| Institutions | 33,594 | (26) | 33,568 | 18,453 | 11,072 | 29,525 | 19,555 | 5,730 | 29% |
| Corporates | 155,351 | (2,198) | 153,153 | 85,531 | 57,689 | 143,219 | 105,263 | 101,195 | 96% |
| Retail | 76,212 | (537) | 75,674 | 49,848 | 23,848 | 73,696 | 52,632 | 36,929 | 70% |
| Secured by mortgages on immovable property | 54,979 | (239) | 54,740 | 53,051 | 221 | 53,272 | 53,158 | 20,497 | 39% |
| Exposures in default | 9,745 | (4,960) | 4,785 | 4,186 | 263 | 4,449 | 4,371 | 4,706 | 108% |
| Items associated with particularly high risk | 258 | (7) | 251 | 151 | 51 | 202 | 154 | 143 | 93% |
| Covered bonds | 846 | - | 846 | 839 | - | 839 | 839 | 393 | 47% |
| Short-term claims on institutions and corporate | 2,364 | - | 2,364 | 2,364 | - | 2,364 | 2,364 | 727 | 31% |
| Collective investments undertakings (CIU) | 605 | () | 605 | 108 | 353 | 461 | 293 | 67 | 23% |
| Other exposures | 27,690 | (86) | 27,605 | 31,994 | 4,029 | 36,023 | 34,081 | 18,806 | 55% |
| Securitized positions | 3,370 | (12) | 3,358 | 3,358 | - | 3,358 | 3,358 | 1,049 | 31% |
| TOTAL STANDARDIZED APPROACH | 517,235 | (8,104) | 509,131 | 396,528 | 102,056 | 498,584 | 424,207 | 229,787 | 57% |
| Central governments or central banks | 4,475 | (19) | - | 5,333 | 785 | 6,118 | 5,730 | 224 | 4% |
| Institutions | 90,651 | (106) | - | 84,612 | 5,646 | 90,259 | 87,798 | 10,826 | 12% |
| Corporates | 140,200 | (5,976) | - | 82,591 | 56,021 | 138,613 | 111,061 | 63,607 | 57% |
| Retail | 125,898 | (2,510) | - | 104,862 | 21,005 | 125,867 | 108,669 | 23,180 | 21% |
| Of which: Secured by real estate collateral | 97,099 | (1,533) | - | 90,326 | 6,746 | 97,072 | 90,441 | 12,411 | 14% |
| Of which: Qualifying revolving retail | 19,507 | (462) | - | 6,324 | 13,184 | 19,507 | 9,433 | 7,420 | 79% |
| Of which: Other retail assets | 9,291 | (515) | - | 8,212 | 1,075 | 9,287 | 8,795 | 3,349 | 38% |
| Securitized positions | 982 | (3) | - | 982 | - | 982 | 982 | 345 | 35% |
| TOTAL ADVANCED MEASUREMENT APPROACH | 362,206 | (8,614) | - | 278,381 | 83,457 | 361,838 | 314,241 | 98,182 | 31% |
| TOTAL CREDIT RISK DILUTION AND DELIVERY | 879,441 | (16,719) | 509,131 | 674,908 | 185,514 | 860,422 | 738,447 | 327,969 | 44% |
| Equity | 9,418 | (163) | - | 9,028 | - | 9,028 | 9,418 | 19,522 | 207% |
| Simple Method | 4,853 | 293 | - | 4,853 | - | 4,853 | 4,853 | 11,993 | 247% |
| Non-trading equity instruments in sufficiently diversified portfolios | 4,554 | 310 | - | 4,554 | - | 4,554 | 4,554 | 11,065 | 243% |
| Exchange-traded equity instruments | 299 | (17) | - | 299 | - | 299 | 299 | 928 | 311% |
| PD/LGD Method | 4,175 | (426) | - | 4,175 | - | 4,175 | 4,175 | 6,230 | 149% |
| Internal Models | 390 | (29) | - | - | - | - | 390 | 1,299 | 333% |
| TOTAL CREDIT RISK | 888,859 | (16,881) | 509,131 | 683,936 | 185,514 | 869,450 | 747,865 | 347,491 | 46% |
2014
(Million euros)
|
|
|
|
|
Exposure after applying conversion factors | |||||
|---|---|---|---|---|---|---|---|---|---|
| Category of exposure | Original exposure (1) | Provisions | Exposure Net of provisions (2) | On-balance-sheet exposure after mitigation techniques (3a) | Off-balance-sheet exposure after mitigation techniques (3b) | Fully Adjusted Value of the exposure (4) | EAD (5)(6) | RWA (7) | RWA Density |
| Central governments or central banks | 103,926 | (18) | 103,909 | 106,406 | 2,498 | 108,904 | 107,683 | 29,850 | 28% |
| Regional governments or local authorities | 7,482 | (15) | 7,467 | 7,236 | 151 | 7,387 | 7,320 | 3,300 | 45% |
| Public sector entities | 5,524 | (29) | 5,496 | 2,181 | 918 | 3,099 | 2,532 | 1,338 | 53% |
| Multilateral Development banks | 93 | – | 93 | 92 | 0 | 93 | 92 | 25 | 27% |
| International organizations | 16 | – | 16 | 16 | 0 | 16 | 16 | – | 0% |
| Institutions | 20,366 | (22) | 20,344 | 10,337 | 10,040 | 20,377 | 11,461 | 2,638 | 23% |
| Corporates | 107,908 | (163) | 107,744 | 59,464 | 42,678 | 102,143 | 71,340 | 66,397 | 93% |
| Retail | 59,973 | (467) | 59,506 | 40,604 | 16,581 | 57,185 | 43,338 | 30,725 | 71% |
| Secured by mortgages on immovable property | 54,500 | (353) | 54,147 | 51,750 | 732 | 52,482 | 52,109 | 19,763 | 38% |
| Exposures in default | 9,311 | (3,440) | 5,870 | 5,181 | 63 | 5,244 | 5,224 | 5,450 | 104% |
| Items associated with particularly high risk | 380 | (31) | 349 | 174 | 35 | 208 | 176 | 150 | 85% |
| Covered bonds | 605 | – | 605 | 605 | – | 605 | 605 | 125 | 21% |
| Short-term claims on institutions and corporate | 2,063 | – | 2,063 | 1,834 | – | 1,834 | 1,834 | 425 | 23% |
| Collective investments undertakings (CIU) | 124 | – | 124 | 46 | 4 | 51 | 50 | 13 | 26% |
| Other exposures | 27,105 | (84) | 27,020 | 30,801 | 667 | 31,468 | 31,329 | 17,225 | 55% |
| Securitized positions | 2,723 | (18) | 2,705 | 2,705 | – | 2,705 | 2,705 | 1,063 | 39% |
| TOTAL STANDARDIZED APPROACH | 402,098 | (4,639) | 397,459 | 319,432 | 74,369 | 393,801 | 337,815 | 178,487 | 53% |
| Central governments or central banks | 3,001 | (4) |
|
4,153 | 749 | 4,902 | 4,529 | 376 | 8% |
| Institutions | 112,235 | (78) |
|
105,642 | 6,338 | 111,981 | 109,494 | 12,425 | 11% |
| Corporates | 130,154 | (6,711) |
|
75,120 | 53,389 | 128,508 | 102,682 | 60,998 | 59% |
| Retail | 96,276 | (1,620) |
|
83,698 | 12,577 | 96,276 | 86,866 | 21,059 | 24% |
| Of which: Secured by real estate collateral | 70,113 | (721) |
|
69,880 | 233 | 70,113 | 69,892 | 10,420 | 15% |
| Of which: Qualifying revolving retail | 17,943 | (516) |
|
6,377 | 11,566 | 17,943 | 9,134 | 7,203 | 79% |
| Of which: Other retail assets | 8,219 | (384) |
|
7,441 | 778 | 8,219 | 7,839 | 3,436 | 44% |
| Securitized positions | 1,042 | (21) | – | 1,042 | – | 1,042 | 1,042 | 712 | 68% |
| TOTAL ADVANCED MEASUREMENT APPROACH | 342,708 | (8,434) | – | 269,655 | 73,054 | 342,708 | 304,612 | 95,570 | 31% |
| TOTAL CREDIT RISK DILUTION AND DELIVERY | 744,807 | (13,073) | 397,459 | 589,087 | 147,423 | 736,510 | 642,427 | 274,057 | 43% |
| Equity | 10,696 | (61) | – | 10,442 | – | 10,442 | 10,696 | 21,866 | 204% |
| Simple Method | 3,980 | (40) | – | 3,980 | – | 3,980 | 3,980 | 9,840 | 247% |
| Non-trading equity instruments in sufficiently diversified portfolios | 3,712 | (34) | – | 3,712 | – | 3,712 | 3,712 | 9,002 | 243% |
| Exchange-traded equity instruments | 268 | (6) | – | 268 | – | 268 | 268 | 838 | 312% |
| PD/LGD Method | 6,462 | – | – | 6,462 | – | 6,462 | 6,462 | 10,417 | 161% |
| Internal Models | 254 | (21) | – | – | – | – | 254 | 1,609 | 634% |
| TOTAL CREDIT RISK | 755,503 | (13,134) | 397,459 | 599,529 | 147,423 | 746,952 | 653,124 | 295,925 | 45% |
3.2.3.2. Average value of the exposures throughout 2015 and 2014
The table below shows the average value of exposure to credit risk in 2015 and 2014 for both the advanced measurement and standardized approaches for each one of the exposure categories:
Table 9. Average value of the exposures throughout 2014 and 2015
(Million euros)
| Category of exposure | Original average exposure for the period | |
|---|---|---|
|
|
2015 | 2014 |
| Central governments or central banks | 122,926 | 96,222 |
| Regional governments or local authorities | 7,446 | 6,575 |
| Public sector entities | 5,531 | 6,059 |
| Multilateral Development banks | 66 | 91 |
| International organizations | 1,584 | 10 |
| Institutions | 35,855 | 20,217 |
| Corporates | 132,916 | 100,720 |
| Retail | 65,913 | 58,305 |
| Secured by mortgages on immovable property | 53,696 | 54,005 |
| Exposures in default | 9,327 | 10,776 |
| Items associated with particularly high risk | 270 | 454 |
| Covered bonds | 2,492 | 4,481 |
| Short-term claims on institutions and corporate | 2,237 | 2,040 |
| Collective investments undertakings (CIU) | 388 | 169 |
| Other exposures | 26,582 | 25,388 |
| TOTAL STANDARDIZED APPROACH | 467,229 | 385,512 |
| Central governments or central banks | 3,769 | 2,495 |
| Institutions | 94,492 | 96,324 |
| Corporates | 138,628 | 123,953 |
| Retail | 119,200 | 101,774 |
| Of which: Secured by real estate collateral | 91,049 | 70,895 |
| Of which: Qualifying revolving retail | 19,207 | 17,827 |
| Of which: Other retail assets | 8,945 | 6,526 |
| TOTAL ADVANCED MEASUREMENT APPROACH | 356,089 | 324,546 |
| TOTAL CREDIT RISK DILUTION AND DELIVERY (5) | 823,318 | 710,058 |
| Securitized positions | 4,222 | 3,573 |
| Of which: Standardized Approach | 3,236 | 2,539 |
| Of which: Advanced Measurement Approach | 985 | 1,034 |
| Equity | 9,835 | 10,414 |
| Of which: Simple Method | 4,365 | 4,053 |
| Equity instruments in sufficiently diversified portfolios | 1,283 | 696 |
| Exchange Traded equity instruments | 3,160 | 3,357 |
| Of which: PD/LGD Method | 5,002 | 5,901 |
| Of which: Internal Models | 468 | 460 |
| TOTAL CREDIT RISK | 837,375 | 724,045 |
3.2.3.3. Distribution by geographical area
The following chart shows the distribution by geographical area of the original exposure based on the obligor’s country. The breakdown includes exposure under the standardized and advanced measurement approaches, without including positions in securitizations or equity.
Table 10. Distribution by geographical area of exposure to credit risk
2015
(Million euros)
| Category of exposure | Total | Spain | Turkey | Eurasia | Mexico | The United States |
South America | Rest of the world |
|---|---|---|---|---|---|---|---|---|
| Central governments or central banks | 139,910 | 69,189 | 19,837 | 10,379 | 16,441 | 10,821 | 13,243 | 0 |
| Regional governments or local authorities | 7,050 | 1,755 | 11 | 237 | - | 4,945 | 102 | 0 |
| Public sector entities | 5,211 | 395 | 2 | 201 | 2,911 | 310 | 1,391 | - |
| Multilateral Development banks | 39 | 0 | - | - | - | - | 38 | - |
| International organizations | 9 | 0 | - | 9 | - | - | - | - |
| Institutions | 33,594 | 12,586 | 2,847 | 9,773 | 3,112 | 2,495 | 2,753 | 27 |
| Corporates | 155,351 | 6,149 | 40,627 | 10,350 | 18,955 | 55,622 | 23,339 | 308 |
| Retail | 76,212 | 11,878 | 27,892 | 2,086 | 6,920 | 8,428 | 18,948 | 59 |
| Secured by mortgages on immovable property | 54,979 | 5,528 | 8,493 | 3,127 | 9,845 | 15,747 | 12,187 | 52 |
| Exposures in default | 9,745 | 4,816 | 1,588 | 1,041 | 434 | 643 | 1,193 | 30 |
| Items associated with particularly high risk | 258 | 254 | - | 4 | - | - | - | - |
| Covered bonds | 846 | 0 | - | - | 846 | - | - | - |
| Short-term claims on institutions and corporate | 2,364 | 174 | - | 20 | 288 | 1,684 | 197 | - |
| Collective investments undertakings (CIU) | 605 | 197 | - | 217 | 0 | 187 | 4 | - |
| Other exposures | 27,690 | 13,243 | 2,162 | 1,102 | 6,242 | 1,381 | 3,411 | 149 |
| Securitized positions | 3,370 | 686 | - | - | 413 | 2,271 | - | - |
| TOTAL CREDIT RISK BY THE STANDARDIZED APPROACH | 517,235 | 126,849 | 103,461 | 38,547 | 66,408 | 104,535 | 76,807 | 627 |
| Central governments or central banks | 4,475 | 57 | 1 | 263 | 132 | 3,008 | 480 | 533 |
| Institutions | 90,651 | 43,646 | 5 | 42,969 | 577 | 1,910 | 296 | 1,249 |
| Corporates | 140,200 | 65,425 | 568 | 38,098 | 17,561 | 12,766 | 3,086 | 2,694 |
| Retail | 125,898 | 110,287 | 0 | 445 | 15,061 | 33 | 49 | 23 |
| Securitized positions | 982 | 982 | - | - | - | - | - | - |
| TOTAL CREDIT RISK BY THE ADVANCED MEASUREMENT APPROACH | 362,206 | 220,397 | 574 | 81,776 | 33,331 | 17,717 | 3,911 | 4,500 |
| TOTAL CREDIT RISK DILUTION AND DELIVERY | 879,441 | 347,247 | 104,035 | 120,323 | 99,739 | 122,252 | 80,718 | 5,126 |
2014
(Million euros)
| Category of exposure | Total | Spain | Turkey | Eurasia | Mexico | The United States |
South America | Rest of the world |
|---|---|---|---|---|---|---|---|---|
| Central governments or central banks | 103,926 | 52,352 | 5,633 | 8,749 | 12,913 | 5,663 | 18,617 | – |
| Regional governments or local authorities | 7,482 | 1,597 | 13 | 310 | 1,014 | 4,461 | 86 | – |
| Public sector entities | 5,524 | 86 | – | 344 | 3,148 | 236 | 1,710 | – |
| Multilateral Development banks | 93 | – | – | 38 | – | 12 | 42 | – |
| International organizations | 16 | – | – | 16 | – | – | – | – |
| Institutions | 20,366 | 8,206 | 724 | 5,256 | 1,542 | 1,883 | 2,685 | 70 |
| Corporates | 107,908 | 4,686 | 9,172 | 5,144 | 16,159 | 49,601 | 22,853 | 292 |
| Retail | 59,973 | 11,217 | 5,273 | 3,408 | 5,915 | 7,302 | 26,826 | 32 |
| Secured by mortgages on immovable property | 54,500 | 12,952 | 1,857 | 2,937 | 9,799 | 14,024 | 12,926 | 5 |
| Exposures in default | 9,311 | 5,341 | 350 | 913 | 947 | 528 | 1,224 | 8 |
| Items associated with particularly high risk | 380 | 380 | – | – | – | – | – | – |
| Covered bonds | 605 | – | – | – | 605 | – | – | – |
| Short-term claims on institutions and corporate | 2,063 | 211 | – | – | 0 | 1,238 | 614 | – |
| Collective investments undertakings (CIU) | 124 | 106 | – | 7 | 0 | 7 | 5 | – |
| Other exposures | 27,105 | 12,397 | 425 | 1,729 | 6,559 | 1,491 | 4,494 | 9 |
| Securitized positions | 2,723 | 867 | – | – | 188 | 1,666 | – | 1 |
| TOTAL CREDIT RISK BY THE STANDARDIZED APPROACH | 402,098 | 110,399 | 23,447 | 28,850 | 58,790 | 88,112 | 92,082 | 418 |
| Central governments or central banks | 3,001 | 149 | 3 | 296 | 113 | 1,619 | 464 | 358 |
| Institutions | 112,235 | 53,478 | 18 | 54,021 | 540 | 3,276 | 172 | 730 |
| Corporates | 130,154 | 66,208 | 347 | 36,104 | 15,408 | 7,558 | 2,546 | 1,983 |
| Retail | 96,276 | 82,134 | – | 17 | 14,111 | 2 | 8 | 4 |
| Securitized positions | 1,042 | 1,006 | – | – | – | 34 | – | 2 |
| TOTAL CREDIT RISK BY THE ADVANCED MEASUREMENT APPROACH | 342,709 | 202,974 | 368 | 90,438 | 30,172 | 12,489 | 3,191 | 3,077 |
| TOTAL CREDIT RISK DILUTION AND DELIVERY | 744,807 | 313,373 | 23,815 | 119,288 | 88,962 | 100,601 | 95,273 | 3,494 |
Chart 4. Distribution by geographical area of exposure to credit risk

As can be seen from the above table, the original exposure in Europe under advanced credit risk models accounts for over 50% of the total, while in the remaining countries the percentage is around 50%.
It also shows graphically the distribution of original exposure by geographical area, revealing the Group’s high level of geographical diversification, which constitutes one of the key levers for its strategic growth.
The next table shows the distribution by geographical area of the book balances of the allowances for financial and non- financial asset losses and for contingent liabilities.
Table 11. Distribution by geographical area of the book balances of the non-performing and impaired exposures of financial assets and contingent liabilities
2015
(Million euros)
|
|
Total | Spain | Turkey | Eurasia | Mexico | The United States |
South America |
Rest of the world |
|---|---|---|---|---|---|---|---|---|
| Non-performing and impaired exposures | 24,860 | 20,311 | 1,219 | 986 | 539 | 537 | 1,140 | 128 |
2014
(Million euros)
|
|
Total | Spain | Turkey | Eurasia | Mexico | The United States |
South America |
Rest of the world |
|---|---|---|---|---|---|---|---|---|
| Non-performing and impaired exposures | 24,970 | 19,937 | 350 | 1,308 | 1,271 | 576 | 1,501 | 26 |
The next table shows the distribution by geographical area of the book balances of the allowances for financial asset losses and for contingent liabilities.
Table 12. Distribution by geographical area of the book balances of the value adjustments for impairment of financial assets and contingent liabilities
2015
(Million euros)
|
|
Total | Spain | Turkey | Eurasia | Mexico | The United States |
South America |
Rest of the world |
|---|---|---|---|---|---|---|---|---|
| Value adjustments and provisions | 19,515 | 14,110 | 1,751 | 886 | 1,361 | 319 | 1,059 | 29 |
2014
(Million euros)
|
|
Total | Spain | Turkey | Eurasia | Mexico | The United States |
South America |
Rest of the world |
|---|---|---|---|---|---|---|---|---|
| Value adjustments and provisions | 15,254 | 11,357 | 312 | 754 | 1,486 | 242 | 1,093 | 10 |
3.2.3.4. Distribution by sector
Below is the distribution by economic sector (standardized and advanced measurement approaches) of the original exposure, excluding equity positions.
Table 13. Distribution by sector of exposure to credit risk
2015
(Million euros)
|
|
Distribution by sector of exposure to credit risk | ||||||||
|---|---|---|---|---|---|---|---|---|---|
| Category of exposure | Total | Credit institutions, insurance and brokerage |
Public sector |
Agriculture | Industry | Construction | Commercial | Individuals | Other sectors |
| Central governments or central banks | 139,910 | 0.54% | 96.69% | 0.02% | 0.49% | 0.13% | 0.42% | 0.94% | 0.78% |
| Regional governments or local authorities | 7,050 | 7.84% | 51.87% | 0.23% | 7.16% | 1.84% | 6.13% | 13.67% | 11.26% |
| Public sector entities | 5,211 | 1.99% | 87.77% | 0.06% | 1.82% | 0.47% | 1.56% | 3.47% | 2.86% |
| Multilateral Development Banks | 39 | 59.56% | 8.80% | 0.18% | 5.62% | 1.45% | 4.82% | 10.73% | 8.85% |
| International organizations | 9 | 0.00% | 100.00% | 0.00% | 0.00% | 0.00% | 0.00% | 0.00% | 0.00% |
| Institutions | 33,594 | 92.22% | 1.69% | 0.03% | 1.08% | 0.28% | 0.93% | 2.07% | 1.70% |
| Corporates | 155,351 | 1.73% | 1.64% | 0.58% | 22.53% | 6.06% | 32.99% | 1.96% | 32.49% |
| Retail | 76,212 | 0.84% | 0.98% | 0.81% | 9.81% | 2.55% | 5.07% | 52.05% | 27.89% |
| Secured by mortgages on immovable property | 54,979 | 1.23% | 1.49% | 0.54% | 3.96% | 2.48% | 12.58% | 46.99% | 30.73% |
| Exposures in default | 9,745 | 3.45% | 4.25% | 0.40% | 10.93% | 12.54% | 14.49% | 26.64% | 27.30% |
| Items associated with particularly high risk | 258 | 1.94% | 0.01% | 0.98% | 10.61% | 9.18% | 10.17% | 24.40% | 42.71% |
| Covered bonds | 846 | 100.00% | 0.00% | 0.00% | 0.00% | 0.00% | 0.00% | 0.00% | 0.00% |
| Short-term claims on institutions and corporate | 2,364 | 14.38% | 3.12% | 0.06% | 2.00% | 0.51% | 72.96% | 3.81% | 3.14% |
| Collective investments undertakings (CIU) | 605 | 99.01% | 0.13% | 0.00% | 0.09% | 0.02% | 0.07% | 0.16% | 0.51% |
| Other exposures | 27,690 | 4.02% | 4.98% | 0.11% | 3.08% | 0.84% | 3.11% | 6.89% | 76.97% |
| Securitized positions | 3,370 | 60.59% | 38.58% | 0.00% | 0.00% | 0.00% | 0.83% | 0.00% | 0.00% |
| TOTAL CREDIT RISK BY THE STANDARDIZED APPROACH | 517,235 | 7.92% | 30.14% | 0.37% | 9.21% | 2.80% | 12.94% | 14.52% | 22.10% |
| Central governments or central banks | 4,475 | 0.00% | 100.00% | 0.00% | 0.00% | 0.00% | 0.00% | 0.00% | 0.00% |
| Institutions | 90,651 | 70.84% | 6.25% | 0.13% | 3.99% | 1.03% | 3.42% | 7.62% | 6.28% |
| Corporates | 140,200 | 5.18% | 0.13% | 0.81% | 38.28% | 7.85% | 13.57% | 0.70% | 32.57% |
| Retail | 125,898 | 0.02% | 0.00% | 0.19% | 1.05% | 0.73% | 1.59% | 95.23% | 1.20% |
| Securitized positions | 982 | 100.00% | 0.00% | 0.00% | 0.00% | 0.00% | 0.00% | 0.00% | 0.00% |
| TOTAL CREDIT RISK BY THE ADVANCED MEASUREMENT APPROACH | 362,206 | 20.72% | 2.69% | 0.41% | 16.08% | 3.52% | 6.57% | 35.08% | 14.43% |
| TOTAL CREDIT RISK | 879,441 | 13.19% | 18.83% | 0.39% | 12.04% | 3.09% | 10.32% | 22.99% | 18.94% |
2014
(Million euros)
|
|
Distribution by sector of exposure to credit risk | ||||||||
|---|---|---|---|---|---|---|---|---|---|
| Category of exposure | Total | Credit institutions, insurance and brokerage |
Public sector |
Agriculture | Industry | Construction | Commercial | Individuals | Other sectors |
| Central governments or central banks | 103,926 | 0.44% | 97.41% | 0.02% | 0.34% | 0.11% | 0.36% | 0.81% | 0.52% |
| Regional governments or local authorities | 7,482 | 7.09% | 58.11% | 0.38% | 5.43% | 1.71% | 5.83% | 13.06% | 8.38% |
| Public sector entities | 5,524 | 1.21% | 92.88% | 0.07% | 0.92% | 0.29% | 0.99% | 2.22% | 1.42% |
| Multilateral Development Banks | 93 | 31.25% | 14.53% | 0.60% | 8.46% | 2.67% | 9.09% | 20.34% | 13.06% |
| International organizations | 16 | 0.00% | 100.00% | 0.00% | 0.00% | 0.00% | 0.00% | 0.00% | 0.00% |
| Institutions | 20,366 | 36.56% | 13.41% | 0.55% | 7.81% | 2.46% | 8.39% | 18.77% | 12.04% |
| Corporates | 107,908 | 2.49% | 3.57% | 2.68% | 16.28% | 6.96% | 44.69% | 4.58% | 18.75% |
| Retail | 59,973 | 2.24% | 1.60% | 1.25% | 5.84% | 3.00% | 9.14% | 60.93% | 16.01% |
| Secured by mortgages on immovable property | 54,500 | 1.42% | 1.74% | 0.50% | 2.46% | 1.32% | 4.38% | 61.16% | 27.01% |
| Exposures in default | 9,311 | 1.95% | 2.52% | 1.51% | 5.89% | 9.74% | 10.46% | 32.64% | 35.31% |
| Items associated with particularly high risk | 380 | 0.74% | 0.02% | 0.84% | 9.96% | 6.73% | 7.67% | 34.57% | 39.48% |
| Covered bonds | 605 | 100.00% | 0.00% | 0.00% | 0.00% | 0.00% | 0.00% | 0.00% | 0.00% |
| Short-term claims on institutions and corporate | 2,063 | 2.57% | 3.09% | 0.84% | 1.88% | 0.93% | 66.25% | 4.33% | 20.10% |
| Collective investments undertakings (CIU) | 124 | 96.68% | 0.70% | 0.03% | 0.41% | 0.13% | 0.44% | 0.98% | 0.63% |
| Other exposures | 27,105 | 5.79% | 5.43% | 0.24% | 3.30% | 1.00% | 3.71% | 7.67% | 72.86% |
| Securitized positions | 2,723 | 7.74% | 76.83% | 0.00% | 0.00% | 0.00% | 15.43% | 0.00% | 0.00% |
| TOTAL CREDIT RISK BY THE STANDARDIZED APPROACH | 402,098 | 4.00% | 30.61% | 1.07% | 6.55% | 2.99% | 15.54% | 21.37% | 17.87% |
| Central governments or central banks | 3,001 | 0.00% | 100.00% | 0.00% | 0.00% | 0.00% | 0.00% | 0.00% | 0.00% |
| Institutions | 112,235 | 76.92% | 4.88% | 0.20% | 2.84% | 0.90% | 3.05% | 6.83% | 4.38% |
| Corporates | 130,154 | 4.99% | 0.32% | 0.68% | 37.13% | 8.84% | 13.48% | 1.01% | 33.55% |
| Retail | 96,276 | 0.01% | 0.00% | 0.11% | 0.65% | 0.25% | 0.91% | 97.42% | 0.64% |
| Securitized positions | 1,042 | 100.00% | 0.00% | 0.00% | 0.00% | 0.00% | 0.00% | 0.00% | 0.00% |
| TOTAL CREDIT RISK BY THE ADVANCED MEASUREMENT APPROACH | 342,708 | 27.39% | 2.60% | 0.36% | 15.21% | 3.72% | 6.37% | 29.99% | 14.35% |
| TOTAL CREDIT RISK | 744,807 | 14.76% | 17.72% | 0.74% | 10.54% | 3.33% | 11.32% | 25.34% | 16.25% |
The following table shows the distribution by counterparty of the book balances of the nonperforming and impaired exposures of financial assets and contingent liabilities.
Table 14. Distribution by sector of the book balances of the non-performing and impaired exposures of financial assets and contingent liabilities
2015
(Million euros)
|
|
Total | Credit institutions, insurance and brokerage |
Public sector |
Corporates | Retail | Other sectors |
|---|---|---|---|---|---|---|
| Non-performing and impaired exposures | 24,860 | 0.81% | 2.43% | 52.35% | 33.40% | 11.01% |
2014
|
|
Total | Credit institutions, insurance and brokerage |
Public sector |
Corporates | Retail | Other sectors |
|---|---|---|---|---|---|---|
| Non-performing and impaired exposures | 24,970 | 1.01% | 1.39% | 60.44% | 30.81% | 6.35% |
The next table shows the distribution by counterparty of the book balances of allowances for financial asset losses and for contingent exposures.
Table 15. Distribution by sector of the book balances of the value adjustments for impairment of financial assets and contingent liabilities
2015
(Million euros)
|
|
Total | Credit institutions, insurance and brokerage |
Public sector |
Corporates | Retail | Other sectors |
|---|---|---|---|---|---|---|
| Value adjustments and provisions | 19,515 | 1.51% | 0.86% | 46.67% | 33.33% | 12.13% |
2014
|
|
Total | Credit institutions, insurance and brokerage |
Public sector |
Corporates | Retail | Other sectors |
|---|---|---|---|---|---|---|
| Value adjustments and provisions | 15,254 | 2.13% | 1.02% | 58.94% | 27.72% | 10.18% |
3.2.3.5. Distribution by residual maturity
The following table shows the distribution of original exposure by residual maturity, broken down by category of exposure under the standardized and advanced measurement approaches, excluding positions in equity.
Table 16. Distribution by residual maturity of exposure to credit risk
2015
(Million euros)
|
|
Original exposure by residual maturity | |||
|---|---|---|---|---|
| Category of exposure | Total | Less than 1 year | Between 1 and 5 years | Over 5 years |
| Central governments or central banks | 139,910 | 74,340 | 33,644 | 31,926 |
| Regional governments or local authorities | 7,050 | 2,957 | 1,575 | 2,518 |
| Public sector entities | 5,211 | 1,227 | 537 | 3,446 |
| Multilateral Development Banks | 39 | 21 | 12 | 6 |
| International organizations | 9 | - | 9 | 0 |
| Institutions | 33,594 | 18,954 | 8,224 | 6,417 |
| Corporates | 155,351 | 51,930 | 60,521 | 42,900 |
| Retail | 76,212 | 35,968 | 24,386 | 15,858 |
| Secured by mortgages on immovable property | 54,979 | 7,300 | 8,731 | 38,948 |
| Exposures in default | 9,745 | 3,987 | 2,841 | 2,917 |
| Items associated with particularly high risk | 258 | 49 | 48 | 161 |
| Covered bonds | 846 | - | 846 | - |
| Short-term claims on institutions and corporate | 2,364 | 1,844 | 114 | 405 |
| Collective investments undertakings (CIU) | 605 | 345 | 228 | 33 |
| Other exposures | 27,690 | 11,330 | 8,071 | 8,289 |
| Securitized positions | 3,370 | 336 | 514 | 2,520 |
| TOTAL CREDIT RISK BY THE STANDARDIZED APPROACH | 517,235 | 210,590 | 150,301 | 156,344 |
| Central governments or central banks | 4,475 | 387 | 451 | 3,637 |
| Institutions | 90,651 | 51,221 | 17,809 | 21,621 |
| Corporates | 140,200 | 49,175 | 52,876 | 38,149 |
| Retail | 125,898 | 11,279 | 18,632 | 95,987 |
| Securitized positions | 982 | 57 | 40 | 885 |
| TOTAL CREDIT RISK BY THE ADVANCED MEASUREMENT APPROACH | 362,206 | 112,120 | 89,808 | 160,278 |
| TOTAL CREDIT RISK DILUTION AND DELIVERY | 879,441 | 322,709 | 240,109 | 316,622 |
2014
(Million euros)
|
|
Original exposure by residual maturity | |||
|---|---|---|---|---|
| Category of exposure | Total | Less than 1 year | Between 1 and 5 years | Over 5 years |
| Central governments or central banks | 103,926 | 48,471 | 29,950 | 25,506 |
| Regional governments or local authorities | 7,482 | 1,974 | 1,542 | 3,966 |
| Public sector entities | 5,524 | 742 | 1,042 | 3,740 |
| Multilateral Development Banks | 93 | 5,141 | 6,526 | (11,574) |
| International organizations | 16 | 2 | 13 | 1 |
| Institutions | 20,366 | (1,016) | 13,298 | 8,084 |
| Corporates | 107,908 | 20,525 | 49,438 | 37,945 |
| Retail | 59,973 | 24,052 | 21,151 | 14,770 |
| Secured by mortgages on immovable property | 54,500 | 3,157 | 6,896 | 44,447 |
| Exposures in default | 9,311 | 2,649 | 3,374 | 3,288 |
| Items associated with particularly high risk | 380 | 54 | 77 | 249 |
| Covered bonds | 605 | - | 605 | - |
| Short-term claims on institutions and corporate | 2,063 | 43 | 999 | 1,020 |
| Collective investments undertakings (CIU) | 124 | 111 | 2 | 11 |
| Other exposures | 27,105 | 7,711 | 9,823 | 9,571 |
| Securitized positions | 2,723 | 3 | 186 | 2,534 |
| TOTAL CREDIT RISK BY THE STANDARDIZED APPROACH | 402,098 | 113,617 | 144,922 | 143,558 |
| Central governments or central banks | 3,001 | 883 | 231 | 1,887 |
| Institutions | 112,235 | 72,927 | 16,934 | 22,374 |
| Corporates | 130,154 | 51,038 | 44,782 | 34,335 |
| Retail | 96,276 | 1,492 | 4,328 | 90,456 |
| Securitized positions | 1,042 | - | 714 | 328 |
| TOTAL CREDIT RISK BY THE ADVANCED MEASUREMENT APPROACH | 342,709 | 126,340 | 66,989 | 149,380 |
| TOTAL CREDIT RISK DILUTION AND DELIVERY | 744,807 | 239,957 | 211,911 | 292,938 |
3.2.3.6. Value adjustments for impairment losses and allowances for contingent risks and commitments
The following table presents the movement recorded in the years 2015 and 2014 in the value adjustments for allowances and impairment losses of financial assets on the balance sheet and for contingent risks and commitments, including country risk, generic and specific funds.
Table 17. Value adjustments for impairment losses and allowances for contingent risks and commitments
(Million euros)
| Item | Value adjustments and provisions |
Provisions for contingent liabilities and commitments |
Total |
|---|---|---|---|
| BALANCE AT START OF YEAR | 14,850 | 404 | 15,254 |
| Increase in impairment charged to income | 7,175 | 78 | 7,253 |
| Decrease in impairment credited to income | –2,143 | –76 | –2,219 |
| Institutions acquired by the Group during the year | 6,572 | 307 | 6,879 |
| Institutions disposed of during the year | 0 | 0 | 0 |
| Transfers to written-off loans | –5,239 | –26 | –5,265 |
| Exchange differences and others | –2,404 | 17 | –2,387 |
| BALANCE AT END OF YEAR | 18,811 | 704 | 19,515 |
| Of which: |
|
|
|
| For impaired portfolio | 14,540 | 370 | 14,911 |
| For current non-impaired portfolio | 4,271 | 333 | 4,604 |
3.2.3.7. Total impairment losses for the period
The following table shows details of impairment losses and allowances on financial assets and contingent risks and commitments, as well as derecognition of losses recognized previously in asset write-offs recorded directly in the income statement in 2015 and 2014.
Table 18. Total impairment losses for the period
(Million euros)
| Items | 2015 | 2014 |
|---|---|---|
| Financial assets | 4,495 | 4,401 |
| Of which: |
|
|
| Recovery of written-off assets | 490 | 443 |
| Contigent exposure and commitments (recoveries) | 8 | 15 |
| TOTAL IMPAIRED ASSETS | 4,503 | 4,417 |
3.2.4. Information on the standardized approach
3.2.4.1. Identification of external rating agencies
The external credit assessment institutions (ECAIs) appointed by the Group to determine the risk weightings applicable to its exposures are the following: Standard&Poor’s, Moody’s, Fitch and DBRS.
The exposures for which the ratings of each ECAI are used are those corresponding to the wholesale portfolios, basically involving “Central governments or central banks” in developed countries, and “Financial Institutions”.
In cases where a counterparty has ratings by different ECAIs, the Group follows the procedure laid down in Article 261 of the Solvency Regulations, which specifies the order of priority to be used in the assignment of ratings.
When two different credit ratings made by designated ECAIs are available for a rated exposure, the higher risk weighting will be applied. However, when there are more than two credit ratings for the same rated exposure, use is to be made of the two credit ratings that provide the lowest risk weightings. If the two lowest risk weightings coincide, then that weighting will be applied; if they do not coincide, the higher of the two will be applied.
3.2.4.2. Assignment of the credit ratings of public share issues
The number of cases and the amount of these assignments is not relevant for the Group in terms of admission and management of issuer credit risk.
3.2.4.3. Exposure values before and after the application of credit risk mitigation techniques
The following table presents the amounts for net exposure, prior to the application of credit risk mitigation techniques, for different risk weightings and for the different exposure categories that correspond to the standardized method, excluding securitization positions:
Table 19. Standardized approach: Exposure values before the application of credit risk mitigation techniques
2015
(Million euros)
| Category of exposure | Exposure net of allowances for losses Risk weighting |
Total | ||||||
|---|---|---|---|---|---|---|---|---|
|
|
0% | 20% | 35% | 50% | 75% | 100% | 150% |
|
| Central governments or central banks | 93,471 | 5,326 | 0 | 25,502 | 0 | 9,785 | 5,809 | 139,894 |
| Regional governments or local authorities | 1,367 | 1,754 | 0 | 2,468 | 0 | 1,453 | 0 | 7,043 |
| Public sector entities | 155 | 3,174 | 0 | 525 | 0 | 1,206 | 136 | 5,195 |
| Multilateral Development Banks | 0 | 4 | 0 | 20 | 0 | 15 | 0 | 39 |
| International organizations | 9 | 0 | 0 | 0 | 0 | 0 | 0 | 9 |
| Institutions | 6,221 | 19,807 | 1 | 5,385 | 21 | 2,000 | 132 | 33,568 |
| Corporates | 2,283 | 1,327 | 0 | 1,995 | 3,874 | 143,429 | 244 | 153,153 |
| Retail | 0 | 0 | 0 | 0 | 74,970 | 705 | 0 | 75,674 |
| Secured by mortgages on immovable property | 0 | 0 | 43,939 | 8,598 | 0 | 2,204 | 0 | 54,740 |
| Exposures in default | 0 | 0 | 0 | 0 | 0 | 3,991 | 794 | 4,785 |
| Items associated with particularly high risk | 0 | 15 | 0 | 0 | 39 | 197 | 0 | 251 |
| Covered bonds | 0 | 95 | 0 | 751 | 0 | 0 | 0 | 846 |
| Short-term claims on institutions and corporate | 0 | 2,050 | 0 | 0 | 0 | 309 | 5 | 2,364 |
| Collective investments undertakings (CIU) | 0 | 553 | 0 | 0 | 0 | 53 | 0 | 605 |
| Other exposures | 7,142 | 832 | 0 | 0 | 41 | 19,589 | 0 | 27,605 |
| TOTAL(1) | 110,650 | 34,936 | 43,940 | 45,244 | 78,946 | 184,936 | 7,120 | 505,773 |
2014
(Million euros)
| Category of exposure | Exposure net of allowances for losses Risk weighting |
Total | ||||||
|---|---|---|---|---|---|---|---|---|
|
|
0% | 20% | 35% | 50% | 75% | 100% | 150% |
|
| Central governments or central banks | 78,440 | 1,009 | 0 | 6,194 | 0 | 5,223 | 13,043 | 103,909 |
| Regional governments or local authorities | 32 | 4,321 | 0 | 1,303 | 0 | 1,811 | 0 | 7,467 |
| Public sector entities | 115 | 286 | 0 | 3,275 | 0 | 1,820 | 0 | 5,496 |
| Multilateral Development Banks | 50 | 1 | 0 | 29 | 0 | 13 | 0 | 93 |
| International organizations | 16 | 0 | 0 | 0 | 0 | 0 | 0 | 16 |
| Institutions | 2,839 | 15,018 | 0 | 1,734 | 0 | 664 | 89 | 20,344 |
| Corporates | 0 | 7,649 | 0 | 1,730 | 3,972 | 94,321 | 73 | 107,744 |
| Retail | 0 | 0 | 0 | 0 | 59,369 | 137 | 0 | 59,506 |
| Secured by mortgages on immovable property | 0 | 0 | 46,118 | 6,262 | 0 | 1,768 | 0 | 54,147 |
| Exposures in default | 0 | 0 | 0 | 0 | 0 | 5,359 | 512 | 5,870 |
| Items associated with particularly high risk | 0 | 32 | 0 | 0 | 68 | 249 | 0 | 349 |
| Covered bonds | 0 | 605 | 0 | 0 | 0 | 0 | 0 | 605 |
| Short-term claims on institutions and corporate | 0 | 1,765 | 0 | 5 | 0 | 289 | 3 | 2,063 |
| Collective investments undertakings (CIU) | 0 | 120 | 0 | 0 | 0 | 5 | 0 | 124 |
| Other exposures | 8,178 | 600 | 0 | 0 | 31 | 18,198 | 14 | 27,020 |
| TOTAL(1) | 89,669 | 31,406 | 46,118 | 20,532 | 63,439 | 129,856 | 13,733 | 394,754 |
The tables below show exposure amounts after the application of credit risk mitigation techniques, for different risk weightings and for the different categories of risk that correspond to the standardized method, excluding securitization positions:
Table 20. Standardized approach: Exposure values after the application of credit risk mitigation techniques
2015
(Million euros)
| Category of exposure | Fully adjusted value of the exposure (1) Risk weighting |
Total | ||||||
|---|---|---|---|---|---|---|---|---|
|
|
0% | 20% | 35% | 50% | 75% | 100% | 150% |
|
| Central governments or central banks | 93,273 | 6,399 | 0 | 25,798 | 0 | 9,785 | 5,807 | 141,063 |
| Regional governments or local authorities | 1,367 | 1,688 | 0 | 2,468 | 0 | 1,453 | 0 | 6,977 |
| Public sector entities | 855 | 568 | 0 | 525 | 0 | 1,004 | 136 | 3,087 |
| Multilateral Development Banks | 0 | 4 | 0 | 20 | 0 | 15 | 0 | 39 |
| International organizations | 9 | 0 | 0 | 0 | 0 | 0 | 0 | 9 |
| Institutions (3) | 3,912 | 19,529 | 0 | 4,101 | 20 | 1,830 | 132 | 29,525 |
| Corporates | 2,283 | 1,203 | 0 | 1,993 | 3,024 | 134,484 | 232 | 143,219 |
| Retail | 0 | 0 | 0 | 0 | 72,999 | 697 | 0 | 73,696 |
| Secured by mortgages on immovable property | 0 | 0 | 43,038 | 8,549 | 0 | 1,685 | 0 | 53,272 |
| Exposures in default | 0 | 0 | 0 | 0 | 0 | 3,709 | 740 | 4,449 |
| Items associated with particularly high risk | 0 | 15 | 0 | 0 | 35 | 152 | 0 | 202 |
| Covered bonds | 0 | 89 | 0 | 751 | 0 | 0 | 0 | 839 |
| Short-term claims on institutions and corporate | 0 | 2,050 | 0 | 0 | 0 | 309 | 5 | 2,364 |
| Collective investments undertakings (CIU) | 0 | 450 | 0 | 0 | 0 | 11 | 0 | 461 |
| Other exposures | 16,167 | 1,298 | 0 | 0 | 41 | 18,516 | 0 | 36,023 |
| TOTAL(2) | 117,867 | 33,292 | 43,038 | 44,206 | 76,120 | 173,651 | 7,051 | 495,226 |
2014
(Million euros)
| Category of exposure | Fully adjusted value of the exposure (1) Risk weighting |
Total | ||||||
|---|---|---|---|---|---|---|---|---|
|
|
0% | 20% | 35% | 50% | 75% | 100% | 150% |
|
| Central governments or central banks | 82,210 | 2,235 | 0 | 6,194 | 0 | 5,223 | 13,043 | 108,904 |
| Regional governments or local authorities | 32 | 4,242 | 0 | 1,302 | 0 | 1,811 | 0 | 7,387 |
| Public sector entities | 675 | 392 | 0 | 659 | 0 | 1,374 | 0 | 3,099 |
| Multilateral Development Banks | 50 | 1 | 0 | 29 | 0 | 13 | 0 | 93 |
| International organizations | 16 | 0 | 0 | 0 | 0 | 0 | 0 | 16 |
| Institutions (3) | 2,832 | 15,049 | 0 | 1,639 | 0 | 768 | 89 | 20,377 |
| Corporates | 0 | 7,668 | 0 | 1,723 | 3,183 | 89,500 | 68 | 102,143 |
| Retail | 0 | 0 | 0 | 0 | 57,049 | 135 | 0 | 57,185 |
| Secured by mortgages on immovable property | 0 | 6 | 45,002 | 6,197 | 0 | 1,278 | 0 | 52,482 |
| Exposures in default | 0 | 0 | 0 | 0 | 0 | 4,781 | 463 | 5,244 |
| Items associated with particularly high risk | 0 | 15 | 0 | 0 | 59 | 134 | 0 | 208 |
| Covered bonds | 0 | 605 | 0 | 0 | 0 | 0 | 0 | 605 |
| Short-term claims on institutions and corporate | 0 | 1,765 | 0 | 5 | 0 | 61 | 3 | 1,834 |
| Collective investments undertakings (CIU) | 0 | 46 | 0 | 0 | 0 | 5 | 0 | 51 |
| Other exposures | 13,371 | 1,042 | 46 | 0 | 31 | 16,965 | 14 | 31,468 |
| TOTAL(2) | 99,185 | 33,065 | 45,047 | 17,748 | 60,322 | 122,048 | 13,680 | 391,096 |
The following table presents the main variations in the period in terms of RWAs for the Credit Risk standardized approach.
Table 21. Variations in the period in terms of RWAs for the Credit Risk standardized approach
(Million euros)
| Credit Risk (SA) | ||
|---|---|---|
| RWAs Dec 14 |
|
177,425 |
| Effects | Asset size | 27,598 |
| Model updates | –3,957 | |
| Acquisitions and disposals | 56,421 | |
| Foreign exchange movements | –30,271 | |
| Others | 1,521 | |
| RWAs Dec 15 |
|
228,737 |
The increase in RWAs for credit risk in the standardized model is due mainly to:
- Asset size: Increased activity in the emerging countries in which the Group operates, as well as in the United States.
- Model updating: Transfer of the portfolio from the merged company Unnim to IRB models.
- Acquisitions and disposals: Garanti’s global consolidation following the purchase of a 14.89% stake in its share capital, bringing the Group’s holding to 39.9%, which has caused an increase of approximately 48,800 million euros. In addition, the purchase of Catalunya Banc, which has meant an increase of around 7,500 million euros.
- Exchange rate fluctuations: Caused to a great extent by the conversion of the Venezuelan currency at the closing exchange rate, resulting in an impact of around 28,500 million euros.
The table below shows the balances of specific, generic and country risk allowances for losses, by exposure categories, as of December 31, 2015 and 2014:
Table 22. Balance of specific, generic and country risk allowances for losses, by exposure category (Standardized approach)
|
|
Loan-loss provisions |
|---|---|
| Category of exposure | 2015 |
| Central governments or central banks | 17 |
| Regional governments or local authorities | 7 |
| Public sector entities | 15 |
| Multilateral Development Banks | 0 |
| International organizations | 0 |
| Institutions | 26 |
| Corporates | 2,198 |
| Retail | 537 |
| Secured by mortgages on immovable property | 239 |
| Exposures in default | 4,960 |
| Items associated with particularly high risk | 7 |
| Covered bonds | - |
| Short-term claims on institutions and corporate | - |
| Collective investments undertakings (CIU) | 0 |
| Other exposures | 86 |
| TOTAL | 8,092 |
3.2.5. Information on the IRB method
3.2.5.1. General information
3.2.5.1.1. Authorization by the supervisor for the use of the IRB method
The following is a list of the models authorized by the supervisor for the purpose of their use in the calculation of capital requirements.
Table 23. Models authorized by the supervisor for the purpose of their use in the calculation of capital requirements
| Institution Portfolio | Portfolio |
|---|---|
| BBVA S.A.* | Financial institutions |
| Public institutions | |
| Specialized finance | |
| Developers | |
| Small Corporates | |
| Medium-sized Corporates | |
| Large Corporates | |
| Mortgages | |
| Consumer finance | |
| Credit cards | |
| BBVA Ireland | Financial institutions |
| Large Corporates | |
| BBVA Bancomer | Retail Revolving (Credit Cards) |
| Large Corporates | |
| Medium-sized Corporates | |
| BBVA Group | Equity |
The approval of the models by the supervisor includes both own estimations of the probability of default (PD), loss given default (LGD) and the internal estimation of credit conversion factors (CCFs).
The Group maintains its calendar for receiving approval for additional advanced internal models in different types of risks and geographical areas.
3.2.5.1.2. Structure of internal rating systems and relationship between internal and external ratings
The Group has rating tools for each one of the exposure categories listed in the Basel Accord.
The retail portfolio has scoring tools for determining the credit quality of transactions on the basis of information on the transaction itself and on the customer. The scoring models are algorithms estimated using statistical methods that score each transaction. This score reflects the transaction’s level of risk and is in direct relation to its probability of default (PD).
These decision models are the basic tool for deciding who should receive a loan and the amount to be granted, thereby contributing to both the arrangement and management of retail type loans.
For the wholesale portfolio, the Group has rating tools that, as opposed to scorings, do not assess transactions but rather, customers. The Group has different tools for rating the various customer segments: small companies, corporates, government and other government agencies, etc. In those wholesale portfolios where the number of defaults is very low (sovereign risks, corporates, financial institutions) the internal information is supplemented by the benchmarks of external rating agencies.
The PD estimates made by the Group are transferred to the Master Scale, enabling a comparison to be made with the scales used by external agencies. This is shown below.
Table 24. Master Scale of BBVA’s rating
|
|
|
Probability of default (basic points) | ||
|---|---|---|---|---|
| External Rating Standard & Poor’s List |
Internal Rating Reduced List (22 groups) |
Average | Minimun from >= |
Maximum |
| AAA | AAA | 1 | - | 2 |
| AA+ | AA+ | 2 | 2 | 3 |
| AA | AA | 3 | 3 | 4 |
| AA- | AA- | 4 | 4 | 5 |
| A+ | A+ | 5 | 5 | 6 |
| A | A | 8 | 6 | 9 |
| A- | A- | 10 | 9 | 11 |
| BBB+ | BBB+ | 14 | 11 | 17 |
| BBB | BBB | 20 | 17 | 24 |
| BBB- | BBB- | 31 | 24 | 39 |
| BB+ | BB+ | 51 | 39 | 67 |
| BB | BB | 88 | 67 | 116 |
| BB- | BB- | 150 | 116 | 194 |
| B+ | B+ | 255 | 194 | 335 |
| B | B | 441 | 335 | 581 |
| B- | B- | 785 | 581 | 1,061 |
| CCC+ | CCC+ | 1,191 | 1,061 | 1,336 |
| CCC | CCC | 1,500 | 1,336 | 1,684 |
| CCC- | CCC- | 1,890 | 1,684 | 2,121 |
| CC+ | CC+ | 2,381 | 2,121 | 2,673 |
| CC | CC | 3,000 | 2,673 | 3,367 |
| CC- | CC- | 3,780 | 3,367 | 4,243 |
3.2.5.1.3. Use of internal estimations for purposes other than the calculation of capital requirements
The Group’s internal estimations are a vital component of management based on value creation, giving rise to criteria for assessing the risk-return trade-off.
These measures have a broad range of uses, from the adoption of strategic business decisions through to the individual admission of transactions.
Specifically, internal estimates are used in everyday business in support of credit risk management through their inclusion in admission and monitoring processes, as well as in the pricing of transactions.
The management use of performance metrics that consider expected loss, economic capital and risk-adjusted return enables the monitoring of portfolios and the assessment of non-performing positions, among others.
3.2.5.1.4. Process for managing and recognizing the effects of credit risk mitigation
The Group uses risk mitigation techniques for exposures pertaining to the wholesale portfolio by replacing the obligor’s PD with that of the guarantor, in those cases in which the latter is eligible and their PD is lower than the obligor’s.
Regarding processes of retail admission, the scoring contains the effect of the guarantor, and the recovery flows that are forthcoming throughout the cycle reflect the recoveries related to the guarantees associated with the contracts. This means that the effect of the guarantees is taken into account in the actual estimation of the loss given default for retail portfolios.
3.2.5.1.5. Mechanisms used for controlling internal rating systems
The entity carries out the control and monitoring of the rating systems and metrics for risk management for private individuals, SMEs and the self-employed, corporates and institutions. The activities are carried out, within certain analytical and qualitative fields, by realizing periodic 360º monitoring of all impacts of the tools as well as their internal function in terms of efficiency and effectiveness.
Global understanding of the systems allows action plans to be established, with a follow-up to ensure their proper execution. The weaknesses of the rating tools are thus identified and managed. The monitoring function is the main driving force of new developments and evolving maintenance, which allow the business interests of the entity to be aligned with regulatory requirements and management needs within a framework of analytical, technical and technological capacities.
In general, there is a series of corporate management programs that establish the main lines and minimum contents determining the management and/or supervision of the different credit risk models, as well as defining the metrics for their correct control.
More specifically, these corporate management programs will be adjusted to each of the rating tools of a business area within a time horizon adapted to the nature of the tool.
Periodically, an overall monitoring and review of compliance with the thresholds agreed under the management program will be carried out to detect situations that could potentially require an adjustment to the models and/or credit policies and to take early corrective actions to minimize the impact of such situations.
Analysis, in the methodological sphere, is defined as the monitoring of the predictive capabilities of the models, backtesting calibration of the parameters, proper granularity and concentration, sample stability of input, as well as traceability, integrity and consistency.
The use of rating systems by the different areas is overseen from the context of integration in management. This context defines parameter sensitivity tests, stress- tests of estimates, proper use of the parameters in the portfolio management to facilitate decision-making, control of exposure without rating, risk policies and the framework for delegating tasks, structures of decision-making committees, implementation risk evaluation, proper technological environment, evaluation of the inclusion of the parameters in corporate applications, proper follow-up of the training of users to guarantee its proper implementation and full comprehension, follow-up of the correct structure and quality of documentation, as well as all other activities that ensure the proper use of management metrics.
Apart from the corporate management programs mentioned above, access to the internal rating systems is based on IT system- authorized profiles that ensure only the customer loan management supervisors can see the scoring and rating.
Control of the capital process is performed by risk units that are independent of the units that calculate the scoring and rating and which, therefore, are users of the internal rating system. These control mechanisms are established at different levels of the process, such as at input, execution and final outputs, and involve both the integrity of the data and their accuracy and correctness.
3.2.5.1.6. Description of the internal rating process
There follows a description of the internal classification processes according to each customer category:
- Central banks and central governments: For this segment, the assignment of ratings is made by the Risk units appointed for this purpose, which periodically analyze this type of customers, rating them according to the parameters included in the corresponding rating model. There are 3 different methods currently in use for assigning country ratings: (i) ratings from external agencies, used for developed nations, emerging countries with elevated incomes and emerging countries where the Group has little risk, (ii) internal rating based on a proprietary tool used for emerging countries where the Group has an appreciable risk, and lastly (iii) the country risk ratings published by the Belgian export credit agency (which manages the quantitative model used by the OECD to assign its country risk ratings) for countries of marginal importance for the Group that have no external qualifications. Sovereign ratings are generated in local and foreign currency for all the tools, as well as a transfer rating, which evaluates the risk of inconvertibility/transfer restrictions.
In the case of emerging countries with presence of BBVA subsidiaries or branches, the rating in local currency is adjusted to that obtained by the emerging countries tool under the authorization of the Risk Committee assigned for this purpose.
- Institutions: The rating of Public Institutions is generally provided by the risk units responsible for their approval, on a yearly basis, coinciding with the review of customer risk or with the reporting of their accounts.
In the case of Financial Institutions, the Risk unit responsible makes a regular assessment of this type of customer, continuously monitoring their evolution on domestic and international markets. External ratings are a key factor in assigning ratings for financial institutions.
- Large Companies: Includes the rating of exposures with corporate business groups. The result is affected both by indicators of business risk (evaluation of the competitive environment, business positioning, regulation, etc.) and financial risk indicators (size of the group by sales, cash generation, levels of debt, financial flexibility, etc.).
In accordance with the characteristics of the large companies segment, the rating model is global in nature with specific algorithms by sector of activity and geographical adaptations. The rating of these customers is generally calculated within the framework of the annual risk review process, or the admission of new operations.
The responsibility for the assessment lies with the units originating the risk, while those approving it validate it when the decision is taken.
- Medium-sized companies: This segment also takes into account quantitative factors derived from economic and financial information, and qualitative factors that are related to the age of the company, the sector, management quality, etc. and alert factors derived from risk monitoring.
As in the Corporate segment, the rating tends to run parallel to the admission process, so the responsibility for rating lies with the unit proposing the risk, while the decision-making level is in charge of validating it.
- Small Businesses: As in the case of medium-sized companies, this segment also takes into account quantitative factors derived from economic and financial information, and qualitative factors that are related to the age of the company, the sector, management quality, etc. and alert factors derived from risk monitoring. Similarly, the rating tends run parallel with the admission process, so the responsibility for rating is with the unit proposing the risk, while the decision-making level is in charge of validating it.
- Specialized Finance: For classifying this segment, the Group has chosen to apply the supervisory slotting criteria approach, as included in the Basel Accord of June 2004 and in the Solvency Regulations.
- Developers: The rating of real-estate developers allows the rating of both the customers who are developers and the individual real-estate projects. Its use makes it easier to monitor and rate projects during their execution phase, as well as enriching the admission processes.
- BBVA Bancomer companies: This segment also takes into account quantitative factors derived from economic and financial information and bureau information, as well as qualitative factors related to the age of the company, the sector, the quality of its management, etc. The rating tends to run parallel to the admission process, so that responsibility for the rating is with the unit originating the risk, while the decision-making body validates it.
In general in the wholesale area, the rating of customers is not limited to admission, as the ratings are updated according to new information available at any time (economic and financial data, changes in the company, external factors, etc.)
- Retail: This has been broken down into each one of the exposure categories referred to by the correlations provided for in the sections defined in the Solvency Regulations.
One of the most important processes in which scoring is fully integrated at the highest level and in all decision-making areas is the Group’s process for approving retail transactions. Scoring is an important factor for the analysis and resolution of transactions and it is a mandatory requirement to include it in decision- making on risk in those segments for which it has been designed. In the process of marketing and approving retail transactions, the manager is responsible for marketing management, the quality of the risk and the return, in other words, the customer’s comprehensive management, attending to the processes of admission, monitoring and control.
The rating process is as follows for each specific category of retail exposure:
a. Mortgages, consumer finance and retail credit cards - Spain: The manager collects data on the customer (personal, financial, banking relationship information) and on the operation (LTV, amount, maturity, destination etc.) and calculates the rating of the transaction with the scoring. The decision of whether it is approved is made based on the results issued by the model.
b. Autos Finanzia: The financing application may enter through the call center or be directly recorded in Finanzianet by our authorized dealers. The necessary information on the customer (personal, financial information, authorization of the consult from the external bureau of credit) and on the transaction (maturity, amount, etc.) is recorded to rate the transaction with the scoring. Once the validity of the information provided is obtained, the decision of whether to approve it is made based on the results issued by the model.
c. Retail Revolving (BBVA Bancomer credit cards): The manager or specialist party gathers the necessary information on the customer (personal, financial information and authorization of the consult from the external bureau of credit) and on the transaction (limit requested) to rate the transaction with the scoring. There are additional processes for validating and checking this information through the back office or operational support areas. The decision of whether it is approved is made based on the results issued by the model.
d. Proactive - Spain: Each month all the customers who have asset positions in credit cards, consumer finance or mortgages and liabilities positions in credit cards and consumer finance, are rated according to information on their behavior.
- Equity: For its portfolio position registered as equity, the Group is applying the rating obtained for customers as a result of their classification in the lending process.
3.2.5.1.7. Definitions, methods and data for estimating and validating risk parameters
The estimation of the parameters is based on the uniform definition of default established at Group level. Specifically, for a contract or customer to be considered in a situation of default, the provisions of section 4.1.1 must be met, in line with current regulations.
Specifically, there are two approaches within the Group for considering default and estimating parameters:
- The contract-level approach is applied within the sphere of retail risk. Each customer transaction is dealt with as an independent unit in terms of credit risk. Therefore, non-compliance with credit obligations to the bank is handled at the transaction level, regardless of the behavior of the customer with respect to other obligations.
- The customer-level approach is applied to the remainder of the portfolio. The significant unit for defining default is the customer’s sum of contracts, which enter a situation of default en masse when the customer defaults.
In addition, to avoid including defaults for small amounts in the estimations, defaulted volumes are to pass through a materiality filter that depends on the type of customer and transaction.
Estimating parameters
In the case of Spain and Mexico, the Group has an RAR information system that reflects exposure to credit risk in the Group’s different portfolios included in advanced internal models.
This information system guarantees the availability of historical data recorded by the Group, which are used to estimate the parameters of Probability of Default (PD), Loss Given Default (LGD) and Credit Conversion Factors (CCF). These are then used to calculate the regulatory capital using the advanced measurement approach, economic capital and expected loss by credit risk.
Other sources of information for the Bank may be used in addition, depending on any new needs detected in the estimation process. Internal estimations of the PD, LGD and CCF parameters are made for all the Group’s portfolios.
In the case of low default portfolios (LDP), in which the number of defaults tends to be insufficient for obtaining empirical estimates, use is made of data from external agencies that are merged with the internal information available and expert criteria.
The following shows the estimation methodologies used for the PD, LGD and CCF risk parameters, for the purpose of calculating the capital requirements.
-
Probability of default (PD)
The methodology used for estimating the PD in those cases that have a mass of internal data of sufficient size is based on the creation of pools of exposures. The groups proposed with a view to calibration are defined by pooling contracts together seeking to achieve intra-group uniformity in terms of credit quality and differentiation with all the other risk groups. The largest possible number of pools is defined in order to allow a suitable discrimination of risk.
The fundamental metric used for making these groupings is the score, being supplemented by other metrics relevant to PD that are proven to be sufficiently discriminating depending on the portfolio.
Once the pools of exposures have been defined, the average empirical PD recorded for each one is obtained and adjusted to the cycle. This metric provides stable estimates over the course of the economic cycle, referred to as PD-TTC (Through the Cycle). This calculation considers the portfolio’s track record and provides long-term levels of PD.
In low default portfolios (LDPs) the empirical PDs observed by external credit assessment institutions are used to obtain the PD of internal risk groups.
Finally, in customer-focused portfolios there is a Master Scale, which is simply a standard and uniform rule for credit levels that makes it possible to make comparisons of credit quality in the Group’s different portfolios.
-
Loss given default (LGD)
CAs a general rule, the method used to estimate the severity in portfolios with a sufficient number of defaults is Workout LGD Here, the LGD of a contract is obtained as a quotient of the sum of all the financial flows recorded during the recovery process that takes place when a transaction defaults, and the transaction’s exposure at the time of the default.
This estimate is made by considering all the historical data recorded in internal systems. When making the estimates, there are transactions that have already defaulted but for which the recovery process is still ongoing. The loss given default recorded at the time of the estimate is therefore higher than it will ultimately be. The necessary adjustments are made in these cases so as not to distort the estimate.
These estimates are made by defining uniform risk groups in terms of the nature of the operations that determine loss given default. They are made in such a way that there are enough groups for each one to be distinguishable and receive a different estimate.
In keeping with the guidelines set out by the rules, the estimates are made by distinguishing between wholesale and retail type exposures.
There is insufficient historical experience to make a robust estimation in low default portfolios (LDP) using the Workout LGD method, so external sources of information are used, combined with internal data to provide the portfolio with a representative rate of loss given default.
The loss given default rates estimated according to the internal databases the Group holds are conditioned to the moment of the cycle of the data window used, since loss given default varies over the economic cycle. Hence, two concepts can be defined: long-term loss given default, referred to as Long-Run LGD (LRLGD), and loss given default in a period of stress in the cycle, called Downturn LGD (DLGD).
LRLGD is calculated by making an adjustment to capture the difference between the loss given default obtained empirically with the available sample and the average loss given default observed throughout the economic cycle if the observation is complete.
In addition, the LGD observed in a period of stress in the economic cycle (DLGD) is determined.
These estimates are made for those portfolios whose loss given default is noticeably sensitive to the cycle. The different ways in which the recovery cycles can conclude are determined for each portfolio where this LGD in conditions of stress has not yet been observed, and the level these parameters would have in a downturn situation are estimated.
-
Credit conversion factor (CCF)
As with the two preceding parameters, the exposure at the moment of default is another of the necessary inputs for calculating expected loss and regulatory capital. A contract’s exposure usually coincides with its balance. However, this does not hold true in all cases.
For example, for those products with explicit limits, such as credit cards or credit lines, the exposure should incorporate the potential increase in the balance that may be recorded up to the time of default.
In observance of regulatory requirements, exposure is calculated as the drawn balance, which is the real risk at any specific moment, plus a percentage (CCF) of the undrawn balance, which is the part that the customer can still use until the available limit is reached. Therefore, the CCF is defined as the percentage of the undrawn balance that is expected to be used before default occurs.
CCF is estimated by using the cohort approach, analyzing how the exposure varies from a pre-established reference date through to the moment of default, obtaining the average performance according to the relevant metrics.
Different approaches are used for wholesale and retail type exposures. The contract approach analyzes the exposure’s evolution until the contract’s moment of breach of contract, whereas the customer approach analyzes the exposure’s evolution through to the moment of breach by the customer.
Once again, in low default portfolios (LDP) there is insufficient historical experience to make a reliable calculation with the Workout LGD method defined. In this case, too, use is made of external sources that are combined with internal data to provide a representative CCF of the portfolio.
3.2.5.2. Exposure values by category and PD interval
The following table presents the information on credit risk by method of internal classifications (IRB) by obligor grade for the different categories of exposure. The information shown is balance-sheet volume, off-balance-sheet volume, exposure, EAD, PD-TTC and Downturn LGD and RW (internal estimates approved by the supervisor):
Table 25. Advanced measurement approach: Exposure values by category and obligor grade
(Million euros)
| Categories of Exposure | On balance sheet original gross exposure (1) | Off balance sheet exposure before CCF (2) | Original gross exposure (3) (1+2) | PD-TTC (%) |
LGD (%) | EAD (4) | RWA | Expected loss | Provisions | RW (%) |
|---|---|---|---|---|---|---|---|---|---|---|
| Central governments or central banks | 5,333 | 785 | 6,118 | 2% | 29% | 5,730 | 224 | 32 | (19) | 4% |
| 0,00 to <0,15 | 5,055 | 642 | 5,697 | 0% | 29% | 5,381 | 145 | 1 | (4) | 3% |
| 0,15 to <0,25 | 88 | - | 88 | 0% | 44% | 88 | 7 | 0 | (0) | 8% |
| 0,25 to <0,5 | 24 | - | 24 | 0% | 40% | 24 | 10 | 0 | (0) | 40% |
| 0,5 to <0,75 | 0 | 0 | 1 | 1% | 26% | 0 | 0 | 0 | - | 49% |
| 0,75 to <2,5 | 26 | 15 | 41 | 1% | 21% | 33 | 20 | 0 | (0) | 59% |
| 2,5 to <10 | 117 | 0 | 118 | 4% | 24% | 118 | 30 | 1 | (0) | 26% |
| 10 to <100 | - | 1 | 1 | 21% | 20% | 0 | 0 | 0 | - | 104% |
| 100 to (Default) | 23 | 127 | 149 | 100% | 34% | 86 | 12 | 29 | (15) | 13% |
| Institutions | 84,612 | 5,646 | 90,259 | 1% | 19% | 87,798 | 10,826 | 132 | (106) | 12% |
| 0,00 to <0,15 | 63,236 | 3,782 | 67,018 | 0% | 20% | 65,390 | 5,429 | 10 | (10) | 8% |
| 0,15 to <0,25 | 3,956 | 425 | 4,380 | 0% | 22% | 4,224 | 924 | 2 | (1) | 22% |
| 0,25 to <0,5 | 11,216 | 891 | 12,107 | 0% | 19% | 11,708 | 2,518 | 7 | (6) | 22% |
| 0,5 to <0,75 | 1,013 | 172 | 1,185 | 1% | 24% | 1,086 | 394 | 1 | (2) | 36% |
| 0,75 to <2,5 | 3,536 | 158 | 3,694 | 1% | 8% | 3,622 | 587 | 3 | (10) | 16% |
| 2,5 to <10 | 1,352 | 65 | 1,417 | 4% | 12% | 1,388 | 531 | 6 | (8) | 38% |
| 10 to <100 | 85 | 139 | 225 | 20% | 44% | 155 | 396 | 14 | (12) | 256% |
| 100 to (Default) | 218 | 14 | 232 | 100% | 40% | 225 | 45 | 89 | (57) | 20% |
| Corporates | 82,591 | 56,021 | 138,613 | 9% | 37% | 111,061 | 63,607 | 4,027 | (5,976) | 57% |
| Of which: SMEs | 17,734 | 2,938 | 20,671 | 29% | 44% | 19,059 | 12,487 | 2,596 | (3,112) | 66% |
| 0,00 to <0,15 | 950 | 582 | 1,533 | 0% | 50% | 1,182 | 323 | 1 | (2) | 27% |
| 0,15 to <0,25 | 547 | 182 | 729 | 0% | 50% | 631 | 246 | 1 | (2) | 39% |
| 0,25 to <0,5 | 1,038 | 299 | 1,337 | 0% | 49% | 1,176 | 560 | 2 | (2) | 48% |
| 0,5 to <0,75 | 1,591 | 352 | 1,943 | 1% | 48% | 1,752 | 1,046 | 4 | (18) | 60% |
| 0,75 to <2,5 | 3,606 | 739 | 4,345 | 1% | 43% | 3,963 | 3,010 | 20 | (17) | 76% |
| 2,5 to <10 | 4,414 | 617 | 5,031 | 4% | 37% | 4,684 | 4,742 | 77 | (176) | 101% |
| 10 to <100 | 445 | 27 | 472 | 17% | 37% | 462 | 714 | 29 | (74) | 155% |
| 100 to (Default) | 5,142 | 140 | 5,282 | 100% | 47% | 5,209 | 1,846 | 2,464 | (2,822) | 35% |
| Of which: Other | 54,278 | 51,183 | 105,461 | 6% | 40% | 80,253 | 40,954 | 1,431 | (2,605) | 51% |
| 0,00 to <0,15 | 18,359 | 25,782 | 44,142 | 0% | 42% | 31,298 | 9,491 | 14 | (37) | 30% |
| 0,15 to <0,25 | 5,838 | 8,882 | 14,720 | 0% | 42% | 10,214 | 4,352 | 8 | (18) | 43% |
| 0,25 to <0,5 | 8,786 | 6,909 | 15,696 | 0% | 42% | 12,417 | 6,841 | 16 | (20) | 55% |
| 0,5 to <0,75 | 7,264 | 5,571 | 12,835 | 0% | 41% | 10,355 | 6,986 | 20 | (16) | 67% |
| 0,75 to <2,5 | 5,336 | 2,272 | 7,608 | 1% | 36% | 6,437 | 5,595 | 25 | (21) | 87% |
| 2,5 to <10 | 4,283 | 1,240 | 5,523 | 4% | 38% | 4,885 | 6,052 | 78 | (174) | 124% |
| 10 to <100 | 292 | 131 | 424 | 11% | 37% | 364 | 663 | 15 | (25) | 182% |
| 100 to (Default) | 4,119 | 395 | 4,514 | 100% | 29% | 4,284 | 975 | 1,254 | (2,294) | 23% |
| Of which: specialized finance | 10,579 | 1,901 | 12,480 |
|
|
11,748 | 10,165 |
|
(259) | 87% |
| Retail | 104,862 | 21,005 | 125,867 | 7% | 25% | 108,669 | 23,180 | 2,600 | (2,510) | 21% |
| Of which: Secured by real estate SMEs | 1,010 | 52 | 1,061 | 48% | 41% | 1,031 | 441 | 297 | (266) | 43% |
| 0,00 to <0,15 | 51 | 7 | 58 | 0% | 9% | 51 | 1 | 0 | (0) | 2% |
| 0,15 to <0,25 | 1 | - | 1 | 0% | 38% | 1 | 0 | 0 | (0) | 11% |
| 0,25 to <0,5 | 38 | 4 | 42 | 0% | 18% | 39 | 4 | 0 | (0) | 9% |
| 0,5 to <0,75 | 117 | 13 | 130 | 1% | 24% | 126 | 22 | 0 | (0) | 17% |
| 0,75 to <2,5 | 128 | 9 | 136 | 1% | 27% | 133 | 45 | 0 | (1) | 34% |
| 2,5 to <10 | 135 | 8 | 143 | 4% | 25% | 141 | 88 | 2 | (1) | 63% |
| 10 to <100 | 68 | 2 | 71 | 21% | 26% | 69 | 81 | 4 | (1) | 117% |
| 100 to (Default) | 471 | 9 | 480 | 100% | 62% | 471 | 200 | 291 | (262) | 43% |
| Of which: Secured by real estate non-SMEs | 89,316 | 6,694 | 96,010 | 6% | 17% | 89,410 | 11,970 | 1,351 | (1,267) | 13% |
| 0,00 to <0,15 | 58,412 | 4,514 | 62,926 | 0% | 15% | 58,486 | 1,351 | 5 | (58) | 2% |
| 0,15 to <0,25 | 3,144 | 44 | 3,188 | 0% | 20% | 3,146 | 270 | 1 | (3) | 9% |
| 0,25 to <0,5 | 4,948 | 654 | 5,601 | 0% | 18% | 4,952 | 540 | 3 | (7) | 11% |
| 0,5 to <0,75 | 3,580 | 388 | 3,967 | 1% | 18% | 3,583 | 552 | 3 | (5) | 15% |
| 0,75 to <2,5 | 6,119 | 504 | 6,623 | 1% | 19% | 6,124 | 1,653 | 13 | (28) | 27% |
| 2,5 to <10 | 6,595 | 371 | 6,966 | 5% | 20% | 6,599 | 4,281 | 63 | (114) | 65% |
| 10 to <100 | 1,835 | 102 | 1,937 | 21% | 23% | 1,836 | 2,416 | 86 | (46) | 132% |
| 100 to (Default) | 4,684 | 118 | 4,802 | 100% | 25% | 4,684 | 907 | 1,176 | (1,006) | 19% |
| Of which: Eligible revolving | 6,324 | 13,184 | 19,507 | 7% | 74% | 9,433 | 7,420 | 496 | (462) | 79% |
| 0,00 to <0,15 | 665 | 2,873 | 3,538 | 0% | 42% | 1,593 | 23 | 0 | (2) | 1% |
| 0,15 to <0,25 | 13 | 32 | 44 | 0% | 48% | 24 | 1 | 0 | (0) | 6% |
| 0,25 to <0,5 | 80 | 89 | 169 | 0% | 47% | 110 | 9 | 0 | (0) | 8% |
| 0,5 to <0,75 | 371 | 1,424 | 1,795 | 1% | 78% | 572 | 109 | 2 | (2) | 19% |
| 0,75 to <2,5 | 1,180 | 3,783 | 4,963 | 1% | 79% | 1,879 | 693 | 18 | (16) | 37% |
| 2,5 to <10 | 2,964 | 4,491 | 7,455 | 5% | 83% | 4,057 | 4,342 | 176 | (160) | 107% |
| 10 to <100 | 900 | 491 | 1,391 | 22% | 80% | 1,047 | 2,236 | 182 | (165) | 214% |
| 100 to (Default) | 151 | 0 | 151 | 100% | 77% | 151 | 6 | 117 | (117) | 4% |
| Of which: Other SMEs | 2,478 | 1,022 | 3,500 | 12% | 58% | 3,058 | 1,475 | 242 | (196) | 48% |
| 0,00 to <0,15 | 47 | 30 | 77 | 0% | 54% | 65 | 9 | 0 | (0) | 14% |
| 0,15 to <0,25 | 74 | 60 | 134 | 0% | 56% | 108 | 20 | 0 | (0) | 19% |
| 0,25 to <0,5 | 154 | 85 | 240 | 0% | 55% | 203 | 51 | 0 | (0) | 25% |
| 0,5 to <0,75 | 294 | 181 | 475 | 0% | 55% | 391 | 131 | - | (1) | 34% |
| 0,75 to <2,5 | 777 | 365 | 1,142 | 1% | 57% | 979 | 509 | 7 | (3) | 52% |
| 2,5 to <10 | 815 | 233 | 1,049 | 4% | 57% | 952 | 650 | 23 | (12) | 68% |
| 10 to <100 | 62 | 14 | 76 | 17% | 55% | 72 | 66 | 7 | (4) | 92% |
| 100 to (Default) | 254 | 53 | 308 | 100% | 71% | 288 | 39 | 206 | (175) | 13% |
| Of which: Other non-SMEs | 5,734 | 54 | 5,787 | 8% | 51% | 5,737 | 1,874 | 214 | (319) | 33% |
| 0,00 to <0,15 | 2,422 | 8 | 2,430 | 0% | 52% | 2,423 | 206 | 1 | (5) | 9% |
| 0,15 to <0,25 | 276 | 2 | 278 | 0% | 53% | 276 | 62 | 0 | (1) | 22% |
| 0,25 to <0,5 | 442 | 3 | 444 | 0% | 56% | 442 | 144 | 1 | (1) | 33% |
| 0,5 to <0,75 | 446 | 4 | 450 | 1% | 53% | 447 | 193 | 1 | (1) | 43% |
| 0,75 to <2,5 | 708 | 5 | 713 | 1% | 52% | 708 | 419 | 4 | (3) | 59% |
| 2,5 to <10 | 897 | 12 | 909 | 5% | 46% | 898 | 640 | 19 | (12) | 71% |
| 10 to <100 | 170 | 1 | 171 | 22% | 50% | 170 | 194 | 18 | (10) | 114% |
| 100 to (Default) | 373 | 19 | 392 | 100% | 45% | 373 | 16 | 169 | (286) | 4% |
| Equity PD/LGD Method | 4,175 | - | 4,175 | 1% | 87% | 4,175 | 6,230 | 22 | (426) | 149% |
| 0,00 to <0,15 | 2,827 | - | 2,827 | 0% | 90% | 2,827 | 3,375 | 4 | (391) | 119% |
| 0,15 to <0,25 | 1,024 | - | 1,024 | 0% | 87% | 1,024 | 1,844 | 2 | - | 180% |
| 0,25 to <0,5 | 2 | - | 2 | 0% | 65% | 2 | 2 | 0 | - | 124% |
| 0,5 to <0,75 | - | - | - | - | - | - | - | - | - | 0% |
| 0,75 to <2,5 | 5 | - | 5 | 1% | 65% | 5 | 9 | 0 | - | 183% |
| 2,5 to <10 | 318 | - | 318 | 8% | 65% | 318 | 1,001 | 16 | (36) | 314% |
| 10 to <100 | - | - | - | - | - | - | - | - | - | 0% |
| 100 to (Default) | - | - | - | - | - | - | - | - | - | 0% |
| TOTAL BY CATEGORY AND OBLIGOR GRADE | 281,574 | 83,457 | 365,031 |
|
|
317,433 | 104,066 | 6,812 | (9,037) | 33% |
2014
(Million euros)
| Categories of Exposure | On balance sheet original gross exposure (1) | Off balance sheet exposure before CCF (2) | Original gross exposure (3) (1+2) | PD-TTC (%) |
LGD (%) | EAD (4) | RWA | Expected loss | Provisions | RW (%) |
|---|---|---|---|---|---|---|---|---|---|---|
| Central governments or central banks | 4,153 | 749 | 4,902 | 1% | 33% | 4,529 | 376 | 14 | (4) | 8% |
| 0,00 to <0,15 | 3,927 | 699 | 4,626 | 0% | 32% | 4,279 | 152 | 1 | (4) | 4% |
| 0,15 to <0,25 | 1 | - | 1 | 0% | 40% | 1 | 1 | 0 | (0) | 47% |
| 0,25 to <0,5 | 1 | 13 | 13 | 0% | 44% | 7 | 3 | 0 | - | 41% |
| 0,5 to <0,75 | 49 | 13 | 62 | 1% | 37% | 54 | 28 | 0 | - | 53% |
| 0,75 to <2,5 | 62 | 18 | 79 | 1% | 28% | 70 | 46 | 0 | (0) | 65% |
| 2,5 to <10 | 15 | 0 | 16 | 5% | 25% | 16 | 8 | 0 | - | 53% |
| 10 to <100 | 51 | 5 | 56 | 13% | 54% | 54 | 132 | 4 | - | 246% |
| 100 to (Default) | 47 | 2 | 49 | 100% | 19% | 48 | 6 | 9 | (0) | 13% |
|
|
|
|
|
|
|
|
|
|
|
|
| Institutions | 105,642 | 6,338 | 111,981 | 0% | 17% | 109,494 | 12,425 | 181 | (78) | 11% |
| 0,00 to <0,15 | 75,118 | 3,172 | 78,289 | 0% | 16% | 76,874 | 4,806 | 8 | (11) | 6% |
| 0,15 to <0,25 | 9,045 | 1,398 | 10,443 | 0% | 14% | 10,202 | 1,603 | 3 | (7) | 16% |
| 0,25 to <0,5 | 13,549 | 1,062 | 14,611 | 0% | 19% | 14,119 | 2,854 | 8 | (2) | 20% |
| 0,5 to <0,75 | 3,871 | 486 | 4,357 | 1% | 16% | 4,114 | 1,037 | 3 | (2) | 25% |
| 0,75 to <2,5 | 1,789 | 145 | 1,934 | 1% | 13% | 1,876 | 567 | 3 | (1) | 30% |
| 2,5 to <10 | 1,634 | 57 | 1,691 | 5% | 12% | 1,663 | 624 | 10 | (9) | 38% |
| 10 to <100 | 425 | 4 | 429 | 21% | 38% | 427 | 892 | 33 | (2) | 209% |
| 100 to (Default) | 213 | 14 | 227 | 100% | 51% | 220 | 42 | 113 | (44) | 19% |
| Corporates | 75,120 | 53,389 | 128,508 | 12% | 36% | 102,682 | 60,998 | 4,700 | (6,700) | 59% |
| Of which: SMEs | 15,623 | 2,732 | 18,356 | 39% | 45% | 16,890 | 11,084 | 3,076 | (3,761) | 66% |
| 0,00 to <0,15 | 569 | 459 | 1,028 | 0% | 49% | 788 | 203 | 0 | (1) | 26% |
| 0,15 to <0,25 | 351 | 217 | 567 | 0% | 50% | 445 | 161 | 0 | (1) | 36% |
| 0,25 to <0,5 | 667 | 294 | 961 | 0% | 50% | 794 | 365 | 1 | (2) | 46% |
| 0,5 to <0,75 | 901 | 340 | 1,241 | 0% | 50% | 1,054 | 620 | 3 | (2) | 59% |
| 0,75 to <2,5 | 2,403 | 611 | 3,014 | 1% | 46% | 2,702 | 2,127 | 14 | (25) | 79% |
| 2,5 to <10 | 4,125 | 502 | 4,628 | 5% | 38% | 4,366 | 4,665 | 83 | (269) | 107% |
| 10 to <100 | 441 | 26 | 467 | 17% | 39% | 454 | 754 | 29 | (97) | 166% |
| 100 to (Default) | 6,166 | 283 | 6,449 | 100% | 47% | 6,289 | 2,190 | 2,944 | (3,365) | 35% |
| Of which: Other | 48,402 | 48,809 | 97,211 | 6% | 40% | 73,596 | 39,394 | 1,625 | (2,680) | 54% |
| 0,00 to <0,15 | 12,537 | 24,680 | 37,217 | 0% | 41% | 25,082 | 6,652 | 7 | (20) | 27% |
| 0,15 to <0,25 | 4,958 | 6,961 | 11,919 | 0% | 39% | 8,615 | 3,323 | 7 | (11) | 39% |
| 0,25 to <0,5 | 7,975 | 6,498 | 14,473 | 0% | 42% | 11,473 | 6,129 | 15 | (21) | 53% |
| 0,5 to <0,75 | 6,996 | 6,263 | 13,259 | 1% | 40% | 10,435 | 6,885 | 21 | (19) | 66% |
| 0,75 to <2,5 | 5,763 | 2,335 | 8,098 | 1% | 36% | 6,864 | 5,802 | 29 | (49) | 85% |
| 2,5 to <10 | 6,161 | 1,344 | 7,505 | 5% | 37% | 6,757 | 8,239 | 123 | (355) | 122% |
| 10 to <100 | 498 | 324 | 822 | 16% | 40% | 682 | 1,399 | 43 | (151) | 205% |
| 100 to (Default) | 3,513 | 404 | 3,917 | 100% | 37% | 3,688 | 966 | 1,379 | (2,055) | 26% |
| Of which: specialized finance | 11,095 | 1,847 | 12,942 |
|
|
12,196 | 10,520 |
|
(259) | 86% |
| Retail | 83,698 | 12,577 | 96,276 | 6% | 28% | 86,866 | 21,059 | 1,994 | (1,620) | 24% |
| Of which: Secured by real estate SMEs | 1,062 | 4 | 1,066 | 21% | 21% | 1,063 | 321 | 54 | (45) | 30% |
| 0,00 to <0,15 | 391 | - | 391 | 0% | 18% | 391 | 12 | 0 | (0) | 3% |
| 0,15 to <0,25 | 63 | 3 | 66 | 0% | 20% | 63 | 5 | 0 | (0) | 9% |
| 0,25 to <0,5 | 67 | 0 | 67 | 0% | 23% | 67 | 9 | 0 | (0) | 14% |
| 0,5 to <0,75 | 73 | 0 | 73 | 1% | 19% | 73 | 12 | 0 | (0) | 16% |
| 0,75 to <2,5 | 86 | 0 | 86 | 1% | 24% | 86 | 29 | 0 | (0) | 34% |
| 2,5 to <10 | 118 | 0 | 118 | 5% | 25% | 118 | 104 | 1 | (2) | 88% |
| 10 to <100 | 65 | - | 65 | 21% | 28% | 65 | 107 | 4 | (2) | 166% |
| 100 to (Default) | 200 | - | 200 | 100% | 24% | 200 | 42 | 49 | (40) | 21% |
| Of which: Secured by real estate non-SMEs | 68,818 | 229 | 69,047 | 6% | 19% | 68,830 | 10,099 | 981 | (676) | 15% |
| 0,00 to <0,15 | 46,991 | 190 | 47,181 | 0% | 17% | 47,001 | 1,159 | 5 | (34) | 2% |
| 0,15 to <0,25 | 2,960 | 9 | 2,969 | 0% | 22% | 2,960 | 274 | 1 | (2) | 9% |
| 0,25 to <0,5 | 2,721 | 10 | 2,731 | 0% | 24% | 2,722 | 391 | 2 | (2) | 14% |
| 0,5 to <0,75 | 2,358 | 7 | 2,364 | 1% | 22% | 2,358 | 438 | 3 | (2) | 19% |
| 0,75 to <2,5 | 4,227 | 10 | 4,237 | 1% | 22% | 4,227 | 1,344 | 11 | (13) | 32% |
| 2,5 to <10 | 4,759 | 2 | 4,762 | 5% | 23% | 4,759 | 3,640 | 53 | (58) | 76% |
| 10 to <100 | 1,429 | 0 | 1,429 | 19% | 26% | 1,429 | 2,136 | 70 | (26) | 150% |
| 100 to (Default) | 3,373 | - | 3,373 | 100% | 25% | 3,373 | 716 | 836 | (538) | 21% |
| Of which: Eligible revolving | 6,377 | 11,566 | 17,943 | 7% | 76% | 9,134 | 7,203 | 504 | (516) | 79% |
| 0,00 to <0,15 | 529 | 2,462 | 2,990 | 0% | 42% | 1,326 | 20 | 0 | (1) | 1% |
| 0,15 to <0,25 | 11 | 29 | 40 | 0% | 48% | 21 | 1 | 0 | (0) | 6% |
| 0,25 to <0,5 | 298 | 883 | 1,181 | 0% | 74% | 431 | 57 | 1 | (1) | 13% |
| 0,5 to <0,75 | 365 | 1,514 | 1,879 | 1% | 78% | 565 | 112 | 2 | (2) | 20% |
| 0,75 to <2,5 | 1,107 | 2,558 | 3,664 | 1% | 80% | 1,620 | 605 | 15 | (14) | 37% |
| 2,5 to <10 | 3,092 | 3,633 | 6,725 | 5% | 84% | 4,071 | 4,273 | 166 | (155) | 105% |
| 10 to <100 | 803 | 489 | 1,292 | 24% | 80% | 927 | 2,050 | 178 | (202) | 221% |
| 100 to (Default) | 172 | 0 | 172 | 100% | 82% | 172 | 86 | 141 | (140) | 50% |
| Of which: Other SMEs | 1,578 | 519 | 2,097 | 12% | 59% | 1,896 | 965 | 161 | (100) | 51% |
| 0,00 to <0,15 | 20 | 15 | 36 | 0% | 53% | 29 | 4 | 0 | (0) | 13% |
| 0,15 to <0,25 | 35 | 32 | 67 | 0% | 55% | 55 | 10 | 0 | (0) | 19% |
| 0,25 to <0,5 | 83 | 57 | 140 | 0% | 56% | 117 | 30 | 0 | (0) | 26% |
| 0,5 to <0,75 | 152 | 70 | 222 | 0% | 57% | 194 | 68 | - | (0) | 35% |
| 0,75 to <2,5 | 476 | 176 | 652 | 1% | 57% | 584 | 306 | 4 | (2) | 52% |
| 2,5 to <10 | 612 | 161 | 773 | 5% | 58% | 715 | 498 | 20 | (10) | 70% |
| 10 to <100 | 27 | 5 | 32 | 18% | 60% | 30 | 31 | 3 | (2) | 101% |
| 100 to (Default) | 172 | 3 | 174 | 100% | 77% | 173 | 18 | 133 | (85) | 11% |
| Of which: Other non-SMEs | 5,863 | 259 | 6,123 | 8% | 51% | 5,943 | 2,471 | 294 | (284) | 42% |
| 0,00 to <0,15 | 2,054 | 117 | 2,171 | 0% | 49% | 2,060 | 162 | 1 | (4) | 8% |
| 0,15 to <0,25 | 217 | 6 | 224 | 0% | 58% | 220 | 54 | 0 | (1) | 25% |
| 0,25 to <0,5 | 288 | 17 | 305 | 0% | 57% | 295 | 98 | 1 | (1) | 33% |
| 0,5 to <0,75 | 328 | 21 | 349 | 1% | 59% | 340 | 160 | 1 | (1) | 47% |
| 0,75 to <2,5 | 698 | 44 | 742 | 1% | 54% | 722 | 458 | 5 | (4) | 63% |
| 2,5 to <10 | 1,700 | 50 | 1,750 | 5% | 46% | 1,726 | 1,247 | 39 | (19) | 72% |
| 10 to <100 | 230 | 3 | 233 | 21% | 52% | 230 | 272 | 25 | (17) | 118% |
| 100 to (Default) | 349 | 0 | 349 | 100% | 64% | 350 | 19 | 223 | (238) | 5% |
| Equity PD/LGD Method | 6,462 | - | 6,462 | 1% | 88% | 6,462 | 10,417 | 11 | 1,373 | 161% |
| 0,00 to <0,15 | 2,982 | - | 2,982 | 0% | 90% | 2,982 | 3,575 | 1 | (272) | 120% |
| 0,15 to <0,25 | 3,022 | - | 3,022 | 0% | 90% | 3,022 | 5,694 | 5 | 1,481 | 188% |
| 0,25 to <0,5 | 12 | - | 12 | 0% | 65% | 12 | 15 | 0 | 39 | 124% |
| 0,5 to <0,75 | 40 | - | 40 | 1% | 65% | 40 | 62 | - | - | 152% |
| 0,75 to <2,5 | 77 | - | 77 | 1% | 65% | 77 | 144 | 0 | - | 186% |
| 2,5 to <10 | 236 | - | 236 | 3% | 65% | 236 | 556 | 5 | 146 | 236% |
| 10 to <100 | 93 | - | 93 | 38% | 65% | 93 | 370 | - | (22) | 400% |
| 100 to (Default) | - | - | - | - | - | - | - | - | - | 0% |
| TOTAL BY CATEGORY AND OBLIGOR GRADE | 275,075 | 73,054 | 348,129 | 6% | 28% | 310,032 | 105,275 | 6,901 | (7,029) | 34% |
The information contained in the above tables is set out below in graphic format:
Chart 5. Advanced measurement approach. EAD by obligor category
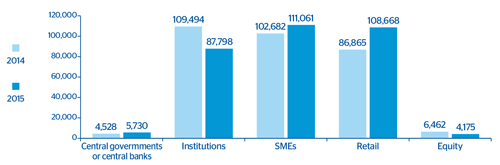
Chart 6. Advanced measurement approach. Weighted average PD by EAD

Chart 7. Advanced measurement approach. Weighted average DLGD by EAD
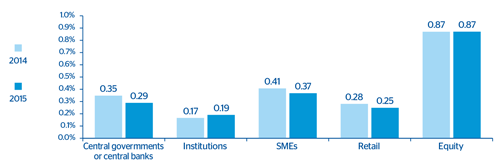
Chart 8. Advanced measurement approach. Weighted average risk by EAD

The following table presents the main variations in the year in terms of RWAs for the Credit Risk advanced measurement approach:
Table 26. Variations in the period in terms of RWAs for the Credit Risk advanced measurement approach
(Million euros)
| Credit Risk (IRB) | ||
|---|---|---|
| RWAs Dec 14 |
|
94,858 |
| Effects | Asset size | 404 |
| Model updates | 2,480 | |
| Foreign exchange movements | 79 | |
| Others | 16 | |
| RWAs Dec 15 |
|
97,837 |
- Asset size: Net effect of the acquisition of Catalunya Banc, growth in Mexico and sluggish activity in the Spanish market.
- Model updating: Mainly a result of the transfer of the portfolio from the merged company Unnim to advanced models and the recalibration of parameters in Mexico.
3.2.5.3. Comparative analysis of the estimates made
The following charts compare the expected loss adjusted to the cycle calculated according to the Group’s core internal models approved by the supervisor, with the effective loss incurred between 2001 and 2015. They also present the average effective loss between 2001 and 2015 in accordance with the following:
- Expected loss calculated with the internal models calibrated to 2015, and adjusted to the economic cycle (light green line), i.e. the annual average expected loss in an economic cycle.
- Observed loss (light blue dotted line) calculated as the ratio of gross additions to NPA over the average observed exposure multiplied by the estimated point in time severity.
- Average loss (2001-2015), which is the average of effective losses for each year (light blue solid line).
The effective loss is the annual loss incurred. It must be less than the expected loss adjusted to the cycle in the best years of an economic cycle, and greater during years of crisis.
The comparison has been made for the portfolios of Mortgages, Consumer Finance Credit Cards and (2004-2015) Autos (retail) and SMEs and Developers (2009-2015), all of them in S&P. In Mexico, the comparison has been carried out for the Credit Card portfolio (2005-2015 window) and SMEs and Large Companies (2005-2015 window).
Regarding the categories of Institutions (Public and Financial Institutions) and Corporate, historical experience shows that there is such a small number of defaulted exposures (Low Default Portfolios) that it is not statistically significant, and hence the reason the comparison is not shown.
The charts show that during the years of biggest economic growth, in general the effective loss was significantly lower than the expected loss adjusted to the cycle calculated using internal models.
The contrary was the case after the start of the crisis This is in line with the major economic slowdown and the financial difficulties of households and companies, above all in the case of companies dedicated to development and construction.
The fact that in some portfolios the average observed loss is greater than the estimated loss is coherent with the fact that the observed time window may be worse than what would be expected in a complete economic cycle. In fact, this window has fewer expansive years (6) than crisis years (9). This is not representative of a complete economic cycle.
Retail Mortgages
Starting in 2007, the effective losses are above the expected loss adjusted to the cycle, as they are losses incurred in years of crisis. The effective losses are slightly greater than the cycle-adjusted figures given the sampled number of years entailing more years of crisis than growth.
Chart 9. Comparative analysis of expected loss: Retail mortgages

Consumer finance
Chart 10. Comparative analysis of expected loss: Consumer finance
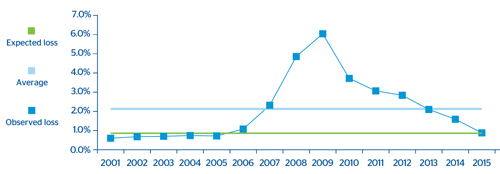
The chart shows that during the years of biggest economic growth the effective loss was lower than the expected loss adjusted to the cycle calculated using internal models. The contrary was the case starting in 2007. This is in line with the major economic slowdown and the financial difficulties of households.
Credit cards
As in the case of Mortgages and Consumer Finance, the observed loss is lower than the Expected Loss adjusted to the cycle calculated using internal models at best periods of the cycle, and higher during its worst periods.
Chart 11. Comparative analysis of expected loss: Credit cards
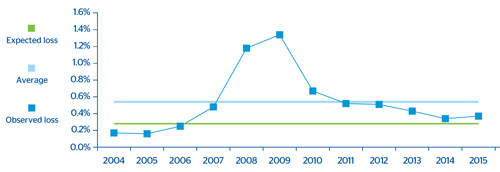
Automobiles
In this case the expected loss adjusted to the cycle continues to be higher than the average effective losses for the last 14 years, which suggests the conservative nature of the estimate.
Chart 12. Comparative analysis of expected loss: Automobiles
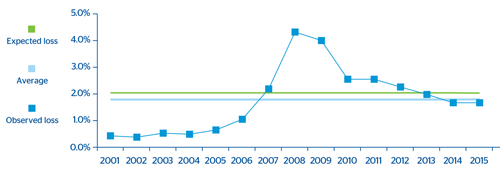
SMEs and Developers:
Once again it can be seen that during the years of biggest economic growth the effective loss is lower than the expected loss adjusted to the cycle calculated using internal models. The contrary was the case starting in 2007. The great difficulties faced by companies, particularly those engaged in development and construction businesses, are reflected in an observed loss higher than the loss adjusted to the cycle estimated by the internal models.
The expected loss adjusted to the cycle is lower than the average effective losses for the last 13 years, which is consistent with the fact that the observed window is worse than what would be expected over a complete economic cycle (more years of crisis than of economic boom).
Chart 13. Comparative analysis of expected loss: SMEs and developers
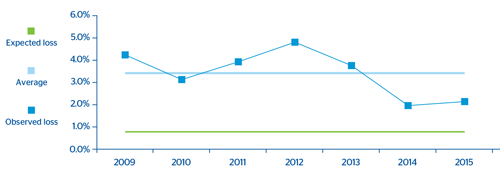
The PD series is shown below for these very same portfolios, with the data from 2002 to 2015. Similar to the remaining portfolios, the observed series is much lower than the one adjusted to the cycle until 2007, calculated with the internal models in the best moments of the cycle, and greater during the lowest moments.
Chart 14. Comparative analysis of expected loss: SMEs and developers PD
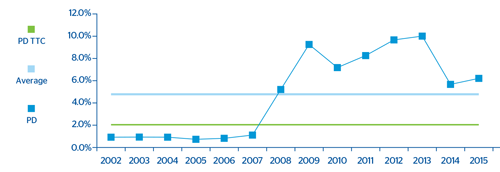
Mexico Credit Cards
In the case of Bancomer’s credit card portfolio we can see how the average Expected Loss for the cycle calculated using internal models is below the average observed losses. The reason is the use of an observation window which is unrepresentative of a complete economic cycle (the estimate would include comparatively more years of crisis than of economic growth).
Chart 15. Comparative analysis of expected loss: Mexico Credit cards
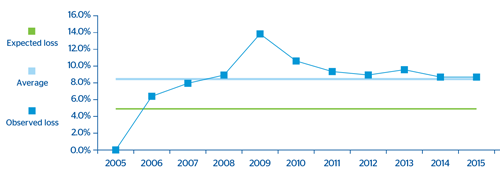
Mexico Corporates
In the case of Bancomer’s company portfolio we can see how the average Expected Loss for the cycle calculated using internal models is below the average observed losses. The reason is the use of an observation window which is unrepresentative of a complete economic cycle (the estimate would include comparatively more years of crisis than of economic growth).
Chart 16. Comparative analysis of expected and incurred loss: Mexico Corporates
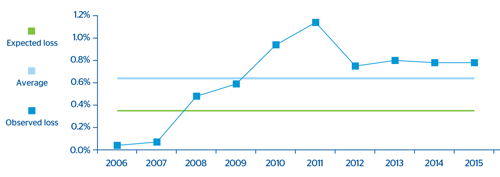
3.2.5.3.1. Impairment losses (IRB)
The table below shows the balance of specific, generic and country risk allowances for losses, by exposure categories, as of December 31, 2015 and 2014.
Table 27. Balance of specific, generic and country risk allowances for losses, by exposure category
(Million euros)
| Category of exposure | Loan-loss provisions | |
|---|---|---|
|
|
2015 | 2014 |
| Central governments or central banks | 19 | 4 |
| Institutions | 106 | 78 |
| Corporates | 5,976 | 6,711 |
| Retail | 2,510 | 1,620 |
| Of which: Secured by real estate collateral | 1,533 | 721 |
| Of which: Qualifying revolving retail | 462 | 516 |
| Of which: Other retail assets | 515 | 384 |
| TOTAL | 8,611 | 8,413 |
3.2.5.4. Weightings of specialized lending exposures
The solvency regulation stipulates that the consideration of specialized lending companies is to apply to legal entities with the following characteristics:
- The exposure is to an entity created specifically to finance and/or operate physical assets.
- The contractual arrangements give the lender a substantial degree of control over the assets and income they generate.
- The primary source of repayment of the obligation is the income generated by the assets being financed, rather than the independent capacity of the borrower.
The following table presents the exposures assigned to each one of the risk weightings of the specialized lending exposures as of December 31, 2015 and 2014:
Table 28. Exposures assigned to each one of the risk weightings of the specialized lending exposures
(Million euros)
| Risk weighting | Scale | Original Exposure (1) | |
|---|---|---|---|
|
|
|
2015 | 2014 |
| 1 | 50% | 0 | 0 |
| 70% | 6,419 | 6,158 | |
| 2 | 70% |
|
0 |
| 90% | 3,640 | 4,530 | |
| 3 | 115% | 1,449 | 1,310 |
| 4 | 250% | 512 | 488 |
| 5 | 0% | 460 | 457 |
| TOTAL |
|
12,480 | 12,942 |
3.2.5.5. Risk weightings of equity exposures
The following table presents the exposures assigned to each one of the risk weightings of equity exposures as of December 31, 2015 and 2014.
Table 29. Exposures assigned to each one of the risk weightings of the equity exposures
(Million euros)
| Risk weighting | Original exposure | |
|---|---|---|
|
|
2015 | 2014 |
| Risk weighting, Simple Method | 4,853 | 3,980 |
| 190% | 598 | 479 |
| 250% | 3,915 | 3,266 |
| 290% | 236 | 134 |
| 370% | 105 | 102 |
| PD/LGD Method | 4,175 | 6,462 |
| AA | 0 | 0 |
| AA- | 0 | 0 |
| A | 0 | 0 |
| A- | 0 | 0 |
| BBB+ | 2,827 | 2,982 |
| BBB | 1,024 | 3,022 |
| BBB- | 2 | 12 |
| BB+ | 0 | 40 |
| BB | 5 | 77 |
| BB- | 0 | 0 |
| B+ | 0 | 233 |
| B | 3 | 3 |
| B- | 316 | 0 |
| C | 0 | 93 |
| Internal Models Method | 390 | 254 |
| TOTAL | 9,418 | 10,696 |
3.2.6. Information on counterparty risk
Counterparty exposure involves that part of the original exposure corresponding to derivative instruments, repurchase and resale transactions, securities or commodities lending or borrowing transactions and deferred settlement transactions.
The following chart illustrates the amount in terms of EAD of the counterparty risk, broken down by product and risk:
Table 30. Counterparty risk. EAD derivatives by product and risk
2015
(Million euros)
| Products | Currency risk |
Interet rate risk |
Equity risk |
Commodity risk |
Credit risk |
Other risks |
TOTAL |
|---|---|---|---|---|---|---|---|
| Term operations | 4,070 | 2 | 7 | 0 | 0 | 0 | 4,079 |
| FRAs | 0 | 8 | 0 | 0 | 0 | 0 | 8 |
| Swaps | 0 | 20,016 | 36 | 0 | 0 | 0 | 20,051 |
| Options | 395 | 2,624 | 1,186 | 1 | 0 | 0 | 4,205 |
| Other products | 0 | 0 | 0 | 0 | 734 | 0 | 734 |
| TOTAL | 4,465 | 22,649 | 1,229 | 1 | 734 | 0 | 29,078 |
2014
(Million euros)
| Products | Currency risk |
Interet rate risk |
Equity risk |
Commodity risk |
Credit risk |
Other risks |
TOTAL |
|---|---|---|---|---|---|---|---|
| Term operations | 5,479 | 0 | 9 | 0 | 0 | 0 | 5,489 |
| FRAs | 0 | 1 | 0 | 0 | 0 | 0 | 1 |
| Swaps | 0 | 16,904 | 90 | 0 | 0 | 0 | 16,994 |
| Options | 149 | 2,282 | 991 | 1 | 0 | 0 | 3,423 |
| Other products | 0 | 0 | 0 | 0 | 316 | 0 | 316 |
| TOTAL | 5,629 | 19,187 | 1,090 | 1 | 316 | 0 | 26,223 |
Chart 17. Derivative's EAD broken down by risk
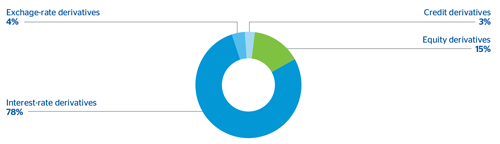
3.2.6.1. Policies on managing counterparty risk
3.2.6.1.1. Methodology: allocation of internal capital and limits to exposures subject to counterparty risk
The Group has an economic model for calculating internal capital through exposure to counterparty risk in treasury operations. This model has been implemented in the Risk unit systems in Market areas. It is used to measure the credit exposures for each of the counterparties for which the entity operates.
The generation of exposures is undertaken in a manner that is consistent with those used for the monitoring and control of credit risk limits. The time horizon is divided up into intervals, and the market risk factors (interest rates, exchange rates, etc.) underlying the instruments that determine their valuation are simulated for each interval.
The exposures are generated from 500 different scenarios using the Monte Carlo method for risk factors (subject to counterparty risk) and applying the corresponding mitigating factors to each counterparty (i.e. applying collateral and/or netting agreements as applicable).
The correlations, loss given defaults, internal ratings and associated probabilities of default are consistent with the Group’s economic model for general credit risk.
The capital for each counterparty is then calculated using the exposure profile and taking into account the analytical formula adopted by Basel. This figure is modified by an adjustment factor for the possible maturity subsequent to one year of the operations in a similar vein to the general approach adopted by Basel for the treatment of credit risk.
Counterparty limits are specified within the financial programs authorized for each subsidiary within the line item of treasury limits. It stipulates both the limit and the maximum term for the operation.
The use of transactions within the limits is measured in terms of mark-to-market valuation plus the potential risk using the Monte Carlo Simulation methodology (95% confidence level) and bearing in mind possible mitigating factors (such as netting, break clauses or collateral contracts).
Management of consumption by lines in the Markets area is carried out through a corporate platform that enables online monitoring of the limits and availabilities established for the different counterparties and clients. This control is completed by independent units of the business area to guarantee proper segregation of functions.
3.2.6.1.2. Policies for ensuring the effectiveness of collaterals and establishing the value adjustments for impairment to cover this risk
The Group has subscribed collateral contracts with many of its counterparties that serve as a guarantee of the mark-to-market valuation of derivatives operations. The collateral consists mostly of deposits, which means that no situations of impairment are forthcoming.
The MENTOR tool has been specifically designed to store and process the collateral contracts concluded with counterparties. This application enables the existence of collateral to be taken into account at the transaction level (useful for controlling and monitoring the status of specific operations) as well as at the counterparty level. Furthermore, said tool feeds the applications responsible for estimating counterparty risk by providing all the necessary parameters for considering the impact of mitigation in the portfolio due to the agreements signed.
Likewise, there is also an application that reconciles and adjusts the positions serving the Collateral and Risks units.
In order to guarantee the effectiveness of collateral contracts, the Group carries out a daily monitoring of the market values of the operations governed by such contracts and of the deposits made by the counterparties. Once the amount of the collateral to be delivered or received is obtained, the collateral demand (margin call), or the demand received, is carried out at the intervals established in the contract, usually daily.
If significant variations arise from the process of reconciliation between the counterparties, after a reconciliation in economic terms they are reported by the Collateral unit to the Risks unit for subsequent analysis and monitoring. Within the control process, the Collateral unit issues a daily report on the guarantees which includes a description by counterparty of the exposure and collateral, making special reference to those guarantee deficits at or beyond the set warning levels.
Financial assets and liabilities may be the object of netting, in other words presentation for a net amount in the balance sheet, only when the Group’s entities comply with the provisions of IAS 32 - Paragraph 42, and thus have the legally obliged right to offset the amounts recognized, and the intention to settle the net amount or to divest the asset and pay the liability at the same time.
In addition, the Group has assets and liabilities on the balance sheet that are not netted and for which there are master netting agreements, but for which there is neither the intention nor the right to settle. The most common types of events that trigger netting of reciprocal obligations include the bankruptcy of the credit institution in question, swiftly accumulating indebtedness, default, restructuring or the winding up of the entity.
In the current market context, derivatives are contracted under different framework contracts, with the most general being those developed by International Swaps and Derivatives Association (ISDA), and for the Spanish market the Framework Financial Operations Contract (FAFT). Practically all portfolio derivative operations have been concluded under these master contracts, including in them the netting clauses referred to in the above point as Master Netting Agreements, considerably reducing the credit exposure in these instruments. In addition, in the contracts concluded with professional counterparties, annexes are included with collateral agreements called Credit Support Annexes (CSA), thus minimizing exposure to a possible counterparty insolvency.
At the same time, in repurchase agreements the volume traded has increased strongly through clearing houses that use mechanisms to reduce counterparty risk, as well as through various master contracts in bilateral operations, the most common being the Global Master Repurchase Agreement (GMRA), which is published by the International Capital Market Association (ICMA). This tends to have clauses added relating to the exchange of collateral within the main body of the master contract itself.
The following summary table presents the potential effects of netting and collateral agreements in derivative operations as of December 31, 2015:
Table 31. Assets and liabilities subject to contractual netting rights
2015
(Million euros)
|
|
|
|
|
Non-offsetted gross amount |
|
|
|---|---|---|---|---|---|---|
| Offsetting of financial instruments | Gross Recognized Amount (A) |
Offsetted balance sheet amounte (B) |
Net amount presented on balance sheet (C=A-B) |
Amount related to recognized financial instruments |
Collateral (including cash) |
Net amount (E=C-D) |
| Assets |
|
|
|
|
|
|
| Trading and hedging derivatives | 54,480 | 7,805 | 46,675 | 30,350 | 5,493 | 10,832 |
| Repurchase agreement (Repos) | 21,063 | 4,596 | 16,467 | 17,625 | 24 | –1,182 |
| Total assets | 75,543 | 12,401 | 63,142 | 47,975 | 5,517 | 9,650 |
| Liabilities |
|
|
|
|
|
|
| Trading and hedging derivatives | 54,267 | 8,423 | 45,844 | 30,350 | 9,830 | 5,664 |
| Repurchase agreement (Repos) | 72,947 | 4,596 | 68,351 | 68,783 | 114 | –545 |
| Total liabilities | 127,214 | 13,019 | 114,196 | 99,133 | 9,944 | 5,119 |
3.2.6.1.3. Policies regarding the risk of adverse effects occurring due to correlations
Derivatives contracts may give rise to potential adverse correlation effects between the exposure to the counterparty and its credit quality me (wrong-way-exposures). The Group has strict policies on the treatment of exposures of this nature. First, they follow specific admission processes for each individual operation, and second, they can compute the effects of risk, not for the potential value of the exposure, but for 100% of its nominal value depending on the type of operation.
3.2.6.1.4. Impact of collaterals in the event of a downgrade in their credit rating
Regarding derivatives operations, as a general policy, the Group does not subscribe collateral contracts that involve an increase in the amount to be deposited in the event of the Group being downgraded.
The general criterion applied to date with banking counterparties is to establish a zero threshold within collateral contracts, irrespective of the mutual rating; provision will be made as collateral of any difference that arises through mark-to-market valuation.
3.2.6.2. Amounts of counterparty risk
The original exposure for the counterparty risk of derivatives, according to Chapter 6 of the CRR, can be calculated using the following methods: original risk, mark-tomarket valuation, standardized and internal models.
The Group calculates the value of exposure to risk through the mark-to-market method, obtained as the aggregate of the positive mark-to-market value after contractual netting agreements plus the potential future risk of each transaction or instrument.
Below is a breakdown of the amount in terms of original exposure, EAD and RWAs:
Table 32. Position subject to counterparty risk in the trading book
2015
(Million euros)
|
|
2015 | ||||||||
|---|---|---|---|---|---|---|---|---|---|
|
|
Securities financing transactions | Derivatives and transactions with deferred settlement | From contractual netting between products | ||||||
| Exposure categories and risk types | OE | EAD | RWAs | OE | EAD | RWAs | OE | EAD | RWAs |
| Central governments or central banks | 12,544 | 5,980 | 181 | 51 | 51 | 20 | 203 | 203 | 5 |
| Regional governments or local authorities | 0 | 0 | - | 17 | 17 | 3 | 48 | 48 | 10 |
| Public sector entities | - | - | - | 1 | 1 | 0 | 19 | 19 | 19 |
| Multilateral Development Banks | - | - | - | - | - | - | - | - | - |
| Institutions | 860 | 755 | 113 | 4,764 | 4,764 | 1,103 | 4,233 | 1,603 | 544 |
| Corporates | 25 | 10 | 10 | 1,356 | 1,356 | 1,352 | 1,305 | 1,305 | 1,073 |
| Retail | - | - | - | 18 | 18 | 12 | 34 | 32 | 20 |
| Secured by mortgages on immovable property | - | - | - | - | - | - | - | - | - |
| Exposures in default | - | - | - | 0 | 0 | 0 | 8 | 3 | 5 |
| Items associated with particularly high risk | - | - | - | - | - | - | - | - | - |
| Covered bonds | - | - | - | - | - | - | - | - | - |
| Short-term claims on institutions and corporate | - | - | - | - | - | - | - | - | - |
| Collective investments undertakings (CIU) | 175 | 47 | 10 | 0 | 0 | 0 | 16 | 0 | 0 |
| Other exposures | 69 | 69 | 68 | 0 | 0 | 0 | 7 | 7 | 7 |
| Total credit risk by the standardized approach | 13,672 | 6,860 | 382 | 6,207 | 6,207 | 2,492 | 5,872 | 3,219 | 1,681 |
| Central governments or central banks | - | - | - | 1 | 1 | 0 | 24 | 24 | 4 |
| Institutions | 35,063 | 35,063 | 627 | 3,553 | 3,553 | 1,012 | 12,379 | 12,379 | 1,308 |
| Corporates | - | - | - | 862 | 862 | 533 | 2,825 | 2,825 | 2,010 |
| Of which: SMEs | - | - | - | 46 | 46 | 36 | 117 | 117 | 109 |
| Of which: companies of specialized finance | - | - | - | 356 | 356 | 294 | 1,344 | 1,344 | 1,259 |
| Of which: other | - | - | - | 460 | 460 | 203 | 1,365 | 1,365 | 642 |
| Retail | - | - | - | 3 | 3 | 1 | 5 | 5 | 2 |
| Of which: Secured by real estate collateral | - | - | - | - | - | - | - | - | - |
| Of which: Qualifying revolving retail | - | - | - | - | - | - | - | - | - |
| Of which: Other retail assets | - | - | - | 3 | 3 | 1 | 5 | 5 | 2 |
| Other corporates: SMEs | - | - | - | 3 | 3 | 1 | 5 | 5 | 2 |
| Other corporates: No SMEs | - | - | - | 0 | 0 | 0 | 0 | 0 | 0 |
| Total credit risk by the advanced measurement approach | 35,063 | 35,063 | 627 | 4,418 | 4,418 | 1,547 | 15,233 | 15,233 | 3,324 |
| TOTAL CREDIT RISK | 48,735 | 41,923 | 1,009 | 10,626 | 10,626 | 4,039 | 21,105 | 18,452 | 5,006 |
The amounts shown in the table above on credit risk include the counterparty risk in trading-book activity as shown below:
Table 33. Amounts of counterparty risk in the trading book
(Million euros)
|
|
Capital amount | |
|---|---|---|
| Counterparty Risk Trading Book Activities |
2015 | 2014 |
| Standardized Approach | 330 | 233 |
| Advanced Measurement Approach | 382 | 391 |
| TOTAL | 712 | 624 |
The Group currently has a totally residual amount of capital requirements for trading-book activity liquidation risk.
There follows a specification of the amounts in million euros involved in the counterparty risk of derivatives as at December 31, 2015 and 2014:
Table 34. Counterparty risk. Exposure in derivatives. Netting effect and collateral
(Million euros)
| Derivatives exposure. Netting effect and collateral | 2015 | 2014 |
|---|---|---|
| Gross positive fair value of the contracts (accounting perimeter) | 44,439 | 46,780 |
| Gross positive fair value of the contracts (solvency perimeter) | 46,675 | 48,911 |
| Add-on | 14,523 | 22,779 |
| Positive effects of netting agreements | –32,120 | –45,467 |
| Credit exposure after netting and before collateral assigned | 29,078 | 26,223 |
| Collateral assigned | –3,524 | –5,356 |
| Credit exposure in derivatives after netting and before collateral assigned | 25,553 | 20,867 |
| RWAs | 9,045 | 7,799 |
The total exposure to counterparty risk, composed basically of repo transactions and OTC derivatives, is €80,465 million and €93,506 million, as of December 31, 2015 and 2014, respectively (after applying any netting agreements applicable).
3.2.6.2.1. Credit derivative transactions
The table below shows the amounts corresponding to transactions with credit derivatives used in intermediation activities:
Table 35. Counterparty risk. Transactions with credit derivatives used in intermediation activities
2015
(Million euros)
| Classification of derivatives | Total notional amount of the transactions |
Types of Derivatives | |||
|---|---|---|---|---|---|
|
|
|
(CDS) on individual names |
On indexes (CDSI) |
Nth to default baskets |
Derivatives on tranches (CDO) |
| Protection purchased | 15,180 | 6,651 | 8,184 | 205 | 140 |
| Protection sold | 15,522 | 6,869 | 8,508 | 0 | 145 |
2014
(Million euros)
| Classification of derivatives | Total notional amount of the transactions |
Types of Derivatives | |||
|---|---|---|---|---|---|
|
|
|
(CDS) on individual names |
On indexes (CDSI) |
Nth to default baskets |
Derivatives on tranches (CDO) |
| Protection purchased | 22,843 | 7,817 | 14,300 | 551 | 175 |
| Protection sold | 22,291 | 8,222 | 13,811 | 82 | 175 |
As of year-end 2015 and 2014, the Group did not use credit derivatives in brokerage activities as collateral.
3.2.6.3. CVA charge requirements
The capital for CVA aims to cover losses caused by changes in MtM due to changes in the CVA (accounting adjustment)
The amounts indicated below regarding the adjustments for credit risks are listed in millions of euros as of December 31, 2015 and 2014:
Table 36. Credit risk. Capital requirements by Credit Valuation Adjustments (CVA)
2015
|
|
EAD after CRM |
RWA |
|---|---|---|
| Total portfolios subject to capital requirement by Advanced CVA | - | - |
| (i) VaR component (included multiplied x3) | - | - |
| (ii) Stressed VaR component (included multiplied x3) | - | - |
| Total portfolios subject to capital requirement by Standarized CVA | 12,993 | 3,833 |
| Total subject to capital requirement by CVA | 12,993 | 3,833 |
2014
|
|
EAD after CRM |
RWA |
|---|---|---|
| Total portfolios subject to capital requirement by Advanced CVA | – | – |
| (i) VaR component (included multiplied x3) | – | – |
| (ii) Stressed VaR component (included multiplied x3) | – | – |
| Total portfolios subject to capital requirement by Standarized CVA | 14,160 | 5,960 |
| Total subject to capital requirement by CVA | 14,160 | 5,960 |
Below are the variations in terms of RWAs during the period:
Table 37. Variations in terms of RWAs of CVA
(Million euros)
|
|
CVA |
|
|---|---|---|
| RWA’s Dec 14 |
|
5,960 |
| Effects | Asset size | –2,127 |
| RWA’s Dec 15 |
|
3,833 |
3.2.7. Information on securitizations
3.2.7.1. General characteristics of securitizations
3.2.7.1.1. Purpose of securitization
The Group’s current policy on securitization considers a program of recurrent issue, with a deliberate diversification of securitized assets that adjusts their volume to the Bank’s capital requirements and to market conditions.
This program is complemented by all the other finance and equity instruments, thereby diversifying the need to resort to wholesale markets.
The definition of the strategy and the execution of the operations, as with all other wholesale finance and capital management, is supervised by the Assets & Liabilities Committee, with the pertinent internal authorizations obtained directly from the Board of Directors or from the Executive Committee.
The main aim of securitization is to serve as an instrument for the efficient management of the balance sheet, above all as a source of liquidity at an efficient cost, obtaining liquid assets through eligible collateral, as a complement to other financial instruments. In addition, there are other secondary objectives associated with the use of securitization instruments, such as freeing up of regulatory capital by transferring risk and the freeing of potential excess generic provisions, provided that the volume of the first-loss tranche and the ability to transfer risk allow it.
3.2.7.1.2. Functions pursued in the securitization process and degree of involvement
The Group’s degree of involvement in its securitization funds is not usually restricted to the mere role of assignor and administrator of the securitized portfolio.
Chart 18. Functions performed in the securitization process and Group's involvement level
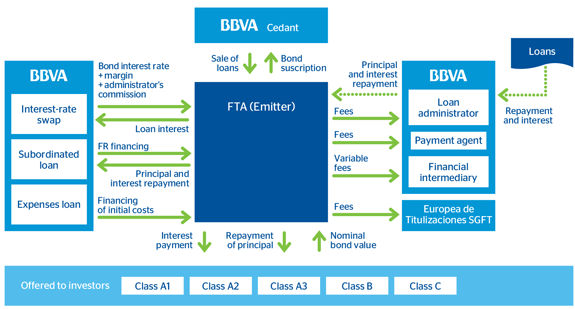
As can be seen in the above chart, the Group has usually taken additional roles such as:
- Payment Agent.
- Provider of the treasury account.
- Provider of the subordinated loan and of the loan for start-up costs, with the former being the one that finances the first-loss tranche, and the latter financing the fund’s fixed expenditure.
- Administrative agent of the securitized portfolio.
The Group has not assumed the role of sponsor of securitizations originated by thirdparty institutions.
The Group’s balance sheet maintains the first-loss tranches of all securitizations performed.
It is worth noting that the Group has maintained a consistent line in the generation of securitization operations since the credit crunch, which began in July 2007. Accordingly:
- There have been no transfers of risk through synthetic securitizations. All operations have involved traditional securitizations with simple structures in which the underlying assets were loans or financial leasing.
- It has not been involved in recurrent structures such as conduits or SIVs; instead, all of its issues have been one-offs.
3.2.7.1.3. Methods used for the calculation of risk-weighted exposures in its securitization activity
The methods used to calculate risk-weighted exposures in securitizations are:
- The standardized approach: when this method is used for fully securitized exposures, in full or in a predominant manner if it involves a mixed portfolio.
- The IRB approach: when internal models are used for securitized exposures, in full or in a predominant manner. Within the alternatives of the IRB approach, use is made of the model based on external ratings.
3.2.7.2. Risk transfer in securitization activities
A securitization fulfills the criterion of significant and effective transfer of risk, and therefore falls within the solvency framework of the securitizations, when it meets the conditions laid down in Articles 244.2 and 243.2 of the solvency regulation.
3.2.7.3. Investment or retained securitizations
The table below shows the amounts in terms of EAD of investment and retained securitization positions by type of exposure, tranches and weighting ranges corresponding to securitizations.
In the case of originated securitizations, only those in which the Group fulfills the criteria for transfer of risk as of December 31, 2015 and 2014 are included.
Investment positions as of December 31, 2015 and 2014:
Table 38. Amounts in terms of EAD of investment and retained securitization positions
2015
(Million euros)
| Security Type | Exposure Type | Tranche | EAD broken down by ECAI tranches | Total | |||||||
|---|---|---|---|---|---|---|---|---|---|---|---|
|
|
|
|
Standardized | Advanced |
|
||||||
|
|
|
|
20% | 40%; 50%; 100%; 225% 350%, 650% |
1.250% | Total Standardized | 20% | 40%; 50%; 100%; 225% 350%, 650% |
1.250% | Total Standardized |
|
| Investment | Balance-sheet exposure | Preferential | 2,450 |
|
|
2,450 | 367 |
|
|
367 | 2,817 |
|
|
|
Intermediate |
|
233 |
|
233 |
|
593 |
|
593 | 825 |
|
|
|
First-loss |
|
|
- | - |
|
|
- | - | - |
|
|
Off-balance-sheet exposure | Preferential |
|
|
|
- |
|
|
|
- | - |
|
|
|
Intermediate |
|
|
|
- |
|
|
|
- | - |
|
|
|
First-loss |
|
|
|
- |
|
|
|
- | - |
| TOTAL |
|
|
2,450 | 233 | - | 2,683 | 367 | 593 | - | 959 | 3,642 |
| Retained | Balance-sheet exposure | Preferential | 412 |
|
|
412 | - |
|
|
- | 412 |
|
|
|
Intermediate |
|
66 |
|
66 |
|
- |
|
- | 66 |
|
|
|
First-loss |
|
|
127 | 127 |
|
|
14 | 14 | 141 |
|
|
Off-balance-sheet exposure | Preferential |
|
|
|
- |
|
|
|
- | - |
|
|
|
Intermediate |
|
|
|
- |
|
|
|
- | - |
|
|
|
First-loss |
|
|
|
- |
|
|
|
- | - |
| TOTAL |
|
|
412 | 66 | 127 | 605 | - | - | 14 | 14 | 619 |
Retained positions as of December 31, 2015 and 2014:
2014
(Million euros)
| Security Type | Exposure Type | Tranche | EAD broken down by ECAI tranches | Total | |||||||
|---|---|---|---|---|---|---|---|---|---|---|---|
|
|
|
|
Standardized | Advanced |
|
||||||
|
|
|
|
20% | 40%; 50%; 100%; 225% 350%, 650% |
1.250% | Total Standardized | 20% | 40%; 50%; 100%; 225% 350%, 650% |
1.250% | Total Standardized |
|
| Investment | Balance-sheet exposure | Preferential | 2,058 | - | - | 2,058 | 63 | - | - | 63 | 2,121 |
|
|
|
Intermediate | - | 325 | - | 325 | - | 793 | - | 793 | 1,117 |
|
|
|
First-loss | - | - | - | - | - | - | - | - | - |
|
|
Off-balance-sheet exposure | Preferential | - | - | - | - | - | - | - | - | - |
|
|
|
Intermediate | - | - | - | - | - | - | - | - | - |
|
|
|
First-loss | - | - | - | - | - | - | - | - | - |
| TOTAL |
|
|
2,058 | 325 | - | 2,383 | 63 | 793 | - | 856 | 3,239 |
| Retained | Balance-sheet exposure | Preferential | 3 | - | - | 3 | 22 | - | - | 22 | 25 |
|
|
|
Intermediate | - | 45 | - | 45 | - | 0 | - | 0 | 45 |
|
|
|
First-loss | - | - | 135 | 135 | - | - | 145 | 145 | 280 |
|
|
Off-balance-sheet exposure | Preferential | - | - | - | - | - | - | - | - | - |
|
|
|
Intermediate | - | - | - | - | - | - | - | - | - |
|
|
|
First-loss | - | - | - | - | - | - | - | - | - |
| TOTAL |
|
|
3 | 45 | 135 | 183 | 22 | 0 | 145 | 167 | 351 |
Below are details of the RWAs by model, as well as the main variations during the period:
Table 39. Distribution of securitizations subject to risk weighting and deducted from capital
(Million euros)
| Securitization Risk | ||
|---|---|---|
| Category | Model | RWAs |
| 1. Subject to risk weighting | Standardized | 1,049 |
|
|
Advanced | 345 |
| Subtotal 1 |
|
1,395 |
| 2. Deducted from capital | Standardized | 994 |
|
|
Advanced | 119 |
| Subtotal 2 |
|
1,113 |
| TOTAL |
|
2,507 |
Table 40.Variations in terms of RWAs of investment and retained securitizations
(Million euros)
| Securitization Risk | ||
|---|---|---|
| RWA’s Dec 14 |
|
1,777 |
| Effects | Asset size | –382 |
| RWA’s Dec 15 |
|
1,395 |
3.2.7.4. Originated securitizations
3.2.7.4.1. Rating agencies used
The rating agencies that have been involved in the Group’s issues that fulfill the criteria of risk transfer and fall within the securitizations solvency framework are, generally, Fitch, Moody’s, S&P and DBRS.
In all the SSPEs, the agencies have assessed the risk of the entire issuance structure:
- Awarding ratings to all bond tranches.
- Establishing the volume of the credit enhancement.
- Establishing the necessary triggers (early termination of the restitution period, prorata amortization of AAA classes, pro-rata amortization of series subordinated to AAA and amortization of the reserve fund, amongst others).
In each and every one of the issues, in addition to the initial rating, the agencies carry out regular quarterly monitoring.
3.2.7.4.2. Breakdown of securitized balances by type of asset
The next tables give the current outstanding balance, non-performing exposures and impairment losses recognized in the period corresponding to the underlying assets of originated securitizations, in which risk transfer criteria are fulfilled, broken down by type of asset, as of December 31, 2015 and 2014.
Table 41. Breakdown of securitized balances by type of asset
2015
(Million euros)
| Type of asset | Current balance |
Of which: Non-performing Exposures (1) |
Total impairment losses for the period |
|---|---|---|---|
| Commercial and residential mortgages | 51 | 10 | 1 |
| Credit cards | 0 | 0 | 0 |
| Financial leasing | 141 | 19 | 6 |
| Lending to corporates and SMEs | 162 | 25 | 5 |
| Consumer finance | 12 | 2 | 4 |
| Receivables | 0 | 0 | 0 |
| Securitization balances | 0 | 0 | 0 |
| Others | 0 | 0 | 0 |
| TOTAL | 366 | 56 | 17 |
2014
(Million euros)
| Type of asset | Current balance |
Of which: Non-performing Exposures (1) |
Total impairment losses for the period |
|---|---|---|---|
| Commercial and residential mortgages | 155 | 24 | 1 |
| Credit cards | 0 | 0 | 0 |
| Financial leasing | 206 | 26 | 1 |
| Lending to corporates and SMEs | 296 | 46 | 7 |
| Consumer finance | 142 | 11 | 22 |
| Receivables | 0 | 0 | 0 |
| Securitization balances | 0 | 0 | 0 |
| Others | 0 | 0 | 0 |
| TOTAL | 798 | 108 | 32 |
In 2015 and 2014, there were no securitizations that fulfill the transfer criteria according to the requirements of the solvency regulation, and, therefore, no results were recognized.
BBVA has been the structurer of all transactions effected since 2006 (excluding the transactions for the merged company Unnim and Catalunya Banc).
The table below shows the outstanding balance of underlying assets of securitizations originated by the Group, in which risk transfer criteria are not fulfilled. These, therefore, are not included in the solvency framework for securitizations; the capital exposed is calculated as if they had not been securitized:
Table 42. Outstanding balance corresponding to the underlying assets of the Group’s originated securitizations, in which risk transfer criteria are not fulfilled
(Million euros)
| Type of asset | Current Balance | |
|---|---|---|
|
|
2015 | 2014 |
| Commercial and residential mortgages | 33,209 | 22,916 |
| Credit cards | 0 | 0 |
| Financial leasing | 13 | 14 |
| Lending to corporates and SMEs | 589 | 2,525 |
| Consumer finance | 2,055 | 1,071 |
| Receivables | 0 | 0 |
| Securitization balances | 1,407 | 58 |
| Mortgage-covered bonds | 0 | 0 |
| Others | 0 | 0 |
| TOTAL | 37,272 | 26,584 |
3.2.8. Information on credit risk mitigation techniques
3.2.8.1. Hedging based on netting operations on and off the balance sheet
Within the limits established by the rules on netting in each one of the countries in which it operates, the Group negotiates with its customers the assignment of the derivatives business to master agreements (e.g., ISDA or CMOF) that include the netting of off-balance sheet transactions.
The clauses of each agreement determine in each case the transactions subject to netting.
The mitigation of counterparty risk exposure stemming from the use of mitigation techniques (netting plus the use of collateral agreements) leads to a reduction in overall exposure (current market value plus potential risk).
As pointed out above, financial assets and liabilities may be the object of netting, in other words presentation for a net amount on the balance sheet, only when the Group’s entities comply with the provisions of IAS 32 - Paragraph 42, and thus have the legal right to offset the amounts recognized, and the intention to settle the net amount or to divest the asset and pay the liability at the same time.
3.2.8.2. Hedging based on collaterals
3.2.8.2.1. Management and valuation policies and procedures
The procedures for management and valuation of collateral are included in the Policies and Procedures for Retail and Wholesale Credit Risk.
These Policies and Procedures lay down the basic principles of credit risk management, which includes the management of the collateral assigned in transactions with customers.
Accordingly, the risk management model jointly values the existence of a suitable cash flow generation by the obligor that enables them to service the debt, together with the existence of suitable and sufficient guarantees that ensure the recovery of the credit when the obligor’s circumstances render them unable to meet their obligations.
The valuation of the collateral is governed by prudential principles that involve the use of appraisal for real-estate guarantees, market price for shares, quoted value of shares in a mutual fund, etc.
The milestones under which the valuations of the collaterals must be updated in accordance with local regulation are established under these prudential principles.
With respect to the entities that carry out the valuation of the collateral, principles are in place in accordance with local regulations that govern their level of relationship and dependence with the Group and their recognition by the local regulator. These valuations will be updated by statistical methods, indices or appraisals of goods, which shall be carried out under the generally accepted standards in each market and in accordance with local regulations.
All collateral assigned is to be properly instrumented and recorded in the corresponding register, and approved by the Group’s legal units.
3.2.8.2.2. Types of collaterals
As collateral for the purpose of calculating equity, the Group uses the coverage established in the solvency regulations. The following are the main collaterals available in the Group:
- Mortgage collateral: The collateral is the property upon which the loan is arranged.
- Financial collateral: Their object is any one of the following financial assets, as per articles 197 and 198 of the solvency regulations.
- Cash deposits, deposit certificates or similar securities.
- Debt securities issued for the different categories.
- Shares or convertible bonds
- Other property and rights used as collateral. The following property and rights are considered acceptable as collateral as per article 200 of the solvency regulations.
- Cash deposits, deposit certificates or similar instruments held in third-party institutions other than the lending credit institution, when these are pledged in favor of the latter.
- Life insurance policies pledged in favor of the lending credit institution.
- Debt securities issued by other institutions, provided that these securities are to be repurchased at a pre-set price by the issuing institutions at the request of the holder of the securities.
The value of the exposure covered with financial collateral and other collateral calculated using the standardized approach is as follows:
Table 43. Exposure covered with financial collateral and other collateral calculated using the standardized approach
2015
(Million euros)
| Categories of Exposure | Standardized Approach | Advanced Measurement Approach | ||
|---|---|---|---|---|
|
|
Exposure covered by financial collateral |
Exposure covered by other eligible collateral |
Exposure covered by financial collateral |
Exposure covered by other eligible collateral |
| Central governments or central banks | 6,566 | - | 1 | 7 |
| Regional governments or local authorities | 14 | - | - | - |
| Public sector entities | 179 | - | - | - |
| Multilateral Development Banks | - | - | - | - |
| International organizations | - | - | - | - |
| Institutions | 4,140 | 1 | 39,909 | 1,521 |
| Corporates | 7,157 | 298 | 34,624 | 1,985 |
| Retail | 719 | 56 | - | - |
| Secured by mortgages on immovable property | 84 | 309 | - | - |
| Exposures in default | 39 | 18 | - | - |
| Items associated with particularly high risk | 1 | - | - | - |
| Covered bonds | 7 | - | - | - |
| Short-term claims on institutions and corporate | - | - | - | - |
| Collective investments undertakings (CIU) | 144 | - | - | - |
| Other exposures | 6 | - | - | - |
| TOTAL EXPOSURE VALUE AFTER GUARANTEES | 19,055 | 682 | 74,534 | 3,512 |
2014
(Million euros)
| Categories of Exposure | Standardized Approach | Advanced Measurement Approach | ||
|---|---|---|---|---|
|
|
Exposure covered by financial collateral |
Exposure covered by other eligible collateral |
Exposure covered by financial collateral |
Exposure covered by other eligible collateral |
| Central governments or central banks | 3,000 | - | 1 | 7 |
| Regional governments or local authorities | 14 | - | - | - |
| Public sector entities | 362 | 38 | - | - |
| Multilateral Development Banks | - | - | - | - |
| International organizations | - | - | - | - |
| Institutions | 391 | 2 | 59,901 | 1,670 |
| Corporates | 3,219 | 145 | 38,878 | 4,549 |
| Retail | 1,276 | 59 | - | - |
| Secured by mortgages on immovable property | 129 | 306 | - | - |
| Exposures in default | 98 | 15 | - | - |
| Items associated with particularly high risk | 2 | - | - | - |
| Covered bonds | - | - | - | - |
| Short-term claims on institutions and corporate | 229 | - | - | - |
| Collective investments undertakings (CIU) | 74 | - | - | - |
| Other exposures | 3 | - | - | - |
| TOTAL EXPOSURE VALUE AFTER GUARANTEES | 8,796 | 564 | 98,781 | 6,225 |
3.2.8.3 Hedging based on personal guarantees
According to the solvency regulations, signature guarantees are personal guarantees, including those arising from credit insurance, that have been granted by the providers of coverage defined in articles 201 and 202 of the solvency regulations.
In the category of Retail exposure under the advanced measurement approach, guarantees impact on the PD and do not reduce the amount of the credit risk in EAD.
The total value of the exposure covered with personal guarantees is as follows:
Table 44. Exposure covered by personal collaterals. Standardized and advanced approach
(Million euros)
| Categories of Exposure | Exposure covered by personal guarantees | |
|---|---|---|
|
|
2015 | 2014 |
| Central governments or central banks | - | - |
| Regional governments or local authorities | 63 | 86 |
| Public sector entities | 2,754 | 2,661 |
| Multilateral Development Banks | - | - |
| International organizations | - | - |
| Institutions | 594 | 1 |
| Corporates | 2,486 | 2,238 |
| Retail | 1,203 | 996 |
| Secured by mortgages on immovable property | 1,075 | 1,229 |
| Exposures in default | 280 | 514 |
| Items associated with particularly high risk | 48 | 139 |
| Covered bonds | - | - |
| Short-term claims on institutions and corporate | - | - |
| Collective investments undertakings (CIU) | - | - |
| Other exposures | 1,067 | 1,230 |
| TOTAL EXPOSURE VALUE AFTER COLLATERAL UNDER STANDARDIZED APPROACH | 9,571 | 9,094 |
| Central governments or central banks | 722 | 649 |
| Institutions | 809 | 847 |
| Retail | 31 | - |
| Corporates | 5,961 | 5,948 |
| Of which: SMEs | 1,950 | 871 |
| Of which: SMEs subject to corrector factor | - | 844 |
| Of which: others | 4,011 | 4,233 |
| TOTAL EXPOSURE VALUE AFTER COLLATERAL UNDER ADVANCED APPROACH | 7,523 | 7,444 |
| TOTAL | 17,094 | 16,538 |
3.2.8.4. Risk concentration
BBVA has established the measurement, monitoring and reporting criteria for the analysis of large credit exposures that could represent a risk of concentration, with the aim of guaranteeing their alignment with the risk appetite defined in the Group.
In particular, measurement and monitoring criteria are established for large exposures at the level of individual concentrations, concentrations of retail portfolios and wholesale sectors, and geographical concentrations.
A quarterly measurement and monitoring process has been established for reviewing the risks of concentration.
3.2.9. RWA density by geographical area
A summary of the average weighting percentages by exposure category existing in the main geographical areas in which the Group operates is shown below, for the purpose of obtaining an overview of the entity’s risk profile in terms of RWAs.
Table 45. Breakdown of RWA density by geographical area and approach 2015
(Million euros)
| Category of exposure |
|
RWA density (*) | ||||||
|---|---|---|---|---|---|---|---|---|
|
|
TOTAL | Spain | Turkey | Eurasia | Mexico | The United States" |
South America |
Rest of the World |
| Central governments or central banks | 25% | 15%(1) | 46% | 3% | 0% | 2% | 64% | 0% |
| Regional governments or local authorities | 44% | 5% | 61% | 20% | 0% | 58% | 58% | 0% |
| Public sector entities | 52% | 41% | 4% | 1% | 20% | 5% | 89% | 0% |
| Multilateral Development Banks | 67% | 18% | 0% | 0% | 0% | 0% | 67% | 0% |
| International organizations | 0% | 0% | 0% | 0% | 0% | 0% | 0% | 0% |
| Institutions | 29% | 16% | 44% | 21% | 26% | 31% | 35% | 25% |
| Corporates | 96% | 73% | 100% | 97% | 84% | 96% | 99% | 100% |
| Retail | 70% | 64% | 66% | 74% | 75% | 70% | 75% | 66% |
| Secured by mortgages on immovable property | 39% | 40% | 39% | 39% | 36% | 37% | 41% | 89% |
| Exposures in default | 108% | 110% | 118% | 102% | 100% | 101% | 109% | 100% |
| Items associated with particularly high risk | 93% | 94% | 0% | 20% | 0% | 0% | 0% | 0% |
| Covered bonds | 47% | 0% | 0% | 0% | 47% | 0% | 0% | 0% |
| Short-term claims on institutions and corporate | 31% | 22% | 0% | 28% | 100% | 20% | 26% | 0% |
| Collective investments undertakings (CIU) | 23% | 30% | 0% | 20% | 0% | 20% | 100% | 0% |
| Other exposures | 55% | 82% | 51% | 11% | 48% | 33% | 34% | 0% |
| Securitized positions | 31% | 64% | 0% | 0% | 46% | 23% | 0% | 0% |
| TOTAL CREDIT RISK BY THE STANDARDIZED APPROACH | 53% | 34% | 71% | 34% | 34% | 60% | 70% | 49% |
| Central governments or central banks | 4% | 7% | 2% | 2% | 13% | 0% | 7% | 16% |
| Institutions | 12% | 18% | 50% | 6% | 3% | 29% | 27% | 10% |
| Corporates | 57% | 60% | 71% | 53% | 65% | 41% | 56% | 53% |
| Retail | 21% | 16% | 22% | 37% | 100% | 24% | 30% | 31% |
| Securitized positions | 35% | 35% | 0% | 0% | 0% | 0% | 0% | 0% |
| TOTAL CREDIT RISK BY THE ADVANCED MEASUREMENT APPROACH | 31% | 28% | 50% | 25% | 73% | 30% | 46% | 36% |
| TOTAL CREDIT RISK DILUTION AND DELIVERY | 44% | 30% | 70% | 28% | 47% | 56% | 69% | 38% |
As shown, the Group has a RWA density below 50%, with the lowest densities (RW) concentrated in the euro zone countries (in line with the rest of Spanish peers) and the highest in the Americas and Turkey. The reason for this lies in:
- The weight that the advanced measurement approaches represent in Spain with respect to the rest of the countries in which the Group operates, as explained in section 4.2.3.
- The RWs applied to European PAs represent a small percentage with respect to the RWs applied to the PAs outside the euro zone.
- Moreover, the exposures in Europe with institutional counterparties (which have a low associated RW) represent a higher percentage of the portfolio’s total than in the rest of the Group’s countries.
3.2.10. Risk protection and reduction policies. Supervision strategies and processes
In most cases, maximum exposure to credit risk is reduced by collateral, credit enhancements and other actions which mitigate the Group’s exposure. The Group applies a credit risk protection and mitigation policy deriving from its business model focused on relationship banking.
On this basis, the provision of guarantees may be a necessary instrument but one that is not sufficient when taking risks; this is because for the Group to assume risks, it needs to verify the payment or resource generation capacity to comply with repayment of the risk incurred under the agreed conditions.
This is carried out through a prudent risk management policy which involves analyzing the financial risk in a transaction, based on the repayment or resource generation capacity of the credit receiver, the provision of guarantees -in any of the generally accepted ways (monetary, collateral or personal guarantees and hedging)- appropriate to the risk borne, and lastly on the valuation of the recovery risk (the asset’s liquidity) of the guarantees received.
The procedures for the management and valuation of collateral are set out in the Credit Risk Management Policies and Procedures (retail and wholesale), which establish the basic principles for credit risk management, including the management of collateral assigned in transactions with customers.
The methods used to value the collateral are in line with the best market practices and imply the use of appraisal of real- estate collateral, the market price in market securities, the trading price of shares in mutual funds, etc. All collateral assigned must be properly drawn up and entered in the corresponding register. They must also have the approval of the Group’s legal units.
The following is a description of the main types of collateral for each financial instrument class:
- Trading book: The guarantees or credit enhancements obtained directly from the issuer or counterparty are implicit in the clauses of the instrument.
- Trading and hedging derivatives: In derivatives, credit risk is minimized through contractual netting agreements, where positive- and negative-value derivatives with the same counterparty are offset for their net balance. There may likewise be other kinds of guarantees, depending on counterparty solvency and the nature of the transaction.
- Other financial assets and liabilities designated at fair value through profit or loss and available-for-sale financial assets: Guarantees or credit enhancements obtained directly from the issuer or counterparty are inherent in the structure of the instrument.
- Loans and receivables:
- Loans and advances to credit institutions: These usually only have the counterparty’s personal guarantee.
- Loans and advances to customers: Most of these operations are backed by personal guarantees extended by the counterparty. There may also be collateral to secure loans and advances to customers (such as mortgages, cash guarantees, pledged securities and other collateral), or to obtain other credit enhancements (bonds, hedging, etc.).
- Debt securities: Guarantees or credit enhancements obtained directly from the issuer or counterparty are inherent in the structure of the instrument.