South America highlights in the first quarter
- Business activity remains strong.
- Excellent price management.
- Improved asset quality.
- Positive performance by the pension and insurance businesses.
Industry Trends
In the first quarter of 2012, the economic growth in the region, already mentioned, boosted lending activity and deposits in South America, in line with the trend seen in 2011.
This growth was accompanied by new local regulations, mainly related to provisioning and capital requirements. The new regulations aim to implement international standards to support quality and competitive growth.
The evolution of exchange rates, both over the quarter and over the last 12 months, had a positive impact on activity, the balance sheet and earnings in the area. Unless indicated otherwise, all comments below on percentage changes refer to constant exchange rates, with the aim of providing a better understanding of the performance of the business in this area.
Income statement
(Million euros)
|
|
Units: |
|
South America |
Banking business |
Pensions and Insurance |
|
1Q12 |
Δ% |
Δ% (1) |
1Q11 |
1Q12 |
Δ% |
Δ% (1) |
1Q11 |
1Q12 |
Δ% |
Δ% (1) |
1Q11 |
| Net interest income |
947 |
36.4 |
29.9 |
694 |
930 |
36.3 |
29.8 |
682 |
17 |
42.9 |
34.0 |
12 |
| Net fees and commissions |
310 |
22.7 |
17.3 |
253 |
217 |
20.7 |
15.7 |
180 |
95 |
24.2 |
18.1 |
76 |
| Net trading income |
149 |
(25.7) |
(28.4) |
201 |
122 |
(30.9) |
(33.7) |
176 |
27 |
11.9 |
11.4 |
24 |
| Other income/expenses |
(40) |
(4.8) |
(12.1) |
(41) |
(82) |
(0.9) |
(5.4) |
(83) |
45 |
4.1 |
2.8 |
43 |
| Gross income |
1,366 |
23.6 |
18.1 |
1,106 |
1,185 |
24.2 |
18.6 |
954 |
184 |
18.1 |
14.2 |
156 |
| Operating costs |
(553) |
18.1 |
13.1 |
(468) |
(488) |
21.7 |
16.4 |
(401) |
(58) |
(4.5) |
(8.1) |
(61) |
| Personnel expenses |
(282) |
17.7 |
12.9 |
(239) |
(247) |
21.7 |
16.6 |
(203) |
(28) |
(5.6) |
(9.3) |
(30) |
| General and administrative expenses |
(233) |
19.7 |
14.6 |
(194) |
(205) |
23.9 |
18.4 |
(165) |
(28) |
(5.3) |
(8.8) |
(29) |
| Deprecation and amortization |
(39) |
11.5 |
6.0 |
(35) |
(36) |
10.7 |
5.2 |
(33) |
(2) |
26.6 |
21.4 |
(2) |
| Operating income |
813 |
27.6 |
21.8 |
637 |
697 |
26.1 |
20.2 |
553 |
126 |
32.6 |
28.6 |
95 |
| Impairment on financial assets (net) |
(98) |
(18.2) |
(22.5) |
(120) |
(98) |
(18.5) |
(22.8) |
(120) |
- |
- |
- |
- |
| Provisions (net) and other gains (losses) |
(25) |
64.8 |
62.0 |
(15) |
(24) |
87.9 |
83.5 |
(13) |
- |
- |
- |
- |
| Income before tax |
690 |
37.4 |
31.3 |
502 |
576 |
36.9 |
30.6 |
420 |
125 |
32.6 |
28.5 |
94 |
| Income tax |
(153) |
82.2 |
73.2 |
(84) |
(130) |
87.9 |
78.9 |
(69) |
(26) |
45.5 |
38.9 |
(18) |
| Net income |
537 |
28.4 |
22.9 |
418 |
446 |
26.9 |
21.1 |
351 |
99 |
29.6 |
26.1 |
76 |
| Non-controlling interests |
(167) |
19.6 |
14.3 |
(139) |
(142) |
16.5 |
11.1 |
(122) |
(24) |
33.9 |
30.2 |
(18) |
| Net attributable profit |
370 |
32.9 |
27.1 |
279 |
304 |
32.5 |
26.4 |
230 |
75 |
28.2 |
24.8 |
58 |
(1) At constant exchange rate.
Balance sheet
(Million euros)
|
|
Units: |
|
South America |
Banking business |
Pensions and Insurance |
|
31-03-12 |
Δ% |
Δ% (1) |
31-03-11 |
31-03-12 |
Δ% |
Δ% (1) |
31-03-11 |
31-03-12 |
Δ% |
Δ% (1) |
31-03-11 |
| Cash and balances with central banks |
8,839 |
25.6 |
16.6 |
7,037 |
8,838 |
25.6 |
16.6 |
7,037 |
- |
- |
- |
- |
| Financial assets |
9,977 |
13.3 |
6.3 |
8,808 |
8,509 |
21.6 |
13.9 |
6,998 |
1,434 |
(18.8) |
(23.2) |
1,766 |
| Loans and receivables |
44,169 |
32.5 |
23.5 |
33,343 |
43,794 |
34.5 |
25.2 |
32,570 |
288 |
(47.2) |
(49.1) |
545 |
| Loans and advances to customers |
40,027 |
33.8 |
24.5 |
29,909 |
39,961 |
34.3 |
25.0 |
29,745 |
68 |
(61.7) |
(62.6) |
178 |
| Loans and advances to credit institutions and other |
4,142 |
20.6 |
14.2 |
3,434 |
3,833 |
35.7 |
28.1 |
2,825 |
220 |
(40.1) |
(42.8) |
367 |
| Tangible assets |
808 |
24.1 |
16.0 |
651 |
757 |
26.4 |
18.0 |
599 |
50 |
(1.9) |
(7.1) |
51 |
| Other assets |
2,482 |
23.1 |
16.7 |
2,016 |
1,962 |
23.4 |
15.4 |
1,591 |
156 |
14.4 |
8.5 |
136 |
| Total assets/Liabilities and equity |
66,274 |
27.8 |
19.3 |
51,855 |
63,861 |
30.9 |
21.9 |
48,795 |
1,928 |
(22.8) |
(26.7) |
2,499 |
| Deposits from central banks and credit institutions |
5,640 |
25.0 |
15.6 |
4,513 |
5,639 |
25.0 |
15.6 |
4,512 |
1 |
(70.3) |
(70.9) |
4 |
| Deposits from customers |
44,249 |
34.2 |
25.1 |
32,965 |
44,432 |
34.3 |
25.2 |
33,077 |
- |
- |
- |
- |
| Debt certificates |
2,676 |
40.9 |
30.8 |
1,900 |
2,676 |
40.9 |
30.8 |
1,900 |
- |
- |
- |
- |
| Subordinated liabilities |
1,612 |
10.6 |
4.5 |
1,458 |
1,157 |
7.5 |
(0.3) |
1,076 |
- |
- |
- |
- |
| Financial liabilities held for trading |
902 |
24.1 |
17.5 |
727 |
902 |
24.1 |
17.5 |
727 |
- |
- |
- |
- |
| Other liabilities |
8,367 |
8.2 |
2.1 |
7,730 |
6,376 |
17.0 |
9.9 |
5,451 |
1,782 |
(13.4) |
(17.7) |
2,058 |
| Economic capital allocated |
2,827 |
10.3 |
2.5 |
2,563 |
2,678 |
30.5 |
20.8 |
2,052 |
145 |
(66.8) |
(68.8) |
436 |
(1) At constant exchange rate.
Significant ratios
(Percentage)
|
South America |
|
31-03-12 |
31-12-11 |
31-03-11 |
| Efficiency ratio |
40.5 |
45.8 |
42.4 |
| NPA ratio |
2.3 |
2.2 |
2.5 |
| NPA coverage ratio |
141 |
146 |
134 |
| Risk premium |
0.97 |
1.31 |
1.55 |
South America. Operating income
(Million euros at constant exchange rate)
(1) At current exchange rates: +27.6%
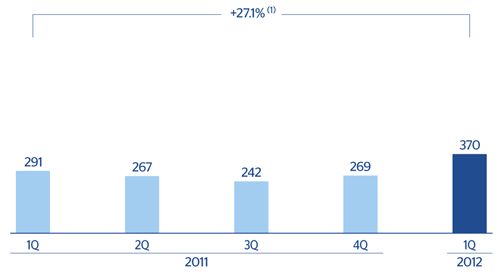
South America. Net attributable profit
(Million euros at constant exchange rate)
(1) At current exchange rates: +32.9%