
In the first quarter of 2012 the main indicators of the Group’s credit quality remained stable, thanks to geographical diversification and prudent risk management policies. This has also helped BBVA to maintain its credit quality parameters at better levels than those of its peers.
As of March 31 2012, the volume of total risks (including contingent liabilities) stood at €400,553m, a slight decrease on the figure at the close of 2011. Growing lending activity in emerging economies offset the decrease in lending in Spain due to the deleveraging process underway in the country.
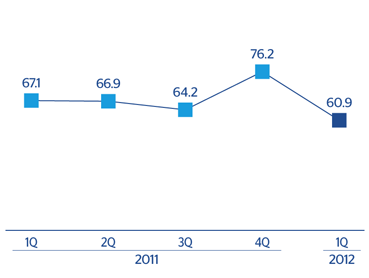
Non-performing assets stood at €16,096m as of 31-March-2012, compared with €15,866m at the close of 2011. The slight increase is mainly due to the higher NPA ratio in Spain, a slight negative impact from exchange rates and stricter regulatory framework in Mexico. In terms of variations in NPA over the quarter, both gross additions to NPA and recoveries were below the quarterly average of the previous year, and the ratio of recoveries to gross additions to NPA stood at 60.9%.
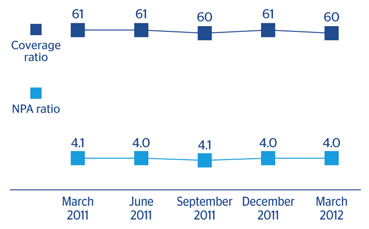
As a result, the Group’s NPA ratio ended the first quarter of 2012 at 4.0%. The figures vary by business area. The ratio increased slightly in Spain (4.9% compared with 4.8% at the close of 2011) and in Mexico (3.8% as of 31-Mar-2012 compared with 3.7% as of 31-Dec-2011). In contrast, the NPA ratio fell in the United States to 3.2% (3.5% as of 31-Dec-2011) thanks to a renewed improvement in asset quality in the area. Finally, in South America and Eurasia the ratio remains at historically low levels (2.3% and 1.6% respectively at the close of March 2012).
Coverage provisions for customer risk amounted to €9,726m as of 31-Mar-2012. Of this figure, generic provisions and country risk provisions accounted for €3,061m and represent 31.5% of the total.
Finally, the NPA coverage ratio closed 31-Mar-2012 at 60%. By business areas, the figures for Spain and South America were practically the same as for December 2011 (43% and 141% respectively). United States improved to 75% and Eurasia and Mexico fell to 114% and 116% respectively.
Reform of the Spanish financial system
BBVA’s exposure to the real estate segment subject to Royal Decree-Law 02/2012 was €22,089m (out of which 63% are developer loans and 37% are foreclosed assets). With regards to the developer loans they represent 7% of all domestic lending, compared with the average of 18% in the Spanish financial system.
By the status of assets, 63% are classified as problematic (26% NPL, 15% substandard and 59% foreclosed assets) and 37% are performing loans.
The breakdown of the developer loans by type of assets is: 49.4% finished housing, 16.0% housing under development, 26.2% land and 8.5% are other assets, including those with personal guarantee.