C&IB highlights in the first quarter
- Prioritization of prices over volumes.
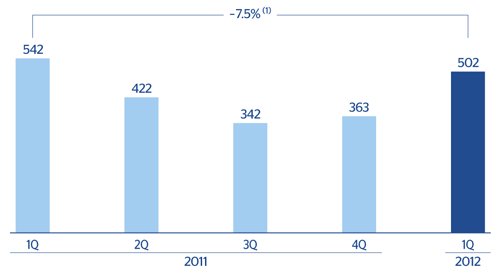
- Resilient operating income.
- Several awards and recognitions received in the quarter..
Industry Trends
In the first quarter of 2012 activity in wholesale markets slowed compared with the same period of the previous year, with the number of transactions and volumes down. Equity markets were particularly hard hit.
Despite this situation, BBVA has maintained its level of earnings due to the Group’s differential model based, above all, on a strong relationship with its customers. This provides high quality and highly recurring earnings.
Income statement
(Million euros)
|
Corporate & Investment Banking |
|
1Q12 |
Δ% |
Δ% (1) |
1Q11 |
| Net interest income |
416 |
13.6 |
12.6 |
366 |
| Net fees and commissions |
187 |
19.0 |
17.9 |
157 |
| Net trading income |
111 |
(51.1) |
(51.6) |
227 |
| Other income/expenses |
3 |
n.m. |
n.m. |
(7) |
| Gross income |
717 |
(3.6) |
(4.4) |
744 |
| Operating costs |
(215) |
4.6 |
3.4 |
(206) |
| Personnel expenses |
(119) |
(0.1) |
(0.9) |
(119) |
| General and administrative expenses |
(94) |
9.4 |
7.7 |
(86) |
| Deprecation and amortization |
(3) |
109.4 |
104.5 |
(1) |
| Operating income |
502 |
(6.7) |
(7.5) |
538 |
| Impairment on financial assets (net) |
(60) |
166.3 |
164.2 |
(23) |
| Provisions (net) and other gains (losses) |
(4) |
(35.9) |
(38.8) |
(6) |
| Income before tax |
438 |
(14.0) |
(14.7) |
510 |
| Income tax |
(131) |
(7.8) |
(8.4) |
(142) |
| Net income |
307 |
(16.4) |
(17.1) |
368 |
| Non-controlling interests |
(28) |
7.6 |
2.7 |
(26) |
| Net attributable profit |
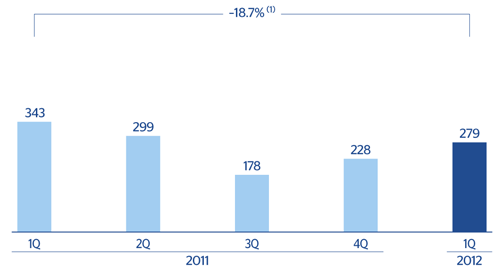
279 |
(18.3) |
(18.7) |
342 |
(1) At constant exchange rate.
Balance sheet
(Million euros)
|
Corporate & Investment Banking |
|
31-03-12 |
Δ% |
Δ% (1) |
31-03-11 |
| Cash and balances with central banks |
4,992 |
(0.6) |
(6.4) |
5,021 |
| Financial assets |
76,364 |
25.4 |
25.1 |
60,888 |
| Loans and receivables |
69,059 |
8.4 |
7.2 |
63,684 |
| Loans and advances to customers |
55,847 |
13.5 |
11.7 |
49,212 |
| Loans and advances to credit institutions and other |
13,212 |
(8.7) |
(8.5) |
14,473 |
| Inter-area positions |
13,044 |
(28.1) |
(28.3) |
18,153 |
| Tangible assets |
30 |
34.1 |
31.2 |
22 |
| Other assets |
2,501 |
62.0 |
58.2 |
1,544 |
| Total assets/Liabilities and equity |
165,991 |
11.2 |
10.2 |
149,312 |
| Deposits from central banks and credit institutions |
65,930 |
43.4 |
42.6 |
45,965 |
| Deposits from customers |
42,886 |
(27.9) |
(29.0) |
59,486 |
| Debt certificates |
(108) |
n.m. |
n.m. |
17 |
| Subordinated liabilities |
2,250 |
(5.3) |
(5.6) |
2,376 |
| Inter-area positions |
- |
- |
- |
- |
| Financial liabilities held for trading |
46,855 |
41.6 |
41.4 |
33,084 |
| Other liabilities |
4,070 |
(2.8) |
(3.2) |
4,186 |
| Economic capital allocated |
4,108 |
(2.1) |
(3.4) |
4,198 |
(1) At constant exchange rate.
C&IB. Operating income
(Million euros at constant exchange rate)
(1) At current exchange rates: -6.7%.
C&IB. Net attributable profit
(Million euros at constant exchange rate)
(1) At current exchange rates: -18.3%.


