Results
BBVA generated a net attributable e profit of €3,449m in the first nine months of 2017, a year-on-year increase of 23.3%. Once again, the key highlights are the good performance of more recurring revenue items, tight control of operating expenses and the reduction in impairment losses on financial assets, which offset a smaller contribution from net trading income (NTI).
Unless expressly indicated otherwise, to better understand the changes in the main headings of the Group's income statement, the year-on-year percentage changes given below refer to constant exchange rates.
Consolidated income statement: quarterly evolution (Million euros)
| 2017 | 2016 | ||||||
|---|---|---|---|---|---|---|---|
| 3Q | 2Q | 1Q | 4Q | 3Q | 2Q | 1Q | |
| Net interest income | 4,399 | 4,481 | 4,322 | 4,385 | 4,310 | 4,213 | 4,152 |
| Net fees and commissions | 1,249 | 1,233 | 1,223 | 1,161 | 1,207 | 1,189 | 1,161 |
| Net trading income | 347 | 378 | 691 | 379 | 577 | 819 | 357 |
| Dividend income | 35 | 169 | 43 | 131 | 35 | 257 | 45 |
| Share of profit or loss of entities accounted for using the equity method | 6 | (2) | (5) | 7 | 17 | (6) | 7 |
| Other operating income and expenses | 154 | 77 | 108 | 159 | 52 | (26) | 66 |
| Gross income | 6,189 | 6,336 | 6,383 | 6,222 | 6,198 | 6,445 | 5,788 |
| Operating expenses | (3,075) | (3,175) | (3,137) | (3,243) | (3,216) | (3,159) | (3,174) |
| Personnel expenses | (1,607) | (1,677) | (1,647) | (1,698) | (1,700) | (1,655) | (1,669) |
| Other administrative expenses | (1,123) | (1,139) | (1,136) | (1,180) | (1,144) | (1,158) | (1,161) |
| Depreciation | (344) | (359) | (354) | (365) | (372) | (345) | (344) |
| Operating income | 3,115 | 3,161 | 3,246 | 2,980 | 2,982 | 3,287 | 2,614 |
| Impairment on financial assets (net) | (976) | (997) | (945) | (687) | (1,004) | (1,077) | (1,033) |
| Provisions (net) | (201) | (193) | (170) | (723) | (201) | (81) | (181) |
| Other gains (losses) | 44 | (3) | (66) | (284) | (61) | (75) | (62) |
| Profit/(loss) before tax | 1,981 | 1,969 | 2,065 | 1,285 | 1,716 | 2,053 | 1,338 |
| Income tax | (550) | (546) | (573) | (314) | (465) | (557) | (362) |
| Profit/(loss) for the year | 1,431 | 1,422 | 1,492 | 971 | 1,251 | 1,496 | 976 |
| Non-controlling interests | (288) | (315) | (293) | (293) | (286) | (373) | (266) |
| Net attributable profit | 1,143 | 1,107 | 1,199 | 678 | 965 | 1,123 | 709 |
| Earning per share (euros) (1) | 0.16 | 0.16 | 0.17 | 0.09 | 0.13 | 0.16 | 0.10 |
- (1) Adjusted by additional Tier 1 instrument remuneration.
Consolidated income statement (Million euros)
| Jan.-Sep. 17 | ∆% | ∆% at constant exchange rates | Jan.-Sep. 16 | |
|---|---|---|---|---|
| Net interest income | 13,202 | 4.2 | 9.5 | 12,674 |
| Net fees and commissions | 3,705 | 4.2 | 8.4 | 3,557 |
| Net trading income | 1,416 | (19.2) | (13.3) | 1,753 |
| Dividend income | 247 | (26.4) | (26.2) | 336 |
| Share of profit or loss of entities accounted for using the equity method | (1) | n.s. | n.s. | 18 |
| Other operating income and expenses | 339 | 267.1 | 85.2 | 92 |
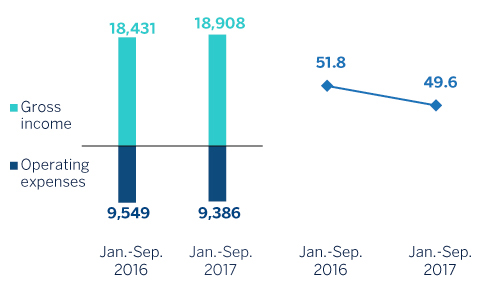
| Gross income | 18,908 | 2.6 | 7.2 | 18,431 |
| Operating expenses | (9,386) | (1.7) | 1.8 | (9,549) |
| Personnel expenses | (4,931) | (1.8) | 1.4 | (5,024) |
| Other administrative expenses | (3,398) | (1.9) | 1.9 | (3,464) |
| Depreciation | (1,057) | (0.4) | 3,.5 | (1,061) |
| Operating income | 9,522 | 7.2 | 13.1 | 8,882 |
| Impairment on financial assets (net) | (2,917) | (6.3) | (2.7) | (3,114) |
| Provisions (net) | (564) | 21.9 | 17.0 | (463) |
| Other gains (losses) | (25) | (87.5) | (87.6) | (198) |
| Profit/(loss) before tax | 6,015 | 17.8 | 27.0 | 5,107 |
| Income tax | (1,670) | 20.6 | 33.4 | (1,385) |
| Profit/(loss) for the year | 4,345 | 16.7 | 24.6 | 3,722 |
| Non-controlling interests | (896) | (3.1) | 11.2 | (925) |
| Net attributable profit | 3,449 | 23.3 | 28.7 | 2,797 |
| Earning per share (euros) (1) | 0.49 | 0.40 |
- (1) Adjusted by additional Tier 1 instrument remuneration.
Gross income
Cumulative gross income grew by 7.2% year-on-year, still strongly supported by the positive performance of the more recurring items.
Gross income (Million euros)
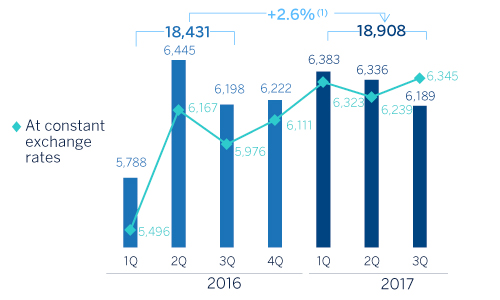
(1) At constant exchange rates: +7.2%.
Net interest income increased by 9.5% in year-on-year terms and 2.4% over the quarter. This positive trend was once again driven by activity growth in emerging economies and good management of customer spreads.
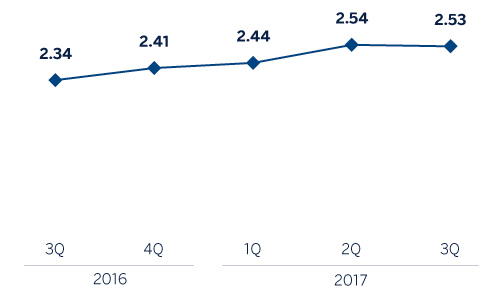
Net interest income/ATAs (Percentage)
Cumulative net fees and commissions have also performed well (up 8.4% year-on-year and 5.0% over the quarter) in all of the Group's areas, which reflects appropriate diversification.
As a result, more recurring revenues items (net interest income plus net fees and commissions) have increased by 9.3% year-on-year (3.0% over the last three months).
Net interest income plus fees and commissions (Million euros)
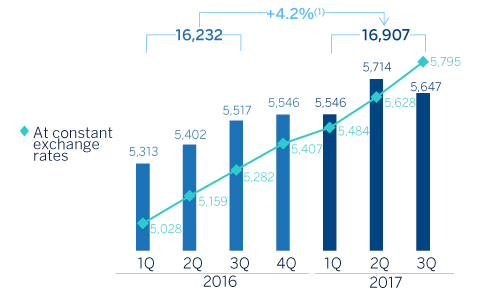
(1) At constant exchange rates: +9.3%.
NIT slowed over January to September in comparison with the same period of 2016. This is primarily explained by fewer ALCO portfolio sales this year compared to the first nine months of 2016. BBVA Group sold its remaining 0.34% stake in China Citic Bank (CNCB) in the third quarter of 2017.
The dividend income heading mainly includes income from the Group's stake in the Telefónica group. This figure declined by 26.2% in the first nine months of 2017 compared with the same period last year, due to a reduction in the dividend paid by Telefónica in the second quarter of 2017 from €0.4 to €0.2 per share, and the inclusion of dividends from CNCB in last year's second quarter figures.
Finally, other operating income and expenses increased by 85.2% year-on-year, largely due to the positive contribution from the insurance business (up 11.7% over the last twelve months). This line also includes the annual pre-tax contribution of €100m paid to the Single Resolution Fund (SRF) in the second quarter of 2017 (€122m in the same period of 2016).
Operating income
Growth in operating expenses continued to slow on a year-on-year basis, to 1.8%. This is due to the cost discipline implemented in all the areas of the Group through efficiency plans that are beginning to deliver results, and the materialization of some synergies (mainly those resulting from the integration of Catalunya Banc - CX-). The largest reductions took place in Spain. In the rest of the geographic areas (Mexico, Turkey, the United States and South America), the year-on-year rate of change in costs was below local inflation.
Operating expenses (Million euros)
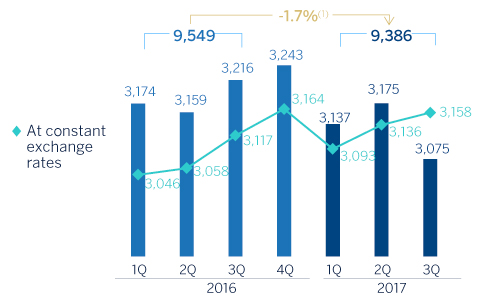
(1) At constant exchange rates: +1.8%.
As a result of the above, the efficiency ratio remained stable at 49.6% (in line with the first half of 2017 and below the 51.8% recorded during the same period of 2016), while cumulative operating income has risen by 13.1% over the last twelve months.
Breakdown of operating expenses and efficiency calculation (Million euros)
| Jan.-Sep. 17 | ∆% | Jan.-Sep. 16 | |
|---|---|---|---|
| Personnel expenses | 4,931 | (1.8) | 5,024 |
| Wages and salaries | 3,851 | (1.4) | 3,908 |
| Employee welfare expenses | 710 | (1.2) | 719 |
| Training expenses and other | 370 | (6.9) | 397 |
| Other administrative expenses | 3,398 | (1.9) | 3,464 |
| Property. fixtures and materials | 787 | (3.9) | 819 |
| IT | 767 | 6.5 | 720 |
| Communications | 210 | (8.9) | 230 |
| Advertising and publicity | 278 | (7.0) | 299 |
| Corporate expenses | 76 | 3.6 | 74 |
| Other expenses | 935 | (6.2) | 997 |
| Levies and taxes | 346 | 6.4 | 325 |
| Administration costs | 8,329 | (1.9) | 8,488 |
| Depreciation | 1,057 | (0.4) | 1,061 |
| Operating expenses | 9,386 | (1.7) | 9,549 |
| Gross income | 18,908 | 2.6 | 18,431 |
| Efficiency ratio (operating expenses/gross income; %) | 49.6 | 51.8 |
Efficiency (Million euros) and efficiency ratio (Percentage)
Operating income (Million euros)
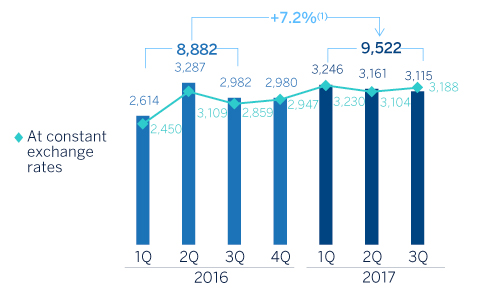
(1) At constant exchange rates: +13.1%.
Number of employees

Number of branches

Number of ATMs

Impairment on financial assests (net) (Million euros)
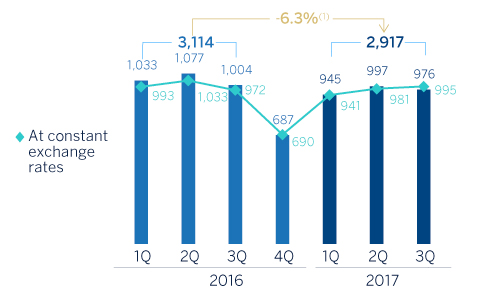
(1) At constant exchange rates: -2.7%.
Provisions and other
Impairment losses on financial assets fell by 2.7% relative to the same period of 2016. The key highlights by business area are: a reduction in Spain, due to fewer loan-loss provisioning requirements; and a decline in the United States, due to the negative effect of the rating downgrades of certain companies in the energy, metals and mining sectors in the first quarter of 2016. This decline was despite setting aside €54m of provisions in the third quarter for estimated defaults arising from recent hurricanes. Impairment losses also declined in Turkey due to fewer gross additions to NPL. In contrast, Mexico and South America saw an increase, largely linked to the increase in lending activity, and to a lesser extent, to the impact of increased requirements for insolvency provisions associated with some wholesale customers in the case of South America.
Finally, there was also a slight increase in the allocation to provisions (net) and other gains (losses) (down 13.8% year-on-year), which include, among other, provisions for contingent liabilities, contributions to pension funds and provisions for property and foreclosed assets and restructuring costs. The latter primarily affect Banking activity in Spain, the area where improving efficiency is a priority focus.
Results
As a result of the above, the Group's net attributable profit continues to be very positive (up 28.7% year-on-year). It is important to note that since March 2017 this figure includes the additional stake of 9.95% in the capital of Garanti, which has led to a positive impact of around €93m, due to a reduction in the non-controlling interests heading.
By business area, Banking activity in Spain generated a profit of €1,061m, Non Core Real Estate generated a loss of €281m, the United States contributed a profit of €422m, Mexico €1,616m, Turkey €568m, South America €616m and the Rest of Eurasia €101m.
Net attributable profit (Million euros)

(1) At constant exchange rates: +28.7%.
Earning per share (1) (Euros)

(1) Adjusted by additional Tier 1 instrument remuneration.
ROE and ROTE (1) (Percentage)

(1) The ROE and ROTE ratios include in the denominator the Group’s average shareholders’ funds, but do not take into account the caption within total equity named “Accumulated other comprehensive income” with an average balance of -€4,260m in January-September 2016, -€4,492m in 2016 and -€6,519 in January-September 2017.
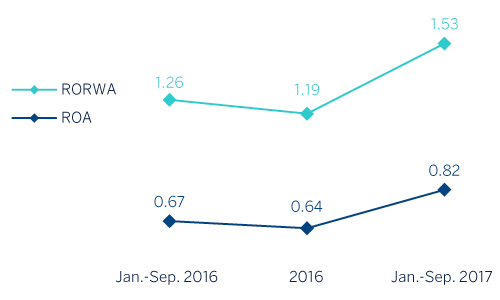
ROA and RORWA (Percentage)