Results
BBVA Group's net attributable profit for 2017 was €3,519m. It was affected by the negative impact of the recognition of impairment losses from its stake in Telefónica, S.A. as a result of the changes in the share price of the latter.
The Group thus generated a net attributable profit excluding the negative effect of these impairment losses of €4,642m. This represents growth of 33.6% on the net attributable profit in 2016 (up 19.7% excluding the charges for the so-called “mortgage floor clauses” in 2016). Once more, there was a notably good performance of more recurring revenue and containment of operating expenses.
Unless expressly indicated otherwise, to better understand the changes in the main headings of the Group’s incomestatement, the year-on-year percentage changes given belowrefer to constant exchange rates.
Consolidated income statement: quarterly evolution (Million euros)
| 2017 | 2016 | |||||||
|---|---|---|---|---|---|---|---|---|
| 4Q | 3Q | 2Q | 1Q | 4Q | 3Q | 2Q | 1Q | |
| Net interest income | 4,557 | 4,399 | 4,481 | 4,322 | 4,385 | 4,310 | 4,213 | 4,152 |
| Net fees and commissions | 1,215 | 1,249 | 1,233 | 1,223 | 1,161 | 1,207 | 1,189 | 1,161 |
| Net trading income | 552 | 347 | 378 | 691 | 379 | 577 | 819 | 357 |
| Dividend income | 86 | 35 | 169 | 43 | 131 | 35 | 257 | 45 |
| Share of profit or loss of entities accounted for using the equity method | 5 | 6 | (2) | (5) | 7 | 17 | (6) | 7 |
| Other operating income and expenses | (54) | 154 | 77 | 108 | 159 | 52 | (26) | 66 |
| Gross income | 6,362 | 6,189 | 6,336 | 6,383 | 6,222 | 6,198 | 6,445 | 5,788 |
| Operating expenses | (3,114) | (3,075) | (3,175) | (3,137) | (3,243) | (3,216) | (3,159) | (3,174) |
| Personnel expenses | (1,640) | (1,607) | (1,677) | (1,647) | (1,698) | (1,700) | (1,655) | (1,669) |
| Other administrative expenses | (1,143) | (1,123) | (1,139) | (1,136) | (1,180) | (1,144) | (1,158) | (1,161) |
| Depreciation | (331) | (344) | (359) | (354) | (365) | (372) | (345) | (344) |
| Operating income | 3,248 | 3,115 | 3,161 | 3,246 | 2,980 | 2,982 | 3,287 | 2,614 |
| Impairment on financial assets (net) | (1,885) | (976) | (997) | (945) | (687) | (1,004) | (1,077) | (1,033) |
| Provisions (net) | (180) | (201) | (193) | (170) | (723) | (201) | (81) | (181) |
| Other gains (losses) | (267) | 44 | (3) | (66) | (284) | (61) | (75) | (62) |
| Profit/(loss) before tax | 916 | 1,982 | 1,969 | 2,065 | 1,285 | 1,716 | 2,053 | 1,338 |
| Income tax | (499) | (550) | (546) | (573) | (314) | (465) | (557) | (362) |
| Profit/(loss) for the year | 417 | 1,431 | 1,422 | 1,492 | 971 | 1,251 | 1,496 | 976 |
| Non-controlling interests | (347) | (288) | (315) | (293) | (293) | (286) | (373) | (266) |
| Net attributable profit | 70 | 1,143 | 1,107 | 1,199 | 678 | 965 | 1,123 | 709 |
| Net attributable profit excluding results from corporate operations | 70 | 1,143 | 1,107 | 1,199 | 678 | 965 | 1,123 | 709 |
| Earning per share (euros) (1) | (0.00) | 0.16 | 0.16 | 0.17 | 0.09 | 0.13 | 0.16 | 0.10 |
| Net attributable profit without Telefónica and “mortgage floor clauses” impacts(2) | 1,192 | 1,143 | 1,107 | 1,199 | 1,082 | 965 | 1,123 | 709 |
- (1) Adjusted by additional Tier 1 instrument remuneration.
- (2) Excluding the impacts from the impairment losses from Telefónica in 2017 and the so-called “mortgage floor clauses” in 2016.
Consolidated income statement (Million euros)
| 2017 | ∆% | ∆% at constant exchange rates | 2016 | |
|---|---|---|---|---|
| Net interest income | 17,758 | 4.1 | 10.6 | 17,059 |
| Net fees and commissions | 4,921 | 4.3 | 9.4 | 4,718 |
| Net trading income | 1,968 | (7.7) | (6.0) | 2,132 |
| Dividend income | 334 | (28.5) | (28.3) | 467 |
| Share of profit or loss of entities accounted for using the equity method | 4 | (86.2) | (86.5) | 25 |
| Other operating income and expenses | 285 | 13.4 | 2.8 | 252 |
| Gross income | 25,270 | 2.5 | 7.9 | 24,653 |
| Operating expenses | (12,500) | (2.3) | 2.2 | (12,791) |
| Personnel expenses | (6,571) | (2.2) | 1.9 | (6,722) |
| Other administrative expenses | (4,541) | (2.2) | 2.7 | (4,644) |
| Depreciation | (1,387) | (2.7) | 1.8 | (1,426) |
| Operating income | 12,770 | 7.7 | 14.1 | 11,862 |
| Impairment on financial assets (net) | (4,803) | 26.3 | 32.0 | (3,801) |
| Provisions (net) | (745) | (37.2) | (37.8) | (1,186) |
| Other gains (losses) | (292) | (39.5) | (40.1) | (482) |
| Profit/(loss) before tax | 6,931 | 8.4 | 18.1 | 6,392 |
| Income tax | (2,169) | 27.7 | 39.7 | (1,699) |
| Profit/(loss) for the year | 4,762 | 1.5 | 10.4 | 4,693 |
| Non-controlling interests | (1,243) | 2.0 | 19.1 | (1,218) |
| Net attributable profit | 3,519 | 1.3 | 7.6 | 3,475 |
| NNet attributable profit excluding results from corporate operations | 3,519 | 1.3 | 7.6 | 3,475 |
| Earning per share (euros) (1) | 0.48 | 0.49 | ||
| Net attributable profit without Telefónica and “mortgage floor clauses” impacts(2) | 4,642 | 19.7 | 26.3 | 3,879 |
- (1) Adjusted by additional Tier 1 instrument remuneration.
- (2) Excluding the impacts from the impairment losses from Telefónica in 2017 and the so-called "mortgage floor clauses" in 2016.
Gross income
Cumulative gross income grew by 7.9% year-on-year, once more strongly supported by the positive performance of the more recurring items.
Gross income (Million euros)
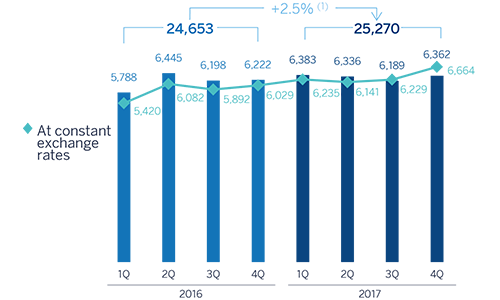
(1) At constant exchange rates: +7.9%.
Net interest income continued to grow, rising significantly in the fourth quarter by 8.4% and a cumulative 10.6% year-on-year. This positive trend was once again driven by growth in activity, above all in emerging economies, and good management of customer spreads. By business areas there was a positive performance in Turkey (up 20.6%), South America (up 15.1%), the United States (up 13.0%) and Mexico (up 9.5%). In Spain, although this line item grew in the fourth quarter, there was a slight decline in the figure for the year as a whole as a result of lower loan volumes and sales of wholesale portfolios.
Net interest income/ATAs (Percentage)

Cumulative net fees and commissions performed very well in all the Group's areas (up 9.4% year-on-year), strongly reflecting their appropriate diversification. The quarterly figure was also good (up 1.1% in the last three months).
As a result, more recurring revenues items (net interest income plus net fees and commissions) increased by 10.3% year-on-year (6.8% over the last three months).
Net interest income plus fees and commissions (Million euros)
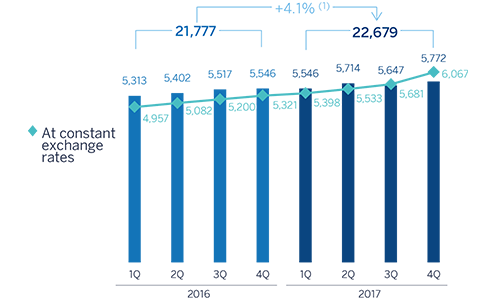
(1) At constant exchange rates: +10.3%.
Growth in NTI slowed in comparison with 2016 figures. This is basically due to lower sales of ALCO portfolios during this year.
The dividend income heading mainly includes income from the Group's stake in the Telefónica group. The year-on-year decline of 28.3% in this figure can be explained by the reduction in the dividend paid by Telefónica, as well as the inclusion of dividends from China Citic Bank (CNCB) in the second quarter of 2016.
Finally, other operating income and expenses increased by 2.8% in year-on-year terms. It should be noted that the net contribution of the insurance business remained flat (up 0.1%) due mainly to the high level of claim ratios as a result of the natural disasters occurred in Mexico.
Operating income
Operating expenses were kept in check to a year-on-year increase of 2.2%. The above is due to the cost discipline implemented in all areas of the Group through efficiency plans that are now yielding results, and the materialization of some synergies (mainly resulting from the integration of Catalunya Banc - CX -). By business areas there were notable reductions in Spain and the Rest of Eurasia. In the rest of the geographic areas (Mexico, Turkey, the United States and South America), the year-on-year rise in costs was below or in line with the local average inflation.
Operating expenses (Million euros)
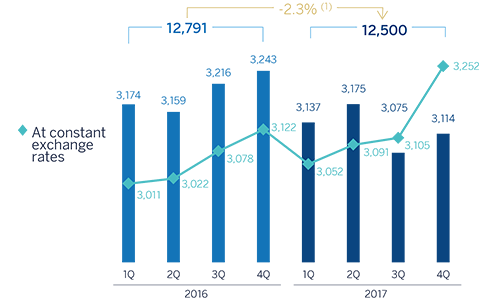
(1) At constant exchange rates: +2.2%.
As a result of the above, the efficiency ratio closed at 49.5%, below the figure of 51.9% in the previous year, and cumulative operating income rose by 14.1% over the last twelve months.
Breakdown of operating expenses and efficiency calculation (Million euros)
| 2017 | ∆% | 2016 | |
|---|---|---|---|
| Personnel expenses | 6,571 | (2.2) | 6,722 |
| Wages and salaries | 5,163 | (2.0) | 5,267 |
| Employee welfare expenses | 911 | (2.9) | 938 |
| Training expenses and other | 497 | (3.7) | 516 |
| Other administrative expenses | 4,541 | (2.2) | 4,644 |
| Property. fixtures and materials | 1,033 | (4.3) | 1,080 |
| IT | 1,018 | 5.2 | 968 |
| Communications | 269 | (8.6) | 294 |
| Advertising and publicity | 352 | (11.4) | 398 |
| Corporate expenses | 110 | 5.8 | 104 |
| Other expenses | 1,301 | (4.8) | 1,367 |
| Levies and taxes | 456 | 5.5 | 433 |
| Administration costs | 11,112 | (2.2) | 11,366 |
| Depreciation | 1,387 | (2.7) | 1,426 |
| Operating expenses | 12,500 | (2.3) | 12,791 |
| Gross income | 25,270 | 2.5 | 24,653 |
| Efficiency ratio (operating expenses/gross income; %) | 49.5 | 51.9 |
Efficiency (Million euros) and efficiency ratio (Percentage)

Operating income (Million euros)
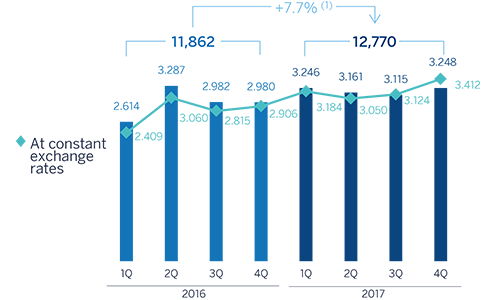
(1) At constant exchange rates: +14.1%.
Number of employees

Number of branches

Number of ATMs

Impairment on financial assests (net) (Million euros)
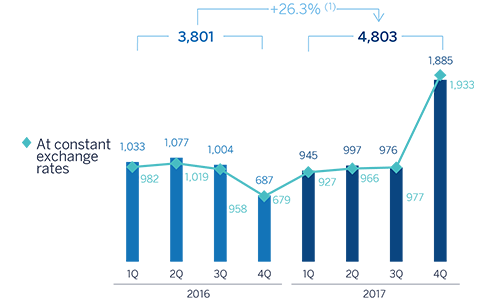
(1) At constant exchange rates: +32.0%.
Provisions and other
Impairment losses on financial assets of the year included the impairment losses of €1,123m from BBVA Group's stake from Telefónica, S.A, as a result of the evolution of the price of the latter and in compliance with the requirements of the accounting standard IAS 39. Excluding this impact, this figure is 1.2% higher than the one for 2016. By business areas, the most significant was a reduction in Banking activity in Spain due to lower loan-loss provisioning needs. In contrast, there was an increase in the United States due to the inclusion of provisions allocated as a result of the estimated negative effect of the natural disasters in the third quarter and higher loan-loss provisioning related to consumer portfolio. Turkey, Mexico and South America also saw an increase, largely linked to the increase in lending activity, and to a lesser extent, the impact of increased needs for insolvency provisions associated with some wholesale customers in the case of South America.
As a result of the above the cumulative cost of risk in 2017 (0.87%) was barely three basis points above the figure in 2016 (0.84%).
The fall of 38.5% in provisions (net) and other gains (losses) can be explained by the inclusion in the fourth quarter of 2016 of a charge of €577m (€404m after tax) to cover the contingency linked to the decision of the Court of Justice of the European Union (CJEU) on "mortgage floor clauses." This item includes items such as provisions for contingent liabilities, contributions to pension funds, the provision needs for property and foreclosed assets and restructuring costs.
Results
As a result, the Group's net attributable profit in 2017 was €3,519m, a year-on-year rise of 7.6%; not including the impairment Telefónica losses in 2017 and the aforementioned charge related to the so-called “mortgage floor clauses” in 2016, there was a rise of 26.3%. It is important to note that since March 2017 this figure has included the additional stake of 9.95% in the capital of Garanti, which has led to a positive impact of around €150m due to a reduction in the non-controlling interests heading.
By business area, banking activity in Spain generated a profit of €1,381m, Non-Core Real Estate generated a loss of €501m, the United States contributed a profit of €511m, Mexico €2,162m, Turkey €826m, South America €861m and the Rest of Eurasia €125m.
Net attributable profit (Million euros)
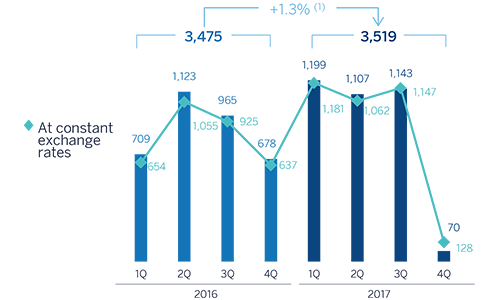
(1) At constant exchange rates: +7.6%.
Earning per share (1) (Euros)
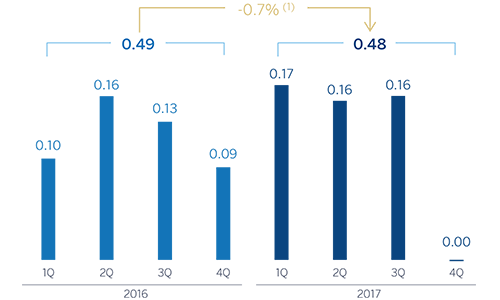
(1) Adjusted by additional Tier 1 instrument remuneration.
ROE and ROTE (1) (Percentage)

(1) The ROE and ROTE ratios include in the denominator the Group’s average shareholders’ funds, but do not take into account the caption within total equity named “Accumulated other comprehensive income” with an average balance of -€1,139m in 2015, -€4,492m in 2016 and -€7,015 in 2017
ROA and RORWA (Percentage)