Results
BBVA generated a net attributable profit of €1,340m in the first three months of 2018, which represents a year-on-year increase of 11.8% (up 22.3% at constant exchange rates). Once more highlights were the good performance of recurring revenue, containment of operating expenses and lower loan-loss provisions, which offset the lower contribution from net trading income (NTI) compared with the same period the previous year.
Consolidated income statement: quarterly evolution (Million euros)
| IFRS 9 | IAS 39 | ||||
|---|---|---|---|---|---|
| 2018 | 2017 | ||||
| 1Q | 4Q | 3Q | 2Q | 1Q | |
| Net interest income | 4,288 | 4,557 | 4,399 | 4,481 | 4,322 |
| Net fees and commissions | 1,236 | 1,215 | 1,249 | 1,233 | 1,223 |
| Net trading income | 410 | 552 | 347 | 378 | 691 |
| Dividend income | 12 | 86 | 35 | 169 | 43 |
| Share of profit or loss of entities accounted for using the equity method | 8 | 5 | 6 | (2) | (5) |
| Other operating income and expenses | 142 | (54) | 154 | 77 | 108 |
| Gross income | 6,096 | 6,362 | 6,189 | 6,336 | 6,383 |
| Operating expenses | (2,979) | (3,114) | (3,075) | (3,175) | (3,137) |
| Personnel expenses | (1,566) | (1,640) | (1,607) | (1,677) | (1,647) |
| Other administrative expenses | (1,106) | (1,143) | (1,123) | (1,139) | (1,136) |
| Depreciation | (307) | (331) | (344) | (359) | (354) |
| Operating income | 3,117 | 3,248 | 3,115 | 3,161 | 3,246 |
| Impairment on financial assets (net) | (823) | (1,885) | (976) | (997) | (945) |
| Provisions (net) | (99) | (180) | (201) | (193) | (170) |
| Other gains (losses) | 41 | (267) | 44 | (3) | (66) |
| Profit/(loss) before tax | 2,237 | 916 | 1,982 | 1,969 | 2,065 |
| Income tax | (611) | (499) | (550) | (546) | (573) |
| Profit/(loss) for the year | 1,626 | 417 | 1,431 | 1,422 | 1,492 |
| Non-controlling interests | (286) | (347) | (288) | (315) | (293) |
| Net attributable profit | 1,340 | 70 | 1,143 | 1,107 | 1,199 |
| Net attributable profit excluding results from corporate operations | 1,340 | 70 | 1,143 | 1,107 | 1,199 |
| Earning per share (euros) (1) | 0.19 | (0.00) | 0.16 | 0.16 | 0.17 |
- (1) Adjusted by additional Tier 1 instrument remuneration.
Consolidated income statement (Million euros)
| IFRS 9 | IAS 39 | |||
|---|---|---|---|---|
| 1Q 18 | ∆% | ∆% at constant exchange rates | 1Q 17 | |
| Net interest income | 4,288 | (0.8) | 9.3 | 4,322 |
| Net fees and commissions | 1,236 | 1.1 | 9.8 | 1,223 |
| Net trading income | 410 | (40.6) | (38.5) | 691 |
| Dividend income | 12 | (73.1) | (72.6) | 43 |
| Share of profit or loss of entities accounted for using the equity method | 8 | n.s. | n.s. | (5) |
| Other income and expenses | 142 | 32.2 | 43.4 | 108 |
| Gross income | 6,096 | (4.5) | 4.2 | 6,383 |
| Operating expenses | (2,979) | (5.0) | 3.2 | (3,137) |
| Personnel expenses | (1,566) | (5.0) | 3.3 | (1,647) |
| Other administrative expenses | (1,106) | (2.6) | 6.3 | (1,136) |
| Depreciation | (307) | (13.1) | (7.2) | (354) |
| Operating income | 3,117 | (4.0) | 5.1 | 3,246 |
| Impairment on financial assets not measured at fair value through profit or loss | (823) | (12.9) | (5.2) | (945) |
| Provisions or reversal of provisions | (99) | (41.7) | (41.3) | (170) |
| Other gains (losses) | 41 | n.s. | n.s. | (66) |
| Profit/(loss) before tax | 2,237 | 8.3 | 20.1 | 2,065 |
| Income tax | (611) | 6.5 | 17.3 | (573) |
| Profit/(loss) for the year | 1,626 | 9.0 | 21.1 | 1,492 |
| Non-controlling interests | (286) | (2.2) | 15.8 | (293) |
| Net attributable profit | 1,340 | 11.8 | 22.3 | 1,199 |
| Net attributable profit excluding results from corporate operations | 1,340 | 11.8 | 22.3 | 1,199 |
| Earning per share (euros) (1) | 0.19 | 0.17 | ||
- (1) Adjusted by additional Tier 1 instrument remuneration.
Unless expressly indicated otherwise, to better understand the changes in the main headings of the Group's income statement, the year-on-year percentage changes given below refer to constant exchange rates.
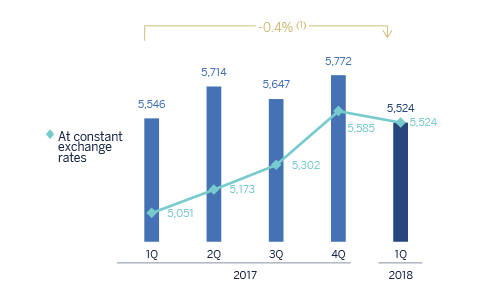
Gross income
Cumulative gross income grew by 4.2% year-on-year, once more strongly supported by the positive performance of the more recurring items.
Gross income (Million euros)

(1) At constant exchange rates: 4.2%.
Net interest income grew by 9.3% year-on-year. This positive trend can once again be explained by growth of activity in emerging economies and good management of customer spreads. Over the quarter it fell by 2.6%, largely due to the performance of inflation-linked bonds in Turkey from December 2017 to March 2018 and the seasonal nature of the first quarter each year compared with the fourth quarter of the immediately preceding year (which mainly affects Spain and Mexico).
Net interest income/ATAs (Percentage)

Cumulative net fees and commissions performed well in all the Group's areas (up 9.8% year-on-year), driven by good diversification. The quarterly figure was also good (up 4.5% in the last three months).
As a result, more recurring revenues items (net interest income plus net fees and commissions) increased by 9.4% year-on-year (down 1.1% over the last three months).
Net interest income plus fees and commissions (Million euros)
(1) At constant exchange rates: 9.4%.
NTI between January and March 2018 moderated in comparison with the same period of 2017, when it was exceptionally high, largely due to the registration of the capital gains of €204m before tax from the sale on the market of 1.7% of China Citic Bank (CNCB).
Finally, other operating income and expenses increased by 43.4% in year-on-year terms. Of note is that the net contribution of the insurance business rose by 0.4% over the same period and a 6.7% over the quarter.
Operating income
Operating expenses increased year-on-year by 3.2%, strongly affected by the exchange rates (down 5.0% at current exchange rates). The above is due to the cost discipline implemented in all the Group's areas through various efficiency plans. By business area the biggest reductions were in Spain and the rest of Eurasia and, over the quarter, in the United States and Mexico. In the rest of the geographic areas (Turkey and South America), the year-on-year rise in costs was below the local inflation rate.
Operating expenses (Million euros)

(1) At constant exchange rates: 3.2%.
Breakdown of operating expenses and efficiency calculation (Million euros)
| 1Q 18 | ∆% | 1Q 17 | |
|---|---|---|---|
| Personnel expenses | 1,566 | (5.0) | 1,647 |
| Wages and salaries | 1,220 | (4.8) | 1,282 |
| Employee welfare expenses | 234 | (3.7) | 243 |
| Training expenses and other | 111 | (9.1) | 122 |
| Other administrative expenses | 1,106 | (2.6) | 1,136 |
| Property. fixtures and materials | 249 | 3.0 | 265 |
| IT | 283 | 16.9 | 242 |
| Communications | 61 | (18.3) | 75 |
| Advertising and publicity | 83 | (7.9) | 90 |
| Corporate expenses | 23 | 1.3 | 22 |
| Other expenses | 287 | (8.9) | 315 |
| Levies and taxes | 120 | (4.6) | 126 |
| Administration costs | 2,672 | (4.0) | 2,783 |
| Depreciation | 307 | (13.1) | 354 |
| Operating expenses | 2,979 | (5.0) | 3,137 |
| Gross income | 6,096 | (4.5) | 6,383 |
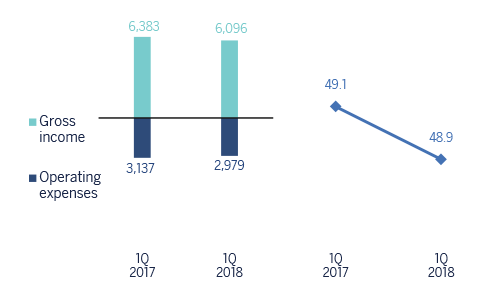
| Efficiency ratio (operating expenses/gross income; %) | 48.9 | 49.1 |
Number of employees

Number of branches

Number of ATMs

As a result of the above, the efficiency ratio closed at 48.9%, below the figure for the same period in 2017 (49.1%), and the cumulative operating income increased by 4.9% over the last twelve months.
Efficiency (Million euros) and efficiency ratio (Percentage)
Operating Income (Million euros)

(1) At constant exchange rates: 5.1%.
Provisions and other
Impairment losses on financial assets in the first three months of the year were 5.2% below the figure for the same period in 2017. By business area, they continued to fall in Spain, due to lower loan-loss provisioning requirements. They also fell in the United States, due to the lower provisioning requirements in retail portfolios affected by hurricanes in 2017 and, to a lesser extent, in Mexico. In contrast, they increased in Turkey, due to a temporary deterioration in wholesale customers, and in South America.
Impairment on financial assests (net) (Million euros)
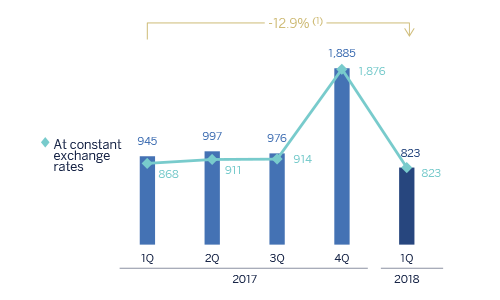
(1) At constant exchange rates: -5.2%.
Finally, there was a decline of 41.3% in provisions or reversal of provisions (hereinafter, provisions), while other gains (losses) registered a positive balance against the negative of the first quarter of 2017, which included a charge of 177 million euros for restructuring costs.
Results
As a result, the Group's net attributable profit continued to be very positive (up 22.3% year-on-year at constant exchange rates, 11.8% at current exchange rates).
By business area, banking activity in Spain generated a profit of €437m, Non-Core Real Estate a loss of only €27m, the United States contributed a profit of €195m, Mexico €571m, Turkey €201m, South America €210m and the Rest of Eurasia €47m.
Net attributable profit (Million euros)
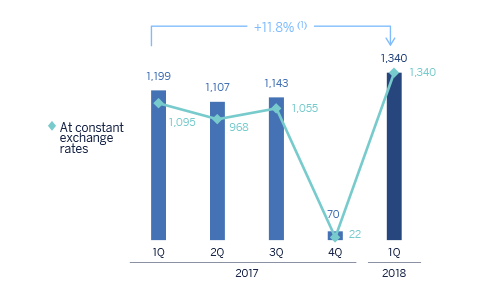
(1) At constant exchange rates: 22.3%.
Earning per share (1) (Euros)
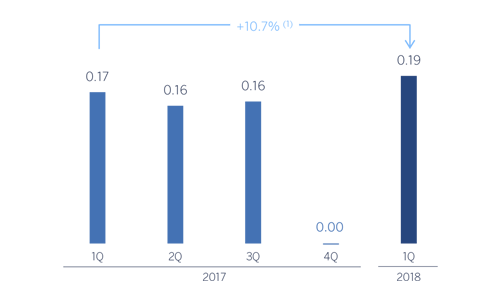
(1) Adjusted by additional Tier 1 instrument remuneration.
ROE and ROTE (1) (Percentage)

(1) The ROE and ROTE ratios include in the denominator the Group’s average shareholders’ funds and take into account another item within total equity with the heading “Accumulated other comprehensive income”. Excluding this item, the ROE would stand at 9.1% in the first quarter 2017, 6.4% in 2017 and 9.9% in the first quarter 2018 and the ROTE on 11.1%, 7.7% and 11.7%, respectively.
ROA and RORWA (Percentage)
