
Balance sheet and business activity
The most relevant aspects of the Group's balance sheet and business activity as of September 30, 2019 are summarized below:
- Loans and advances to customers (gross) increased by 1.3% during the first nine months of 2019, with increases in the business areas of Mexico, and, to a lesser extent, South America and Rest of Eurasia.
- Non-performing loans increased by 2.3% in the quarter and is in line with the balance as of December 31, 2018. This quarterly increase is the result of the higher balance registered in Turkey. The year-on-year comparison fell by 3.4%, mainly due to the sales of non-performing loan portfolios in Spain.
- In customer deposits, overall good performance in the third quarter in both time deposits and demand deposits (up 1.4% and 0.5%, respectively). In the year-on-year comparison and compared to the balance as of December 31, 2018, the fall in time deposits was more than offset by the increase in demand deposits balances.
- Off-balance sheet funds grew by 7.8% compared to December 31, 2018, thanks to the good performance of both mutual funds and pension funds.
- In tangible assets, the balance as of September 30, 2019 was primarily affected by the implementation of IFRS 16 "Leases," which led to a growth of 41.2% compared to the end of the previous financial year.
- The figure for other assets/other liabilities at the end of September 2019 includes the assets and liabilities of BBVA Paraguay, which have been classified as non-current assets and liabilities held for sale in the consolidated public balance sheet, once the BBVA Group made public through a relevant event to the Spanish Securities Market Commission (hereinafter CNMV for its acronym in Spanish) the sales agreement, aforementioned in the relevant events section.
Consolidated balance sheet (Millions of euros)
| 30-09-19 | ∆% | 31-12-18 | 30-09-18 | |
|---|---|---|---|---|
| Cash, cash balances at central banks and other demand deposits | 40,932 | (29.7) | 58,196 | 44,800 |
| Financial assets held for trading | 110,874 | 23.0 | 90,117 | 90,405 |
| Non-trading financial assets mandatorily at fair value through profit or loss | 5,209 | 1.4 | 5,135 | 4,692 |
| Financial assets designated at fair value through profit or loss | 1,400 | 6.6 | 1,313 | 1,302 |
| Financial assets at fair value through accumulated other comprehensive income | 63,275 | 12.3 | 56,337 | 61,602 |
| Financial assets at amortized cost | 437,792 | 4.3 | 419,660 | 417,893 |
| Loans and advances to central banks and credit institutions | 19,655 | 50.0 | 13,103 | 15,355 |
| Loans and advances to customers | 378,775 | 1.3 | 374,027 | 370,496 |
| Debt securities | 39,363 | 21.0 | 32,530 | 32,042 |
| Investments in subsidiaries, joint ventures and associates | 1,550 | (1.8) | 1,578 | 972 |
| Tangible assets | 10,208 | 41.2 | 7,229 | 6,688 |
| Intangible assets | 8,508 | 2.3 | 8,314 | 8,213 |
| Other assets | 29,269 | 1.6 | 28,809 | 32,417 |
| Total assets | 709,017 | 4.8 | 676,689 | 668,985 |
| Financial liabilities held for trading | 92,407 | 14.4 | 80,774 | 81,810 |
| Other financial liabilities designated at fair value through profit or loss | 9,583 | 37.0 | 6,993 | 6,782 |
| Financial liabilities at amortized cost | 518,215 | 1.8 | 509,185 | 501,439 |
| Deposits from central banks and credit institutions | 60,554 | 2.2 | 59,259 | 62,339 |
| Deposits from customers | 379,333 | 0.9 | 375,970 | 365,687 |
| Debt certificates | 63,324 | 3.6 | 61,112 | 62,022 |
| Other financial liabilities | 15,003 | 16.8 | 12,844 | 11,390 |
| Liabilities under insurance and reinsurance contracts | 10,834 | 10.2 | 9,834 | 9,994 |
| Other liabilities | 20,949 | 23.0 | 17,029 | 17,862 |
| Total liabilities | 651,988 | 4.5 | 623,814 | 617,888 |
| Non-controlling interests | 6,299 | 9.3 | 5,764 | 5,100 |
| Accumulated other comprehensive income | (6,114) | (15.3) | (7,215) | (7,358) |
| Shareholders’ funds | 56,844 | 4.6 | 54,326 | 53,355 |
| Total equity | 57,029 | 7.9 | 52,874 | 51,097 |
| Total liabilities and equity | 709,017 | 4.8 | 676,689 | 668,985 |
| Memorandum item: | ||||
| Guarantees given | 45,655 | 1.0 | 47,574 | 45,207 |
Loans and advances to customers (Millions of euros)
| 30-09-19 | ∆% | 31-12-18 | 30-09-18 | |
|---|---|---|---|---|
| Public sector | 27,782 | (2.5) | 28,504 | 28,702 |
| Individuals | 173,744 | 1.9 | 170,501 | 169,594 |
| Mortgages | 110,958 | (0.5) | 111,528 | 112,278 |
| Consumer | 35,144 | 0.6 | 34,939 | 34,190 |
| Credit cards | 14,469 | 7.1 | 13,507 | 12,527 |
| Other loans | 13,173 | 25.1 | 10,527 | 10,598 |
| Business | 173,410 | 1.5 | 170,872 | 167,771 |
| Non-performing loans | 16,337 | (0.1) | 16,348 | 17,045 |
| Loans and advances to customers (gross) | 391,273 | 1.3 | 386,225 | 383,111 |
| Loan-loss provisions | (12,499) | 2.5 | (12,199) | (12,614) |
| Loans and advances to customers | 378,775 | 1.3 | 374,027 | 370,496 |
Loans and advances to customers
(Gross. Billions of euros)
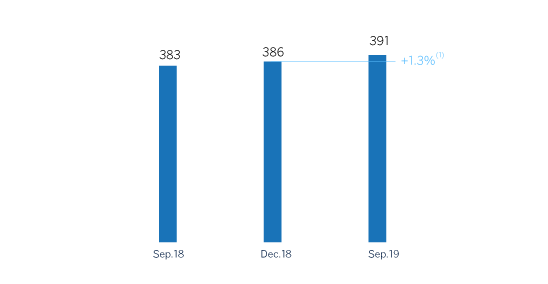
(1) At constant exchange rates: +0.2%.
Customer funds
(Billions of euros)
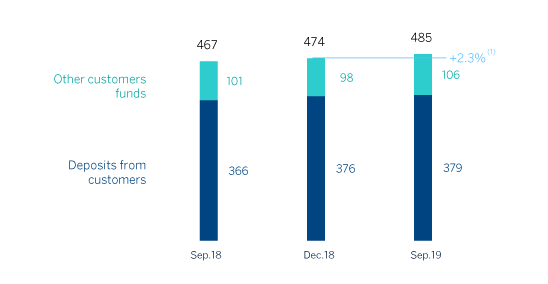
(1) At constant exchange rates: +1.3%.
Customer funds (Millions of euros)
| 30-09-19 | ∆% | 31-12-18 | 30-09-18 | |
|---|---|---|---|---|
| Deposits from customers | 379,333 | 0.9 | 375,970 | 365,687 |
| Current accounts | 272,729 | 4.7 | 260,573 | 251,666 |
| Time deposits | 100,147 | (7.5) | 108,313 | 107,458 |
| Other deposits | 6,457 | (8.9) | 7,084 | 6,564 |
| Other customer funds | 105,826 | 7.8 | 98,150 | 100,995 |
| Mutual funds and investment companies | 66,748 | 8.7 | 61,393 | 64,081 |
| Pension funds | 36,179 | 7.0 | 33,807 | 33,715 |
| Other off-balance sheet funds | 2,899 | (1.7) | 2,949 | 3,199 |
| Total customer funds | 485,159 | 2.3 | 474,120 | 466,683 |