Results
The BBVA Group generated a net attributable profit of €3,667m during the first nine months of 2019. This figure is 15.2% lower compared to the same period of the previous year (down 15.6% at constant exchange rates), which included the result of corporate operations generated by the capital gains (net of taxes) from the sale of BBVA Chile. Excluding the corporate operations from the 2018 comparison, the net attributable profit closed in line with the same period of the previous year (down 0.6% at current exchange rates, down 1.2% at constant exchange rates). In the third quarter of 2019, net attributable profit increased by 0.5% at constant exchange rates compared to the second quarter of the year (down 4.2% at current exchange rates). The good performance of net fees and commissions and, primarily, the strong performance of net trading income (NTI) in the quarter explain this increase.
Consolidated income statement: quarterly evolution (Millions of euros)
| 2019 | 2018 | ||||||
|---|---|---|---|---|---|---|---|
| 3Q | 2Q | 1Q | 4Q | 3Q | 2Q | 1Q | |
| Net interest income | 4,488 | 4,566 | 4,420 | 4,692 | 4,309 | 4,302 | 4,287 |
| Net fees and commissions | 1,273 | 1,256 | 1,214 | 1,226 | 1,173 | 1,244 | 1,236 |
| Net trading income | 351 | 116 | 426 | 316 | 212 | 285 | 410 |
| Other operating income and expenses | 22 | (18) | 8 | (83) | 38 | 6 | 92 |
| Gross income | 6,135 | 5,920 | 6,069 | 6,151 | 5,733 | 5,838 | 6,026 |
| Operating expenses | (2,946) | (2,952) | (2,922) | (2,981) | (2,825) | (2,921) | (2,975) |
| Personnel expenses | (1,572) | (1,578) | (1,553) | (1,557) | (1,459) | (1,539) | (1,565) |
| Other administrative expenses | (971) | (976) | (977) | (1,119) | (1,062) | (1,087) | (1,106) |
| Depreciation | (403) | (398) | (392) | (305) | (304) | (295) | (304) |
| Operating income | 3,189 | 2,968 | 3,147 | 3,170 | 2,908 | 2,917 | 3,050 |
| Impairment on financial assets not measured at fair value through profit or loss | (1,187) | (753) | (1,023) | (1,353) | (1,023) | (783) | (823) |
| Provisions or reversal of provisions | (113) | (117) | (144) | (66) | (123) | (85) | (99) |
| Other gains (losses) | (4) | (3) | (22) | (183) | (36) | 67 | 41 |
| Profit/(loss) before tax | 1,886 | 2,095 | 1,957 | 1,568 | 1,727 | 2,116 | 2,170 |
| Income tax | (488) | (577) | (559) | (421) | (419) | (605) | (617) |
| Profit/(loss) after tax from ongoing operations | 1,398 | 1,519 | 1,398 | 1,147 | 1,307 | 1,511 | 1,553 |
| Results from corporate operations (1) | - | - | - | - | 633 | - | - |
| Profit/(loss) for the year | 1,398 | 1,519 | 1,398 | 1,147 | 1,941 | 1,511 | 1,553 |
| Non-controlling interests | (173) | (241) | (234) | (145) | (154) | (265) | (262) |
| Net attributable profit | 1,225 | 1,278 | 1,164 | 1,001 | 1,787 | 1,245 | 1,290 |
| Net attributable profit excluding results from corporate operations | 1,225 | 1,278 | 1,164 | 1,001 | 1,154 | 1,245 | 1,290 |
| Earning per share (euros) (2) | 0.17 | 0.17 | 0.16 | 0.14 | 0.26 | 0.17 | 0.18 |
- General note: the application of accounting for hyperinflation in Argentina was performed for the first time in September 2018 with accounting effects on January 1, 2018, recording the impact of the 9 months in the third quarter. In order to make the 2019 information comparable to the 2018, the income statements for the first three quarters of 2018 have been reexpressed to reflect the impacts of inflation on their income and expenses.
- (1) Includes net capital gains from the sale of BBVA Chile.
- (2) Adjusted by additional Tier 1 instrument remuneration.
Consolidated income statement (Millions of euros)
| Jan.-Sep. 19 | ∆% | ∆% at constant exchange rates | Jan.-Sep. 18 | |
|---|---|---|---|---|
| Net interest income | 13,475 | 4.5 | 5.2 | 12,899 |
| Net fees and commissions | 3,743 | 2.4 | 2.9 | 3,653 |
| Net trading income | 893 | (1.5) | (0.3) | 907 |
| Other operating income and expenses | 13 | (90.8) | (90.3) | 136 |
| Gross income | 18,124 | 3.0 | 3.8 | 17,596 |
| Operating expenses | (8,820) | 1.1 | 1.4 | (8,721) |
| Personnel expenses | (4,703) | 3.1 | 3.5 | (4,563) |
| Other administrative expenses | (2,924) | (10.2) | (9.9) | (3,255) |
| Depreciation | (1,193) | 32.1 | 31.9 | (903) |
| Operating income | 9,304 | 4.8 | 6.1 | 8,875 |
| Impairment on financial assets not measured at fair value through profit or loss | (2,964) | 12.7 | 14.5 | (2,629) |
| Provisions or reversal of provisions | (373) | 21.7 | 24.3 | (307) |
| Other gains (losses) | (29) | n.s. | n.s. | 73 |
| Profit/(loss) before tax | 5,938 | (1.2) | (0.3) | 6,012 |
| Income tax | (1,623) | (1.1) | (0.9) | (1,641) |
| Profit/(loss) after tax from ongoing operations | 4,315 | (1.3) | (0.0) | 4,371 |
| Results from corporate operations (1) | - | - | - | 633 |
| Profit/(loss) for the year | 4,315 | (13.8) | (12.8) | 5,004 |
| Non-controlling interests | (648) | (5.0) | 7.1 | (682) |
| Net attributable profit | 3,667 | (15.2) | (15.6) | 4,323 |
| Net attributable profit excluding results from corporate operations | 3,667 | (0.6) | (1.2) | 3,689 |
| Earning per share (euros) (2) | 0.51 | 0.62 |
- (1) Includes net capital gains from the sale of BBVA Chile.
- (2) Adjusted by additional Tier 1 instrument remuneration.
Unless expressly indicated otherwise, to better understand the changes in the main headings of the Group's income statement, the year-on-year percentage changes provided below refer to constant exchange rates and the quarterly changes are for the quarter ending with respect to the previous quarter.
Gross income
Gross income showed a year-on-year growth of 3.8%, supported by the favorable performance of net interest income and, to a lesser extent, the growth of net fees and commissions.
Gross income (Millions of euros)
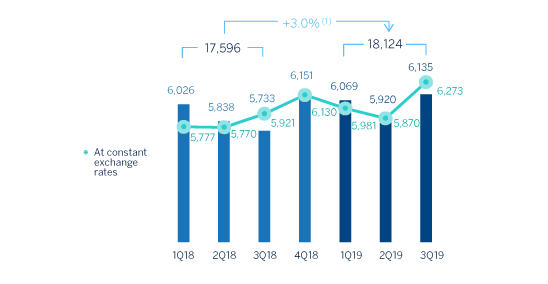
(1) At constant exchange rates: +3.8%.
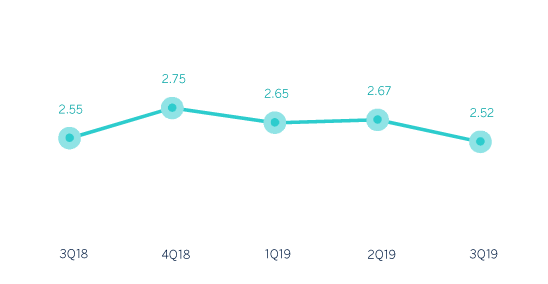
Net interest income grew by 5.2% year-on-year and 1.3% compared to the previous quarter. By business area and on year-on-year basis, it is important to highlight the good performance of Mexico, South America and Turkey.
Net interest income/ATAs (Percentage)
Cumulative net fees and commissions registered a positive performance with a growth of 2.9% year-on-year, influenced by their appropriate diversification. In the third quarter they grew by 2.8%.
As a result, recurring revenue items (net interest income plus net fees and commissions) increased by 4.7% year-on-year (up 1.7% over the quarter).
Net interest income plus fees and commissions (Millions of euros)
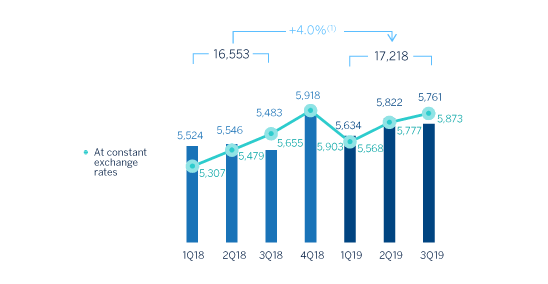
(1) At constant exchange rates: +4.7%.
NTI closed in line with the figures registered from January to September 2018 (down 0.3%), mainly explained by a lower contribution from the Global Markets unit and ALCO, partially offset by capital gains coming from the sale, in the first quarter of the year, of Prisma Medios de Pago, S.A. in Argentina. There was a greater contribution from NTI in the third quarter due to the good performance of foreign exchange transactions, especially in South America.
The other operating income and expenses improved in the third quarter, compared to the negative balance of the second quarter, as a result of BBVA's annual contribution in Spain to the Single Resolution Fund (SRF), which amounted to €144m. In the year-on-year comparison, the higher contribution to the SRF (€20m higher than in 2018), and especially the higher adjustment for hyperinflation in Argentina, explain the decrease of 90.3% compared to the same period of 2018, despite the higher net contribution coming from the insurance business (up 6.9% year-on-year).
Operating income
Operating expenses for the first nine months of 2019 increased by 1.4% compared to the same period of the previous year (1.1% at current exchange rates) with a variation below inflation levels registered in most of the countries where BBVA operates. During this period, the continued cost reductions in Spain stand out, as a result of the expense control plans. The decrease in South America was explained by the change in the perimeter resulting from the sale of BBVA Chile in the third quarter of 2018.
Operating expenses (Millions of euros)
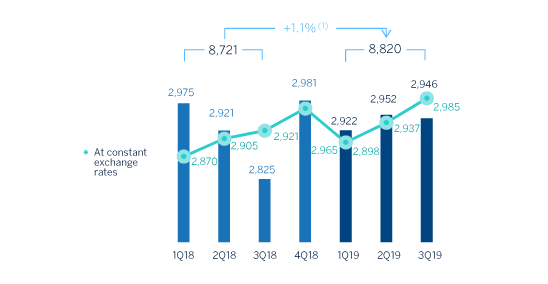
(1) At constant exchange rates: +1.4%.
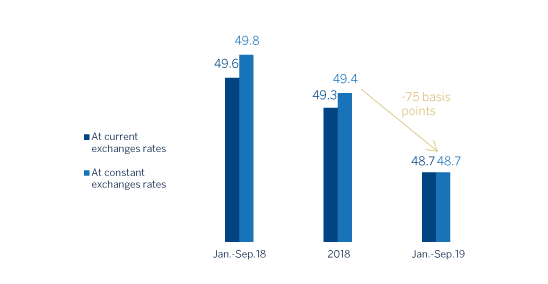
The efficiency ratio continued to improve as a result of expenses growing below gross income, which stood at 48.7% in the third quarter, significantly below the level reached at the end of September 2018 (49.6%). As a result of the aforementioned, operating income registered a year-on-year growth of 6.1%.
Efficiency ratio (Percentage)
Operating Income (Millions of euros)
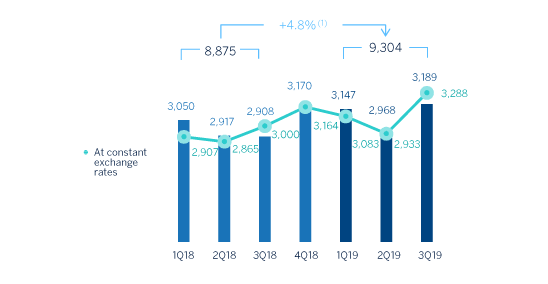
(1) At constant exchange rates: +6.1%.
Provisions and other
The impairment on financial assets not measured at fair value through profit or loss (impairment on financial assets) for the first nine months of the year, showed an increase of 14.5%. By business area, the United States recorded higher loanloss provisions for specific customers in the commercial portfolio and increased write-offs in consumer loans, in Turkey it is explained by the deterioration of retail customers portfolio, and in Mexico, mainly due to the consumer portfolio increase and impact of the deterioration in the macro scenario. On the other hand, Spain registered a decrease of 63.0% year-on-year for lower loan-loss provisions, mainly due to the positive effect of the sale of non-performing and write-offs portfolio, especially those carried out in the second quarter of 2019.
Impairment on financial assests (Millions of euros)
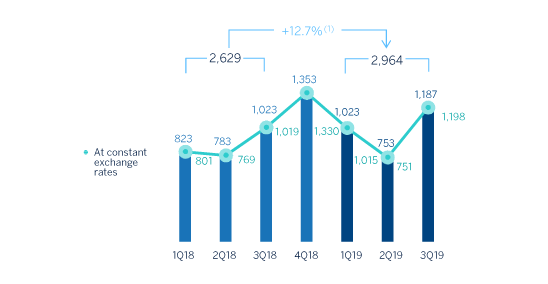
(1) At constant exchange rates: +14.5%.
Provisions or reversal of provisions (provisions) was 24.3% higher compared to the same period of 2018, due to higher provisions for guarantees and contingent commitments. Other gains (losses) registered a loss of €29m, compared to a positive contribution of €73m in September 2018, as a result of capital gains from certain sales of subsidiaries in Mexico, Turkey and the former business area of Non Core Real Estate carried out in 2018.
The results from corporate operations at the end of September 2018 stood at €633m and registered the capital gains (net of taxes) resulting from the sale of BBVA Chile stake.
Results
As a result of the above, the Group's net attributable profit during the first nine months of 2019 stood at €3,667m, 15.6% lower than in the same period of the previous year (down 15.2% at current exchange rates), featured by higher levels of recurring revenues but negatively impacted by higher loan-loss provisions requirements and the absence of corporate operations in the period.
Net attributable profit (Millions of euros)
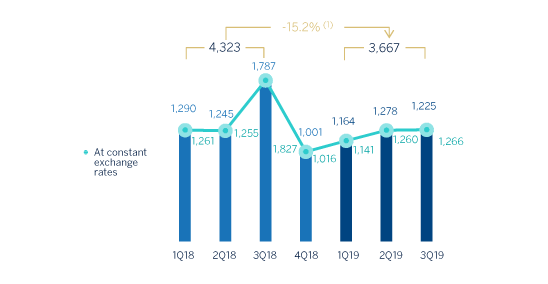
(1) At constant exchange rates: -15.6%.
By business areas, and in millions of euros, during the first nine months of the year Spain generated 1,064, the United States contributed 478, Mexico registered a profit of 1,965, Turkey contributed 380, South America registered a profit of 569 and Rest of Eurasia contributed 103.
Tangible book value per share and dividends (1) (Euros)
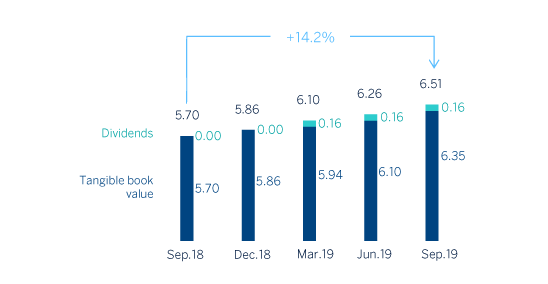
(1) Replenishing dividends paid in the period.
Earning per share (1) (Euros)
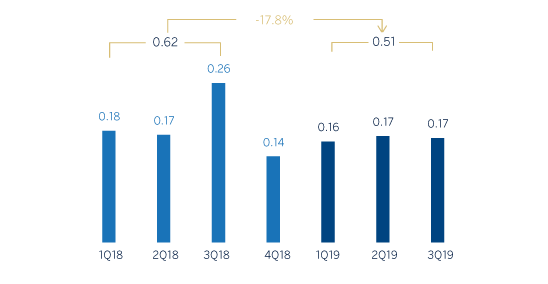
(1) Adjusted by additional Tier 1 instrument remuneration.
ROE and ROTE (1) (Percentage)
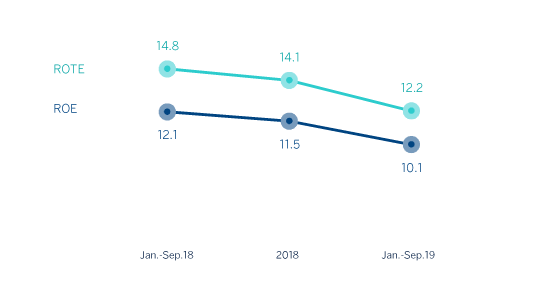
(1) The ROE and ROTE ratios include, in the denominator, the Group’s average shareholders’ funds and take into account the item called “Accumulated other comprehensive income”, which forms part of the equity. Excluding this item, the ROE would stand at 10.6% in January-September of 2018, 10.1% in 2018 and 8.8% in January-September of 2019; and the ROTE on 12.6%, 11.9% and 10.4%, respectively.
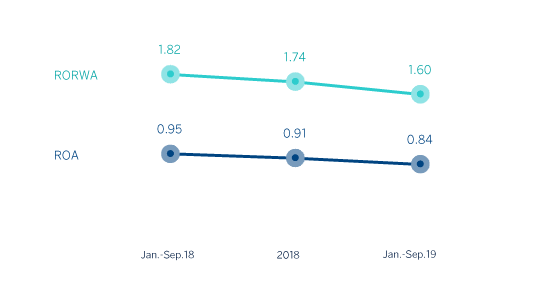
ROA and RORWA (Percentage)