
Results
The BBVA Group generated a net attributable profit of €3,512m in 2019. The good performance of the most recurrent revenue (net interest income plus net commissions and fees) and the net trading income (NTI), were offset by a greater adjustment for hyperinflation in Argentina, reflected in the line of other operating income and expenses, a greater amount of impairment on financial assets, greater provisions and, in particular, the goodwill impairment in the United States in December 2019 for an amount of €1,318m, reflected in the line of other gains (losses). The comparison with the previous year (down 35.0%) is influenced, on the one hand, by the above-mentioned goodwill impairment in the United States and on the other, by the positive impact generated by the capital gains (net of taxes) from the sale of BBVA Chile in 2018. In a more homogeneous comparison, without taking into account these two impacts and excluding the profit generated by BBVA Chile until its sale, the net attributable profit from 2019 was 2.7% higher than the previous year (up 2.0% at constant exchange rates).
Consolidated income statement: quarterly evolution (Millions of euros)
| 2019 | 2018 | |||||||
|---|---|---|---|---|---|---|---|---|
| 4Q | 3Q | 2Q | 1Q | 4Q | 3Q | 2Q | 1Q | |
| Net interest income | 4,727 | 4,488 | 4,566 | 4,420 | 4,692 | 4,309 | 4,302 | 4,287 |
| Net fees and commissions | 1,290 | 1,273 | 1,256 | 1,214 | 1,226 | 1,173 | 1,244 | 1,236 |
| Net trading income | 490 | 351 | 116 | 426 | 316 | 212 | 285 | 410 |
| Other operating income and expenses | (89) | 22 | (18) | 8 | (83) | 38 | 6 | 92 |
| Gross income | 6,418 | 6,135 | 5,920 | 6,069 | 6,151 | 5,733 | 5,838 | 6,026 |
| Operating expenses | (3,082) | (2,946) | (2,952) | (2,922) | (2,981) | (2,825) | (2,921) | (2,975) |
| Personnel expenses | (1,637) | (1,572) | (1,578) | (1,553) | (1,557) | (1,459) | (1,539) | (1,565) |
| Other administrative expenses | (1,039) | (971) | (976) | (977) | (1,119) | (1,062) | (1,087) | (1,106) |
| Depreciation | (406) | (403) | (398) | (392) | (305) | (304) | (295) | (304) |
| Operating income | 3,335 | 3,189 | 2,968 | 3,147 | 3,170 | 2,908 | 2,917 | 3,050 |
| Impairment on financial assets not measured at fair value through profit or loss | (1,187) | (1,187) | (753) | (1,023) | (1,353) | (1,023) | (783) | (823) |
| Provisions or reversal of provisions | (243) | (113) | (117) | (144) | (66) | (123) | (85) | (99) |
| Other gains (losses) | (1,444) | (4) | (3) | (22) | (183) | 831 | 67 | 41 |
| Profit/(loss) before tax | 460 | 1,886 | 2,095 | 1,957 | 1,568 | 2,593 | 2,116 | 2,170 |
| Income tax | (430) | (488) | (595) | (541) | (411) | (624) | (585) | (599) |
| Profit/(loss) for the year | 31 | 1,398 | 1,500 | 1,416 | 1,157 | 1,969 | 1,531 | 1,570 |
| Non-controlling interests | (186) | (173) | (241) | (234) | (145) | (154) | (265) | (262) |
| Net attributable profit | (155) | 1,225 | 1,260 | 1,182 | 1,012 | 1,815 | 1,266 | 1,308 |
| Earning per share (euros) (1) | (0.04) | 0.17 | 0.17 | 0.16 | 0.14 | 0.26 | 0.17 | 0.18 |
| Of which: | ||||||||
| Goodwill impairment in the United States | (1,318) | |||||||
| BBVA Chile (2) | 633 | 35 | 29 | |||||
| Net attributable profit excluding the goodwill impairment in the United States and BBVA Chile | 1,163 | 1,225 | 1,260 | 1,182 | 1,012 | 1,182 | 1,231 | 1,279 |
| Earning per share excluding the goodwil impairment in the United States and BBVA Chile (euros) (1) | 0.16 | 0.17 | 0.17 | 0.16 | 0.14 | 0.16 | 0.17 | 0.17 |
- General note: the application of accounting for hyperinflation in Argentina was done for the first time in September 2018 with accounting effects from January 1, 2018, recording the impact of the 9 months in the third quarter. In addition, during 2019 an amendment to IAS 12 "Income Taxes" was introduced with accounting effects from January 1, 2019. Therefore, in order to make the information comparable, the quarterly income statements for 2019 and 2018 have been restated.
- (1) Adjusted by additional Tier 1 instrument remuneration.
- (2) Earnings generated by BBVA Chile until its sale on July 6, 2018 and the capital gains from the operation.
Consolidated income statement (Millions of euros)
| 2019 | ∆% | ∆% at constant exchange rates | 2018 | |
|---|---|---|---|---|
| Net interest income | 18,202 | 3.5 | 4.3 | 17,591 |
| Net fees and commissions | 5,033 | 3.2 | 3.6 | 4,879 |
| Net trading income | 1,383 | 13.1 | 15.4 | 1,223 |
| Other operating income and expenses | (77) | n.s. | n.s. | 54 |
| Gross income | 24,542 | 3.3 | 4.2 | 23,747 |
| Operating expenses | (11,902) | 1.7 | 2.2 | (11,702) |
| Personnel expenses | (6,340) | 3.6 | 4.2 | (6,120) |
| Other administrative expenses | (3,963) | (9.4) | (8.9) | (4,374) |
| Depreciation | (1,599) | 32.4 | 32.1 | (1,208) |
| Operating income | 12,639 | 4.9 | 6.1 | 12,045 |
| Impairment on financial assets not measured at fair value through profit or loss | (4,151) | 4.3 | 6.0 | (3,981) |
| Provisions or reversal of provisions | (617) | 65.3 | 66.7 | (373) |
| Other gains (losses) | (1,473) | n.s. | n.s. | 755 |
| Profit/(loss) before tax | 6,398 | (24.2) | (23.8) | 8,446 |
| Income tax | (2,053) | (7.5) | (7.4) | (2,219) |
| Profit/(loss) for the year (1) | 4,345 | (30.2) | (29.7) | 6,227 |
| Non-controlling interests | (833) | 0.8 | 11.6 | (827) |
| Net attributable profit (1) | 3,512 | (35.0) | (35.3) | 5,400 |
| Earning per share (euros) (2) | 0.47 | 0.75 | ||
| Of which: | ||||
| Goodwill impairment in the United States | (1,318) | |||
| BBVA Chile (3) | 697 | |||
| Net attributable profit excluding the goodwill impairment in the United States and BBVA Chile |
4,830 | 2.7 | 2.0 | 4,703 |
| Earning per share excluding the goodwil impairment in the United States and BBVA Chile (euros) (2) |
0.66 | 0.64 |
- (1) As a result of the amendment to IAS 12 "Income Taxes", and in order to make the information comparable, the 2018 income statement has been restated.
- (2) Adjusted by additional Tier 1 instrument remuneration.
- (3) Earnings generated by BBVA Chile until its sale on July 6, 2018 and the capital gains from the operation.
Unless expressly indicated otherwise, to better understand the changes in the main headings of the Group's income statement, the year-on-year percentage changes provided below refer to constant exchange rates and the quarterly changes are for the quarter ending with respect to the previous quarter.
Gross income
Gross income showed a year-on-year growth of 4.2%, supported by the favorable performance of the net interest income and the NTI and, to a lesser extent, the growth in net fees and commissions.
Gross income (Millions of euros)

(1) At constant exchange rates: +4.2%.
Net interest income grew by 4.3% year-on-year and 4.4% compared to the previous quarter. By business areas, Mexico and South America had notable year-on-year performance.
Net fees and commissions also recorded a positive performance showing a year-on-year growth of 3.6%, thanks to the favorable contribution from all the business areas, in particular Turkey and Spain. In the fourth quarter, they grew by 0.7%.
As a result, the most recurrent revenue items increased by a 4.1% year-on-year (up 3.6% in the quarter).
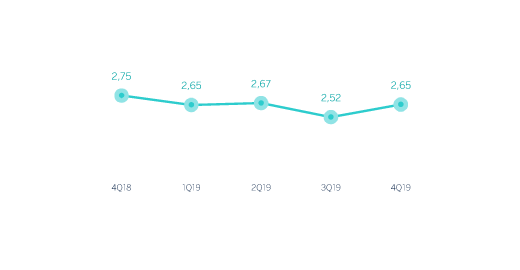
Net interest income/ATAs (Percentage)
Net interest income plus fees and commissions (Millions of euros)
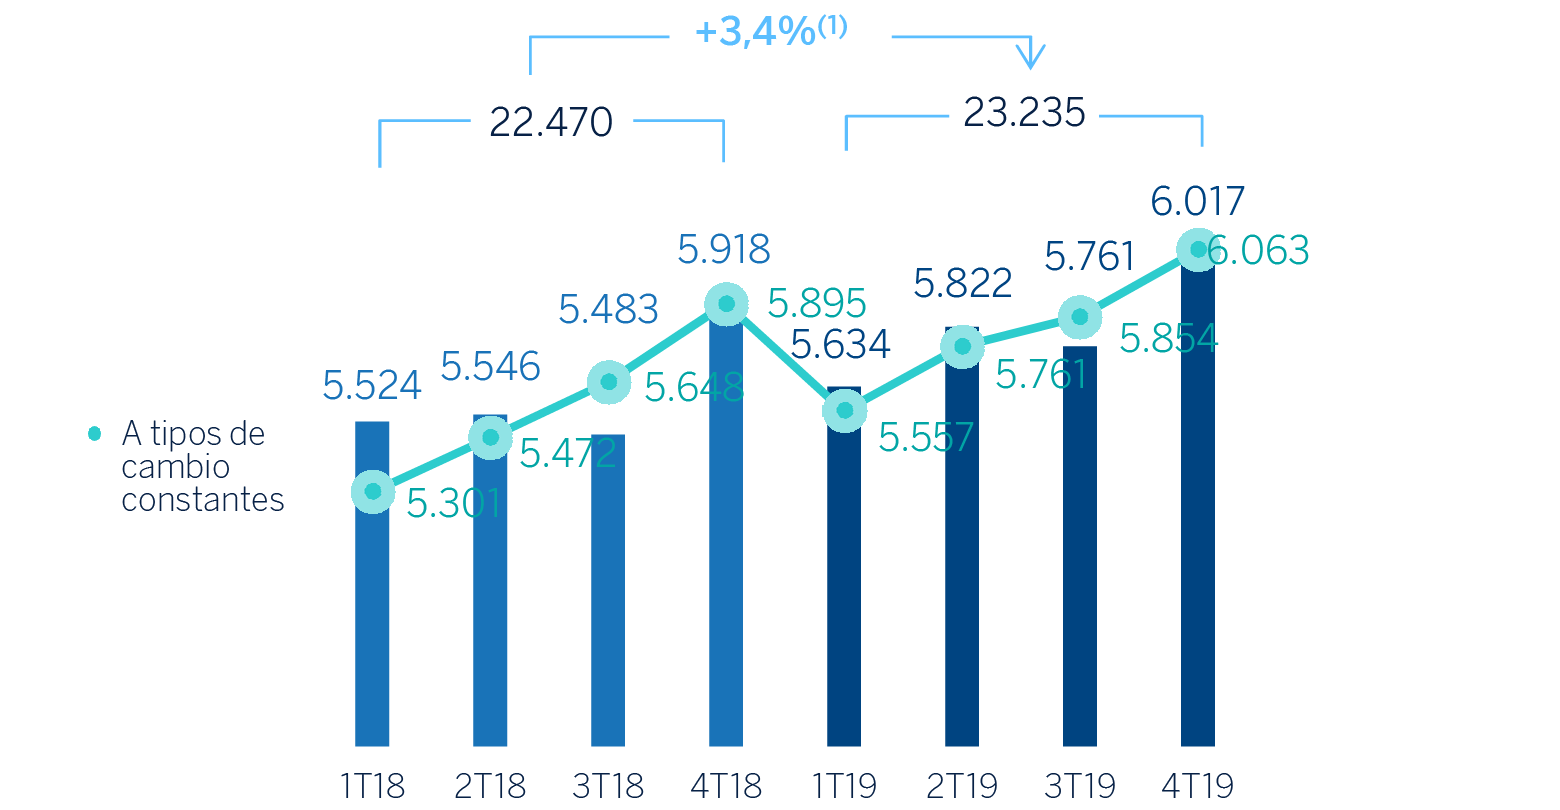
(1) At constant exchange rates: +4.1%.
NTI closed with an increase of 15.4% year-on-year and registered an excellent evolution in the last quarter of the year (up 31.8%) mainly explained by the results generated by Spain and Turkey.
The line of other operating income and expenses closed the year with a negative balance of €77m compared to the positive balance of €54m recorded in 2018, mainly due to the higher adjustment for hyperinflation in Argentina, as well as a greater contribution to the SRF (Single Resolution Fund) and the FGD (Deposit Guarantee Fund).
Operating income
Operating expenses increased 2.2% in 2019 (up 1.7% at current exchange rates) showing a lower growth compared to inflation in most of the countries where BBVA is present. Spain continued to show notable reduction in costs, resulting from the cost control plans.
Operating expenses (Millions of euros)

(1) At constant exchange rates: +2.2%.
The efficiency ratio continued to improve as a result of operating expenses growing below gross income, which stood at 48.5% at the end of the year, significantly below the level reached in 2018 (down 92 basis points at constant exchange rates). As a result of the aforementioned, the operating income registered a year-on-year growth of 6.1%.
Efficiency ratio (Percentage)

Operating Income (Millions of euros)
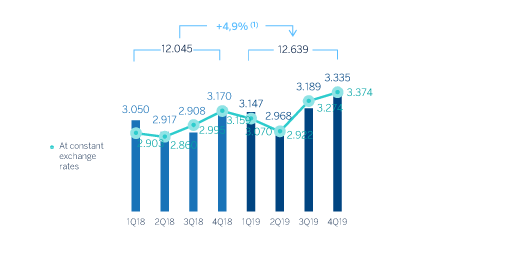
(1) At constant exchange rates: +6.1%.
Provisions and other
The impairment on financial assets not measured at fair value through profit or loss (impairment on financial assets) showed an increase of 6.0% in 2019. By business areas, it was notable the higher loan-loss provisions in the United States for specific clients of the commercial portfolio and the larger write-offs in the consumer portfolio in South America, (for Argentina and Peru), and to a lesser extent in Mexico, explained by the growth on this portfolio and the impact of the macro scenario deterioration. On the contrary, Spain recorded a 43.6% year-on-year reduction for lower provision requirements mainly due to the positive effect of non-performing and write-off portfolios sales in 2019.
Impairment on financial assests (Millions of euros)
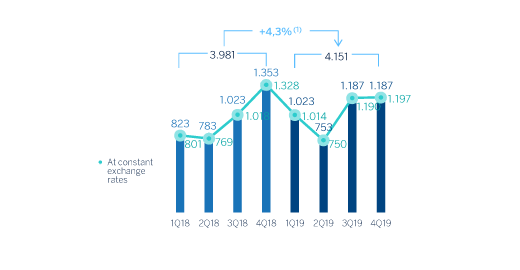
(1) At constant exchange rates: +6.0%.
Provisions or reversal of provisions (hereinafter, provisions) was 66.7% above the 2018 figure, mainly due to greater endowments in Turkey and Argentina. Other gains (losses) mainly reflects the already mentioned goodwill impairment in the United States closing with a loss of €-1,473m, compared with the profit of €755m in 2018, which mainly includes the capital gains from the sale of BBVA Chile.
Results
As a result of the above, the Group's net attributable profit in 2019 was €3,512m, 35.3% lower than the profit obtained the previous year (down 35.0% at current exchange rates). The comparison with respect to 2018 is influenced by the goodwill impairment in the United States and by the positive impact generated by the capital gains from the sale of BBVA Chile. In a more homogeneous comparison, without taking into account these two impacts and excluding the profit generated by the sale of BBVA Chile the net attributable profit from 2019 was 2.7% higher than the previous year (up 2.0% at constant exchange rates).
Net attributable profit (Millions of euros)

(1) At constant exchange rates: -35.3%.
Net attributable profit excluding BBVA Chile and The United States goodwill impairment (Millions of euros)
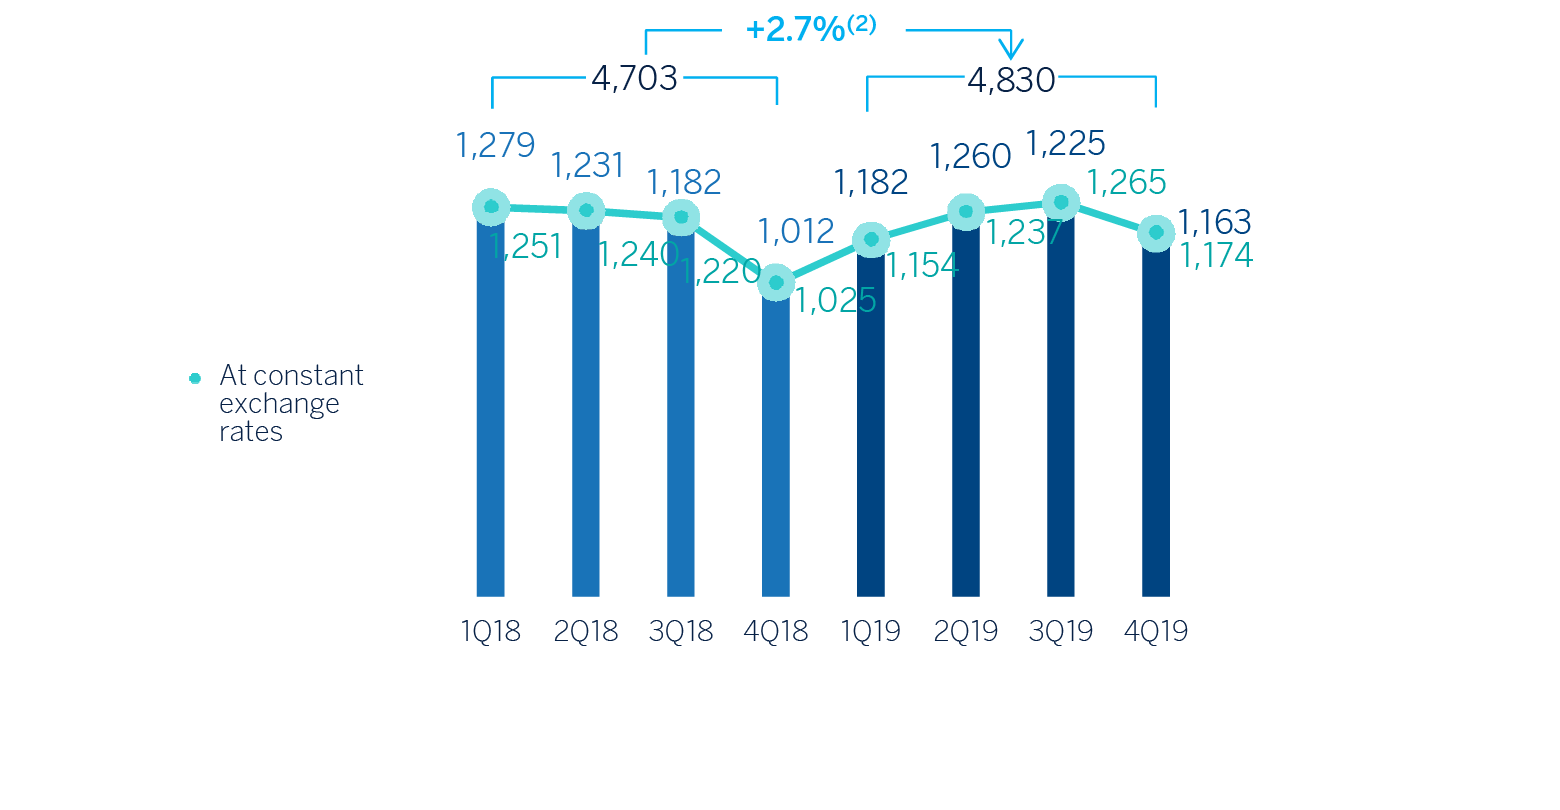
(1) At constant exchange rates: +2.0%.
By business areas, and in millions of euros, Spain generated 1,386, the United States 590, Mexico recorded 2,699 in profit, Turkey 506, South America 721 and the Rest of Eurasia 127.
Tangible book value per share and dividends (1) (Euros)

(1) Replenishing dividends paid in the period.
Earning per share (1) (Euros)
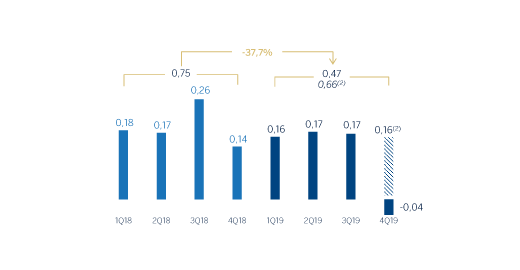
(1) Adjusted by additional Tier 1 instrument remuneration.
(2) Excluding the impairment in the United States goodwill.
ROE and ROTE (1) (Percentage)
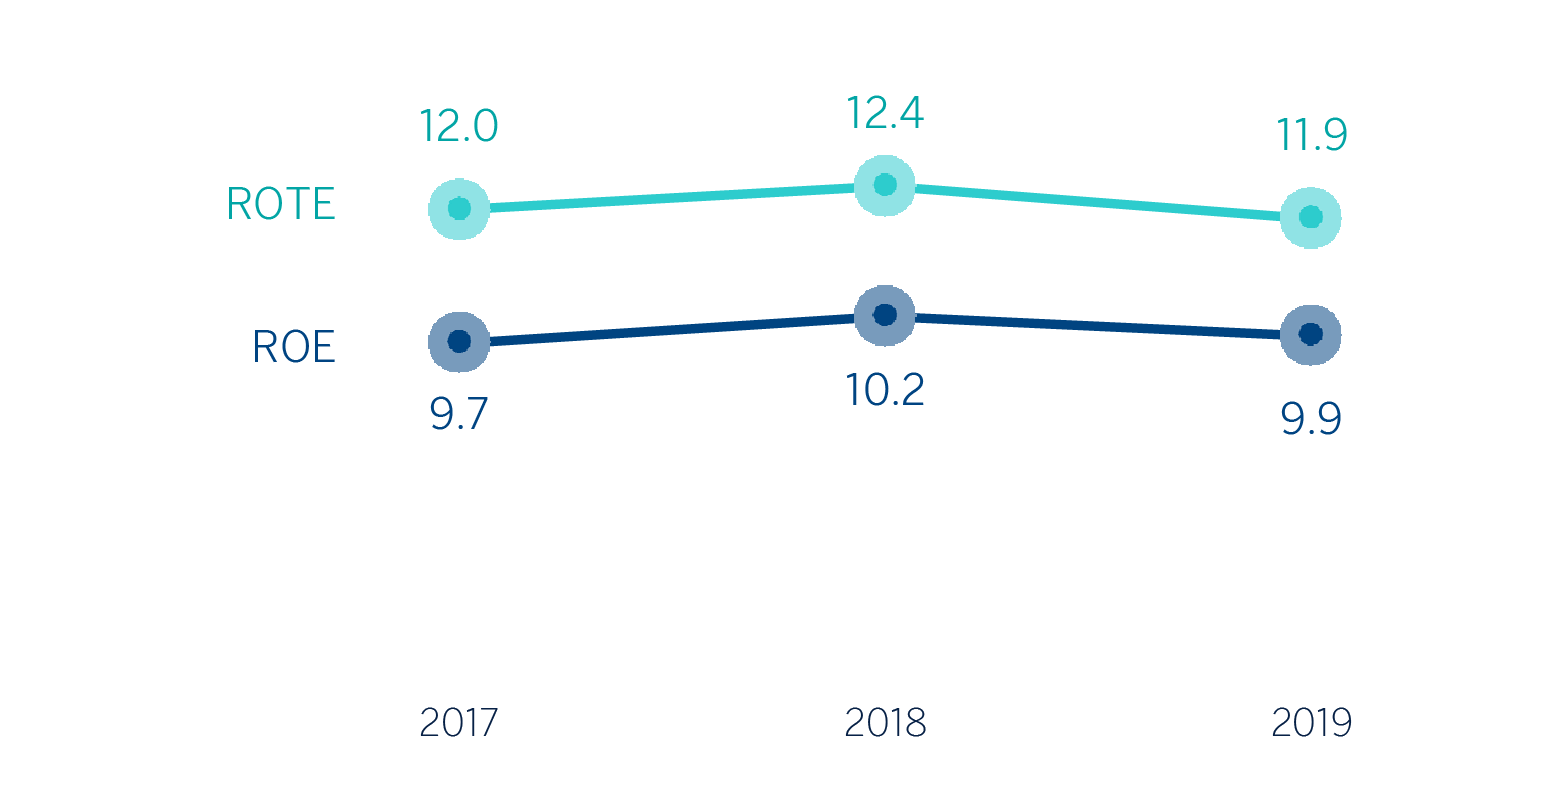
(1) Ratios excluding the impairment of Telefónica in 2017, BBVA Chile in 2018 and the goodwill impairment in the United States in 2019.
ROA and RORWA (Percentage)
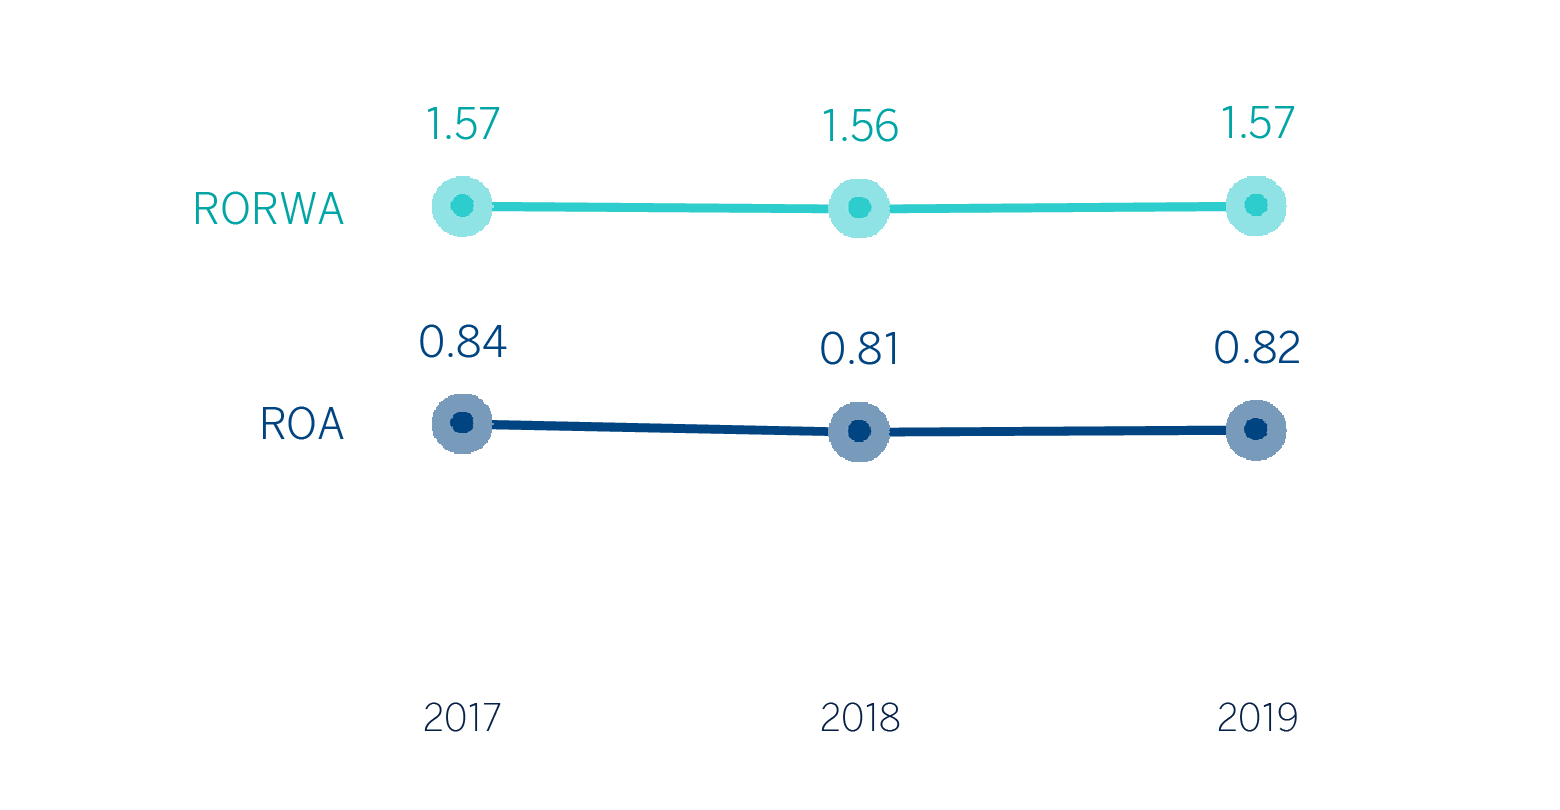
(1) Ratios excluding the impairment of Telefónica in 2017, BBVA Chile in 2018 and the goodwill impairment in the United States in 2019.