
Other information: Corporate & Investment Banking
Highlights
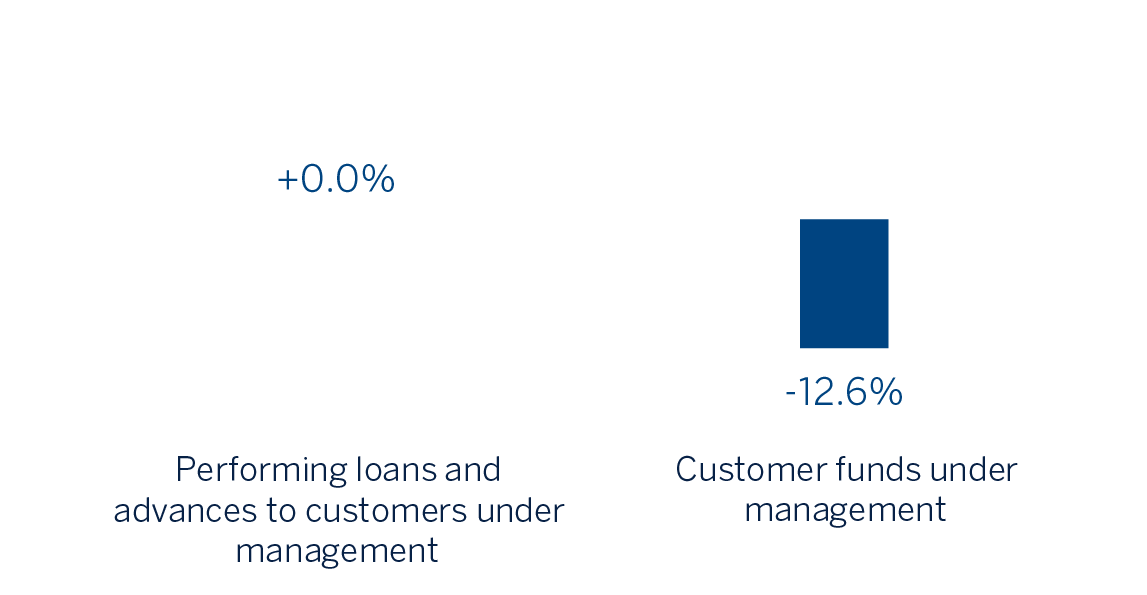
- Lending activity balances at pre-pandemic levels and reduced customer funds.
- Growth in the recurring income items and excellent performance of NTI.
- Efficiency ratio remains at low level.
- Significant reduction in the impairment on financial assets line.
Business activity (1)
(YEAR-TO-DATE-CHANGE)
(1) Excluding repos.
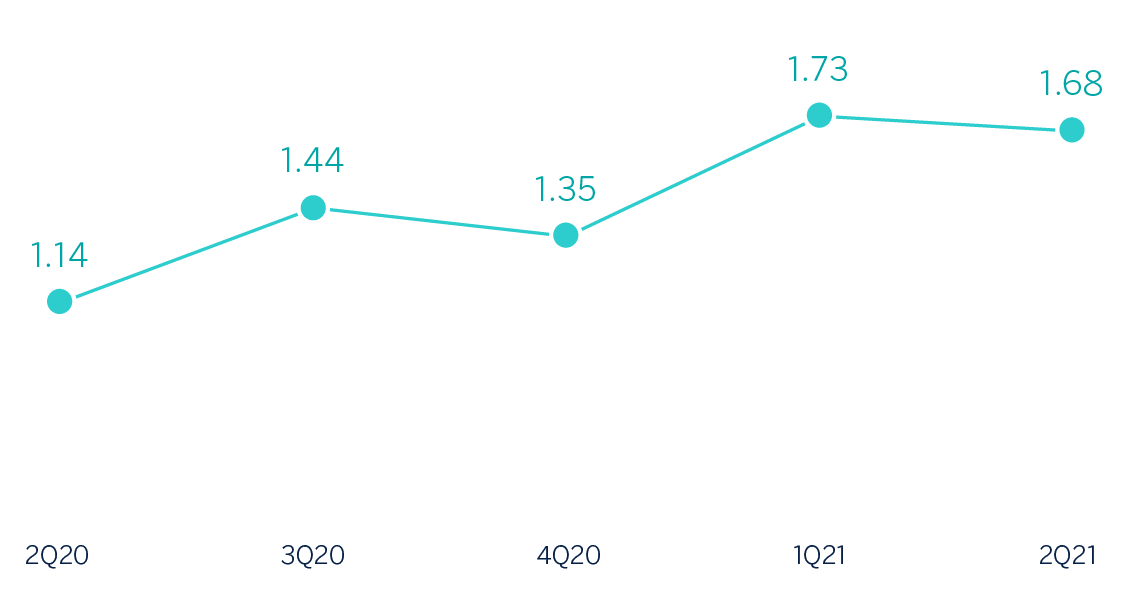
Gross income/ATAs
(Percentage. Constant exchange rates)
Operating income
(Millions of euros at constant exchange rates)
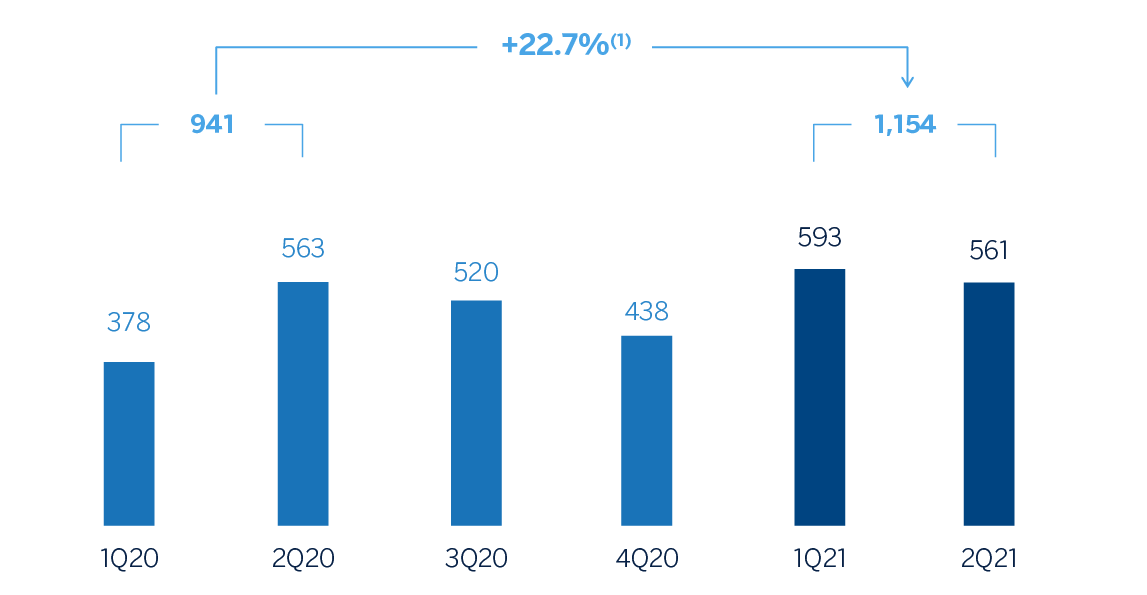
(1) At current exchange rates: +9.2%.
Net attributable profit
(Millions of euros at constant exchange rates)
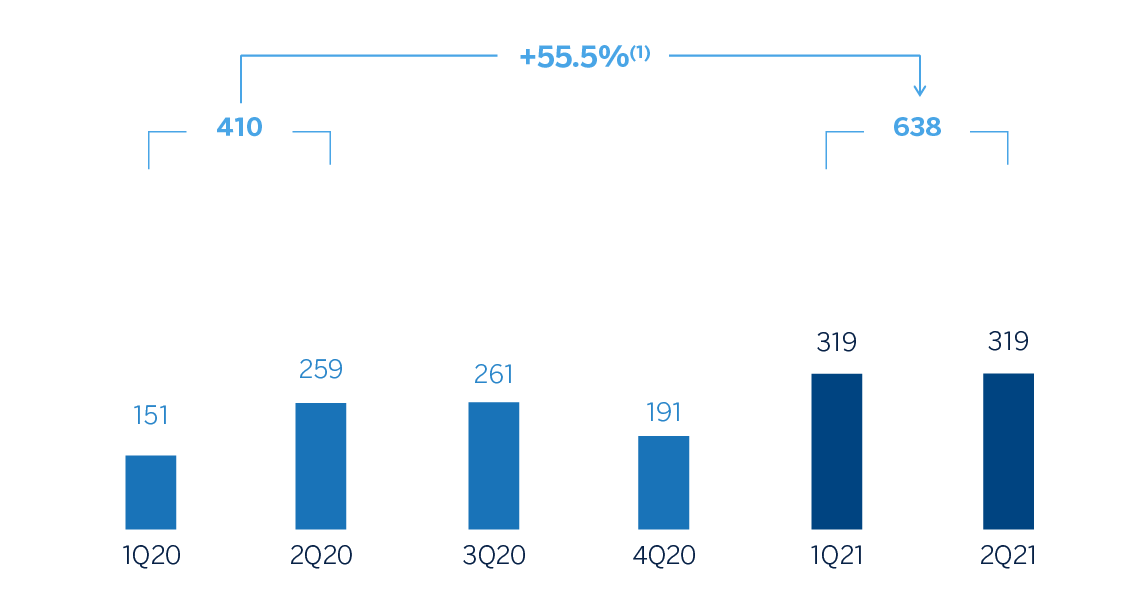
(1) At current exchange rates: +45.6%.
Financial statements and relevant business indicators (Millions of euros and percentage)
| Income statement | 1H21 | ∆% | ∆% (1) | 1H20 |
|---|---|---|---|---|
| Net interest income | 752 | (0.1) | 10.4 | 752 |
| Net fees and commissions | 386 | 0.7 | 9.0 | 384 |
| Net trading income | 500 | 27.3 | 40.9 | 393 |
| Other operating income and expenses | (18) | (13.7) | (9.3) | (21) |
| Gross income | 1,621 | 7.4 | 18.2 | 1,508 |
| Operating expenses | (466) | 3.3 | 8.4 | (451) |
| Personnel expenses | (212) | 9.1 | 13.4 | (195) |
| Other administrative expenses | (200) | 1.0 | 8.3 | (198) |
| Depreciation | (54) | (8.0) | (7.1) | (59) |
| Operating income | 1,154 | 9.2 | 22.7 | 1.,57 |
| Impairment on financial assets not measured at fair value through profit or loss | (54) | (83.1) | (79.6) | (318) |
| Provisions or reversal of provisions and other results | (16) | 3.3 | 4.2 | (16) |
| Profit/(loss) before tax | 1.084 | 50.0 | 63.9 | 723 |
| Income tax | (303) | 54.2 | 68.0 | (196) |
| Profit/(loss) for the period | 781 | 48.4 | 62.3 | 526 |
| Non-controlling interests | (143) | 62.3 | 101.5 | (88) |
| Net attributable profit/(loss) | 638 | 45.6 | 55.5 | 439 |
- (1) Figures at constant exchange rates.
| Balance sheets | 30-06-21 | ∆% | ∆% (1) | 31-12-20 |
|---|---|---|---|---|
| Cash, cash balances at central banks and other demand deposits | 4,749 | (36.6) | (37.7) | 7,491 |
| Financial assets designated at fair value | 110,732 | 0.5 | 0.2 | 110,217 |
| Of which Loans and advances | 38,444 | 23.3 | 23.5 | 31,183 |
| Financial assets at amortized cost | 68,486 | (3.6) | (2.8) | 71,031 |
| Of which loans and advances to customers | 57,870 | (2.3) | (1.2) | 59,225 |
| Inter-area positions | - | - | - | - |
| Tangible assets | 42 | (15.0) | (14.7) | 50 |
| Other assets | 2.355 | 179.3 | 208.7 | 843 |
| Total assets/liabilities and equity | 186,365 | (1.7) | (1.6) | 189,632 |
| Financial liabilities held for trading and designated at fair value through profit or loss | 85,085 | (2.8) | (3.2) | 87,508 |
| Deposits from central banks and credit institutions | 14,879 | (6.8) | (6.9) | 15,958 |
| Deposits from customers | 37,170 | (13.5) | (13.0) | 42,966 |
| Debt certificates | 2,713 | 29.5 | 31.3 | 2,096 |
| Inter-area positions | 33,856 | 12.0 | 13.5 | 30,218 |
| Other liabilities | 3,228 | 52.2 | 45.5 | 2,121 |
| Regulatory capital allocated | 9,435 | 7.6 | 9.5 | 8,766 |
- (1) Figures at constant exchange rates.
| Relevant business indicators | 30-06-21 | ∆% | ∆% (1) | 31-12-20 |
|---|---|---|---|---|
| Performing loans and advances to customers under management (2) | 57,079 | (1.1) | 0.0 | 57,704 |
| Non-performing loans | 1,882 | 47.7 | 62.7 | 1,275 |
| Customer deposits under management (2) | 36,524 | (13.7) | (13.2) | 42,313 |
| Off-balance sheet funds (3) | 1,090 | 5.8 | 11.2 | 1,030 |
| Efficiency ratio (%) | 28.8 | 31.4 |
- (1) Figures at constant exchange rates.
- (2) Excluding repos.
- (3) Includes mutual funds, pension funds and other off-balance sheet funds.
Unless expressly stated otherwise, all the comments below on rates of change, for both activity and results, will be given at constant exchange rates. These rates, together with changes at current exchange rates, can be found in the attached tables of financial statements and relevant business indicators.
Activity
The most relevant aspects related to the area's activity during the first half of 2021 were:
- Lending activity (performing loans under management) remained stable compared to the end of December 2020 and stood at pre-pandemic levels. By geographical areas, Turkey, Asia and South America showed a positive evolution in the first half of the year.
- Customer funds registered a fall of -12.6% for CIB as a whole in the first six months of 2021, due to the lower balances registered in Spain and Rest of Business.
Results
CIB generated a net attributable profit of €638m in the first half of 2021, up 55.5% from the previous year, thanks to recurring income growth in all geographic areas, higher NTI and lower provisions for impairment on financial assets, which increased significantly in the first half of 2020, mainly due to the worsening macroeconomic scenario resulting from the COVID-19 pandemic outbreak.
The most relevant aspects of the year-on-year evolution in the income statement for Corporate & Investment Banking are summarized below:
- Net interest income sustained double-digit growth (up 10.4%) due to the performance of the lending activity, with higher volumes and an improvement in profitability per transaction due to the sales effort.
- Growth was also observed in net fees and commissions (up 9.0%), mainly due to the performance of transactional banking. By geographic areas, Turkey, Mexico and South America stood out.
- NTI showed an excellent performance on a year-on-year comparison that benefited from a good management of the market turbulence. By geographic areas, the performance of Spain, Turkey and Peru stood out.
- The operating expense increased by 8.4% year-on-year, mainly affected by the supportive schemes implemented by the area in the second quarter of 2020.
- Provisions for impairment on financial assets decreased significantly compared with the same period last year, mainly due to the provisions related to COVID-19, which took place in the first half of 2020.