
Mexico
Highlights
- Growth in lending activity during the first half of the year, driven by the retail portfolio.
- Customer funds performed well, with growth in demand deposits and a shift from time deposits toward mutual funds.
- Increase in recurring income and strong operating income.
- Lower impairment losses on financial assets, due to the additional provisions for COVID-19 made in the first half of 2020.
Business activity (1)
(Year-to-date change, at a constant exchange
rate)
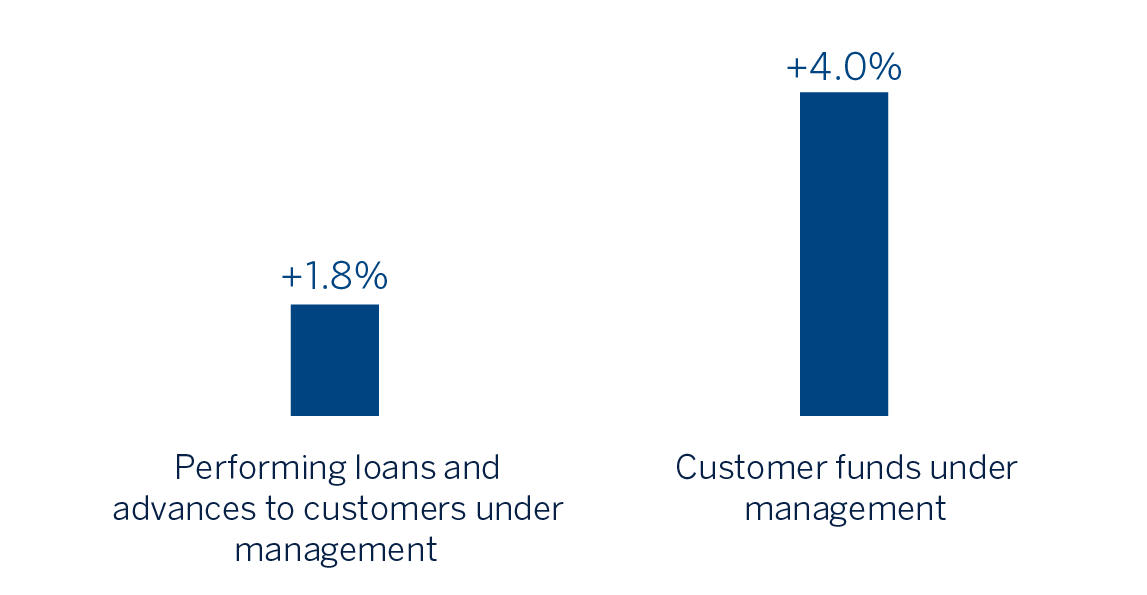
(1) Excluding repos.
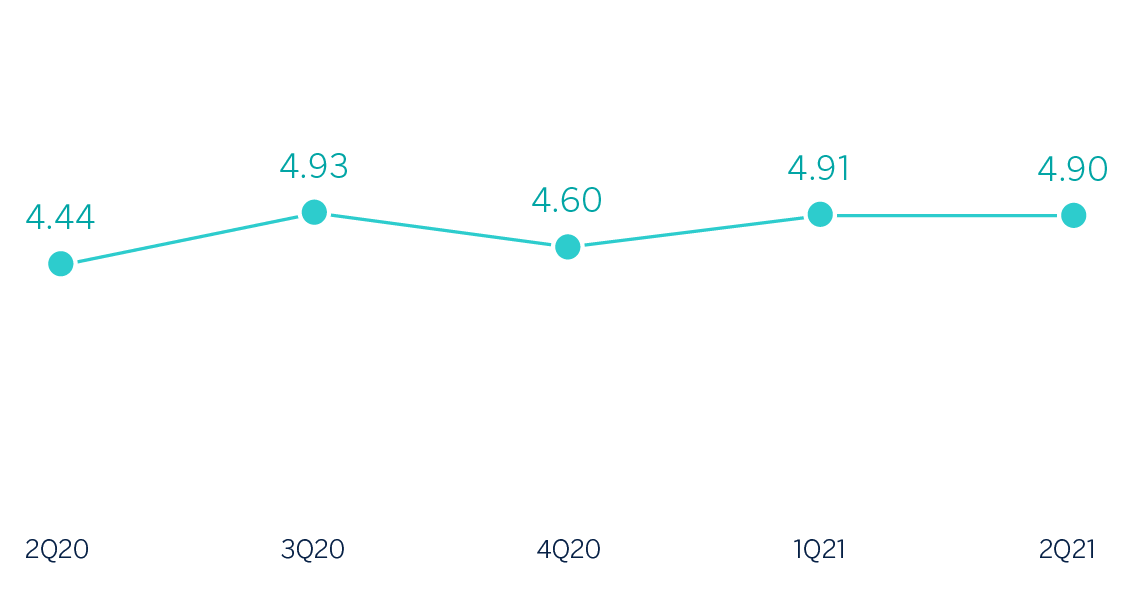
Net interest income/ATAs
(Percentage. Constant exchange rate)
Operating income
(Millions of euros at constant exchange rate)
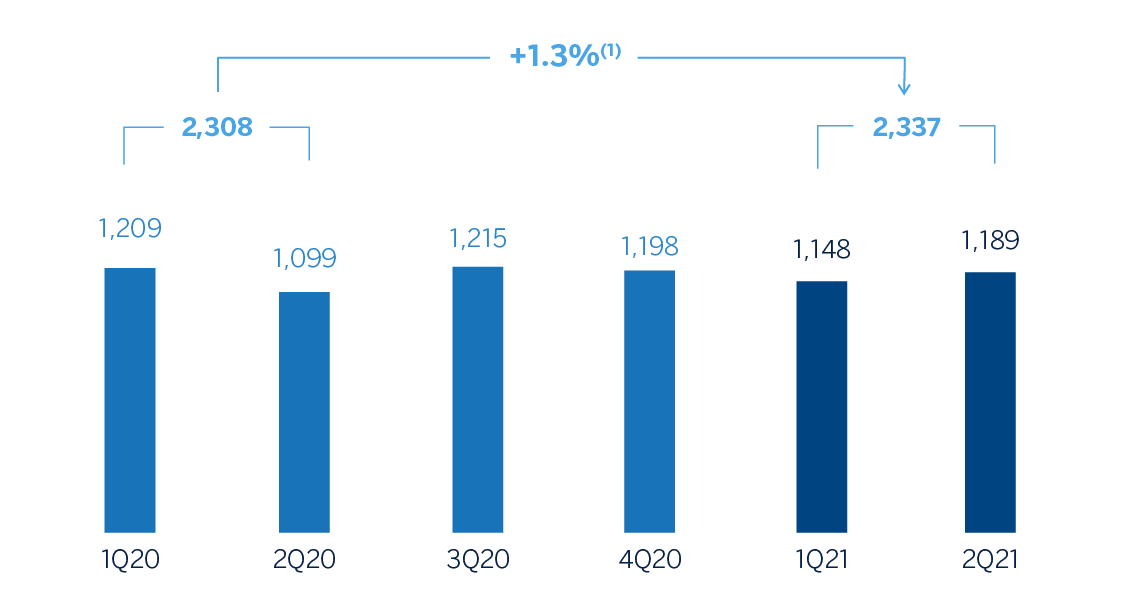
(1) At current exchange rate: -0.6%.
Net attributable profit
(Millions of euros at constant exchange rate)
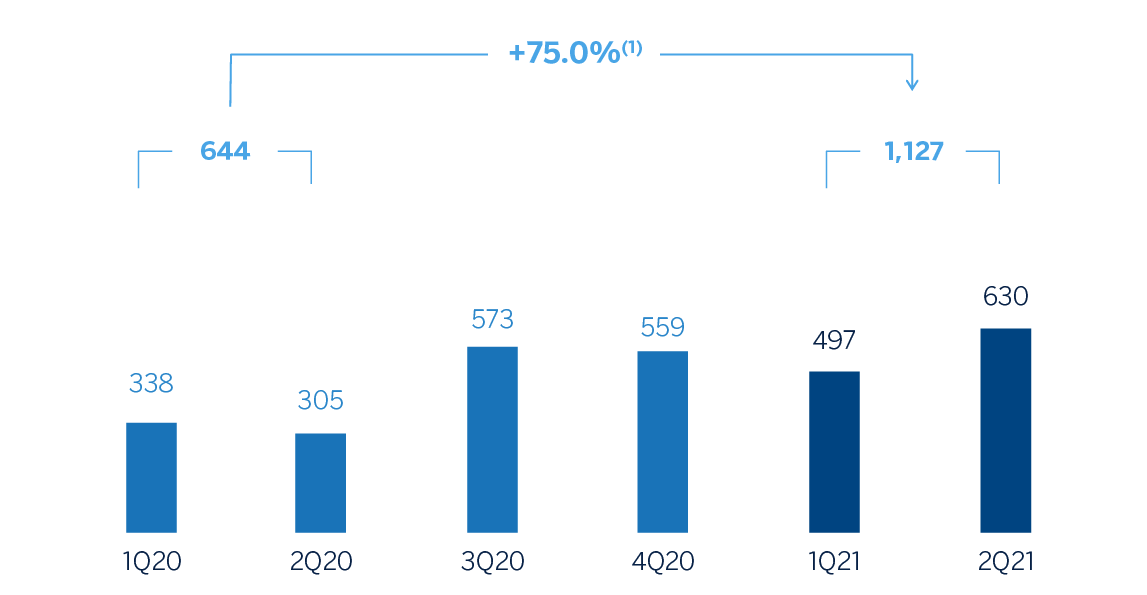
(1) At current exchange rate: +71.8%.
Financial statements and relevant business indicators (Millions of euros and percentage)
| Income statement | 1H 2021 | ∆% | ∆% (1) | 1H 2020 |
|---|---|---|---|---|
| Net interest income | 2,771 | 2.0 | 3.9 | 2,717 |
| Net fees and commissions | 581 | 13.6 | 15.7 | 511 |
| Net trading income | 165 | (28.8) | (27.4) | 232 |
| Other operating income and expenses | 87 | (6.0) | (4.2) | 93 |
| Gross income | 3,604 | 1.4 | 3.3 | 3,553 |
| Operating expenses | (1,267) | 5.4 | 7.4 | (1,202) |
| Personnel expenses | (524) | 6.1 | 8.1 | (494) |
| Other administrative expenses | (585) | 6.6 | 8.6 | (549) |
| Depreciation | (158) | (0.6) | 1.3 | (159) |
| Operating income | 2,337 | (0.6) | 1.3 | 2,351 |
| Impairment on financial assets not measured at fair value through profit or loss | (741) | (46.8) | (45.8) | (1,394) |
| Provisions or reversal of provisions and other results | 9 | n.s. | n.s. | (64) |
| Profit/(loss) before tax | 1,605 | 79.8 | 83.2 | 893 |
| Income tax | (478) | 101.9 | 105.7 | (237) |
| Profit/(loss) for the period | 1,127 | 71.8 | 75.0 | 656 |
| Non-controlling interests | (0) | 68.9 | 72.0 | (0) |
| Net attributable profit/(loss) | 1,127 | 71.8 | 75.0 | 656 |
| Balance sheets | 30-06-21 | ∆% | ∆% (1) | 31-12-20 |
|---|---|---|---|---|
| Cash, cash balances at central banks and other demand deposits | 13,097 | 43.0 | 38.1 | 9,161 |
| Financial assets designated at fair value | 34,697 | (4.6) | (7.8) | 36,360 |
| Of which loans and advances | 1,474 | (43.1) | (45.0) | 2,589 |
| Financial assets at amortized cost | 61,847 | 3.4 | (0.2) | 59,819 |
| Of which loans and advances to customers | 52,874 | 5.7 | 2.1 | 50,002 |
| Tangible assets | 1,661 | 0.9 | (2.6) | 1,647 |
| Other assets | 3,197 | (1.6) | (5.0) | 3,249 |
| Total assets/liabilities and equity | 114,501 | 3.9 | 0.3 | 110,236 |
| Financial liabilities held for trading and designated at fair value through profit or loss | 22,388 | (5.9) | (9.2) | 23,801 |
| Deposits from central banks and credit institutions | 5,349 | 4.4 | 0.8 | 5,125 |
| Deposits from customers | 58,728 | 8.7 | 4.9 | 54,052 |
| Debt certificates | 7,897 | 3.4 | (0.2) | 7,640 |
| Other liabilities | 12,924 | 0.1 | (3.3) | 12,911 |
| Regulatory capital allocated | 7,215 | 7.6 | 3.9 | 6,707 |
| Relevant business indicators | 30-06-21 | ∆% | ∆% (1) | 31-12-20 |
|---|---|---|---|---|
| Performing loans and advances to customers under management (2) | 53,184 | 5.4 | 1.8 | 50,446 |
| Non-performing loans | 1,748 | (3.9) | (7.2) | 1,818 |
| Customer deposits under management (2) | 57,411 | 6.8 | 3.1 | 53,775 |
| Off-balance sheet funds (3) | 24,752 | 9.9 | 6.1 | 22,524 |
| Risk-weighted assets | 62,396 | 2.6 | (0.9) | 60,825 |
| Efficiency ratio (%) | 35.2 | 33.4 | ||
| NPL ratio (%) | 3.1 | 3.3 | ||
| NPL coverage ratio (%) | 118 | 122 | ||
| Cost of risk (%) | 2.83 | 4.02 |
(1) Figures at constant exchange rate.
(2) Excluding repos.
(3) Includes mutual funds and other off-balance sheet funds.
Unless expressly stated otherwise, all the comments below on rates of change, for both activity and results, will be given at constant exchange rate. These rates, together with changes at current exchange rates, can be found in the attached tables of financial statements and relevant business indicators.
Activity
The most relevant aspects related to the area's activity during the first half of 2021 were:
- Lending activity (performing loans under management) grew by 1.8% compared to December 2020. This is mainly explained by the dynamism shown by the retail portfolio, which has benefited from the country's slight economic recovery. Specifically, the mortgage portfolio continues to show positive growth (+3.9%), consumer finance pushes its growth trend (+1.5%) compared to December 2020 and SME financing has increased by 8.7% compared to the end of December 2020. Credit cards also showed an upward growth trend in the six-month period (+1.9%). On the other hand, the wholesale portfolio recorded slight growth compared to the close of December 2020 (+0.9%) despite the slowdown experienced in the quarter, thanks to the good performance of loans to the government and companies (+3.7% and +0.3% respectively, compared to December 2020). As a result, BBVA Mexico's portfolio mix stands at 50% retail and 50% wholesale.
- With regard to asset quality indicators, the NPL ratio increased by 9 basis points in the second quarter of 2021 to 3.1%, even though it remained lower than at the close of December 2020 (3.3%). The NPL coverage ratio decreased to 118%.
- Customer deposits under management showed an increase of 3.1% in the six-month period. This evolution is explained by a growth of 5.3% in demand deposits, especially among retail customers, due to their preference of having liquid balances within an environment of uncertainty due to the pandemic. Meanwhile, there was a shift from time deposits, which showed a contraction between January and June 2021 (-6.0%), toward mutual funds (+6.0%). This has allowed BBVA Mexico to improve its deposits mix, with 82.5% of total deposits in lower-cost transactional funds.
Results
BBVA Mexico achieved a net attributable profit of €1,127m in the first half of 2021, representing a 75.0% increase compared to the same period of the previous year. It should be noted that the first half of 2020 was a historically atypical period with a sharp increase in impairment on financial assets as a result of the worsening macroeconomic scenario following the outbreak of the COVID-19 pandemic in March 2020.
The most relevant aspects related to the income statement are summarized below:
- Net interest income closed higher than the first half of 2020 (+3.9%), due to lower financing costs, the impact of customer support measures against the pandemic approved in the second quarter of 2020 and, to a lesser extent, the improvement in the portfolio mix so far this year. Also notable is the upward trend of the recovery in the new retail loan origination, which is beginning to be reflected in this income statement line.
- Net fees and commissions increased 15.7% thanks to higher billing, especially in credit cards, as well as to those fees related from asset management.
- NTI declined year-on-year by -27.4%, mainly due to volatility in the financial markets, which affected the results of the Global Markets unit (which performed very well in 2020) and lower ALCO portfolio results.
- The other operating income and expenses line recorded a year-on-year decrease of -4.2%, due to a lower contribution from the insurance business, explained by increased claims mainly in the life insurance activity as a result of the pandemic.
- Operating expenses (+7.4%) increased as a result of higher personnel expenses and overheads, explained by an increase in IT expenses and the effect of the Mexican peso depreciating against the US dollar.
- The impairment on financial assets line item decreased significantly compared to the same period of last year (-45.8%), mainly due to additional provisions for COVID-19 recorded in March 2020, which included the effects of a worsening macroeconomic scenario compared to the scenario initially predicted at the beginning of the previous year. With regard to the cumulative cost of risk as of June 2021, it continued on its downward trend and stood at 2.83%.
- The provisions and other results line showed a favorable comparison to the first half of 2020, which included provisions related to contingent risks arising from COVID-19.